Integers and Rational Numbers on Number Lines and Coordinate Planes
Understanding how to place integers and rational numbers on number lines and coordinate planes is a key part of working with real-world data, geometry, and algebra. This lesson explains how to locate and position integers and other rational numbers on horizontal and vertical number lines, and how to plot ordered pairs on the coordinate plane.
1. Integers and Rational Numbers: A Quick Review
Integers are whole numbers and their opposites: \(...,-3,-2,-1,0,1,2,3,...\). They include negative numbers, zero, and positive numbers.
Rational numbers are numbers that can be written as a fraction \(\frac{a}{b}\) where \(a\) and \(b\) are integers and \(b\neq 0\). Examples: \(-4,\;0,\;\frac{1}{2},\;-\frac{7}{3},\;2.5,\;-0.75\). Decimals that end (like 2.5) or repeat (like 0.333...) are rational numbers.
2. The Horizontal Number Line
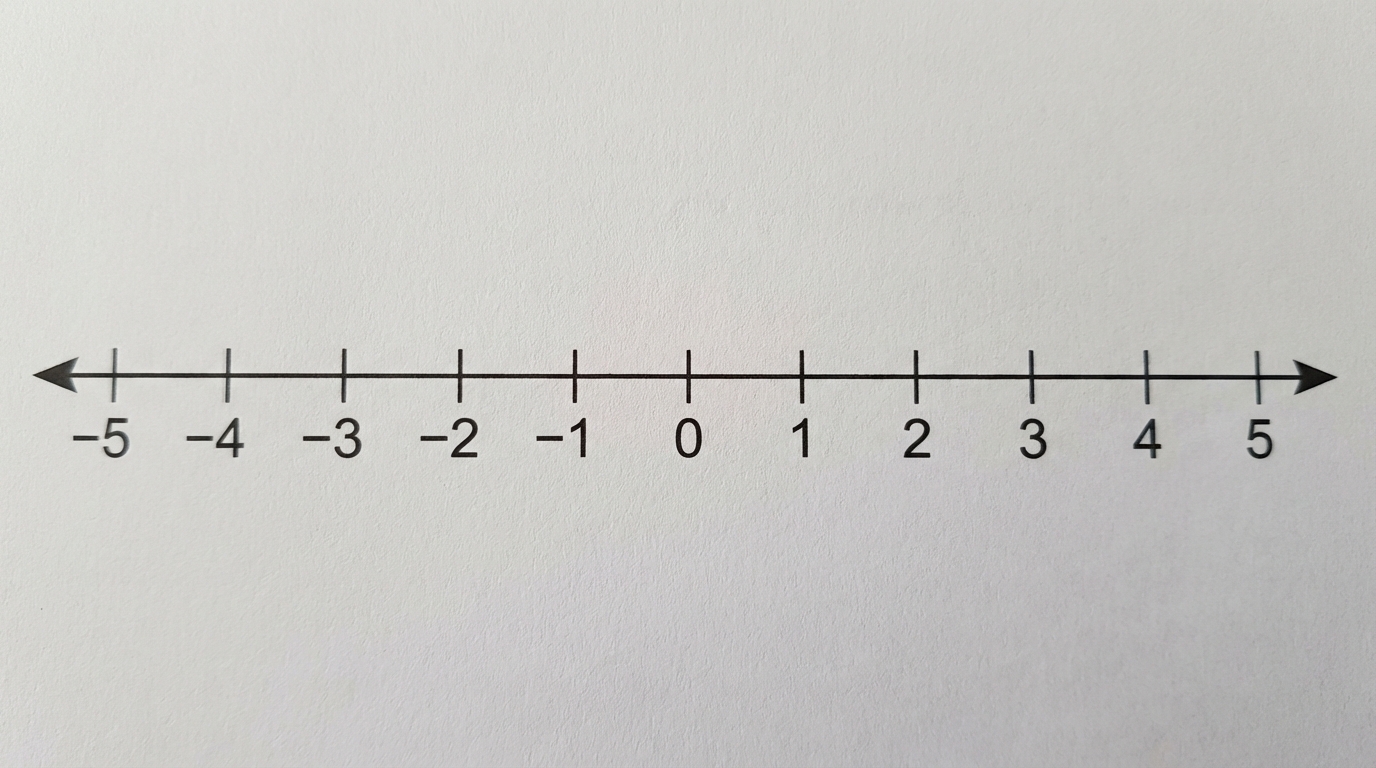
A horizontal number line is a straight line drawn from left to right.
Horizontal number line with ticks from -5 to 5, showing 0 in the center
Key features of a horizontal number line:
A point in the center is labeled 0. This is called the origin.
Numbers to the right of 0 are positive: 1, 2, 3, ...
Numbers to the left of 0 are negative: -1, -2, -3, ...
The distance between any pair of neighboring integers (like 2 and 3) is equal. This distance is usually 1 unit.
Each integer is represented by a point on the line. The position tells you its value and its sign (positive or negative).
3. Placing Integers on a Horizontal Number Line
To place an integer on a horizontal number line:
Draw a straight horizontal line.
Mark a point at the center and label it 0.
Choose a scale (usually 1 unit between ticks).
Count units to the right for positive integers, and to the left for negative integers.
Example positions:
To graph 4: start at 0, move 4 units to the right, and place a point.
To graph -3: start at 0, move 3 units to the left, and place a point.
4. Placing Rational Numbers on a Horizontal Number Line
Rational numbers include fractions and decimals, so we often need to divide each unit into smaller equal parts.
Steps to place a fraction \(\frac{a}{b}\) on a horizontal number line:
Mark 0 and 1 on the number line.
Divide the segment from 0 to 1 into \(b\) equal parts.
Starting from 0, count \(a\) parts to the right if the fraction is positive, or to the left if it is negative.
Example 1: Place \(-\frac{3}{4}\) on the number line.
Mark 0 on the number line.
Between 0 and -1, divide into 4 equal parts (because the denominator is 4).
Starting at 0, move 3 of those parts to the left to reach \(-\frac{3}{4}\).
Placing decimals: To place a decimal such as 1.5 or -0.2, you can convert the decimal into a fraction or think about its position between integers.
1.5 is halfway between 1 and 2.
-0.2 is between 0 and -1, closer to 0 than to -1.
5. The Vertical Number Line
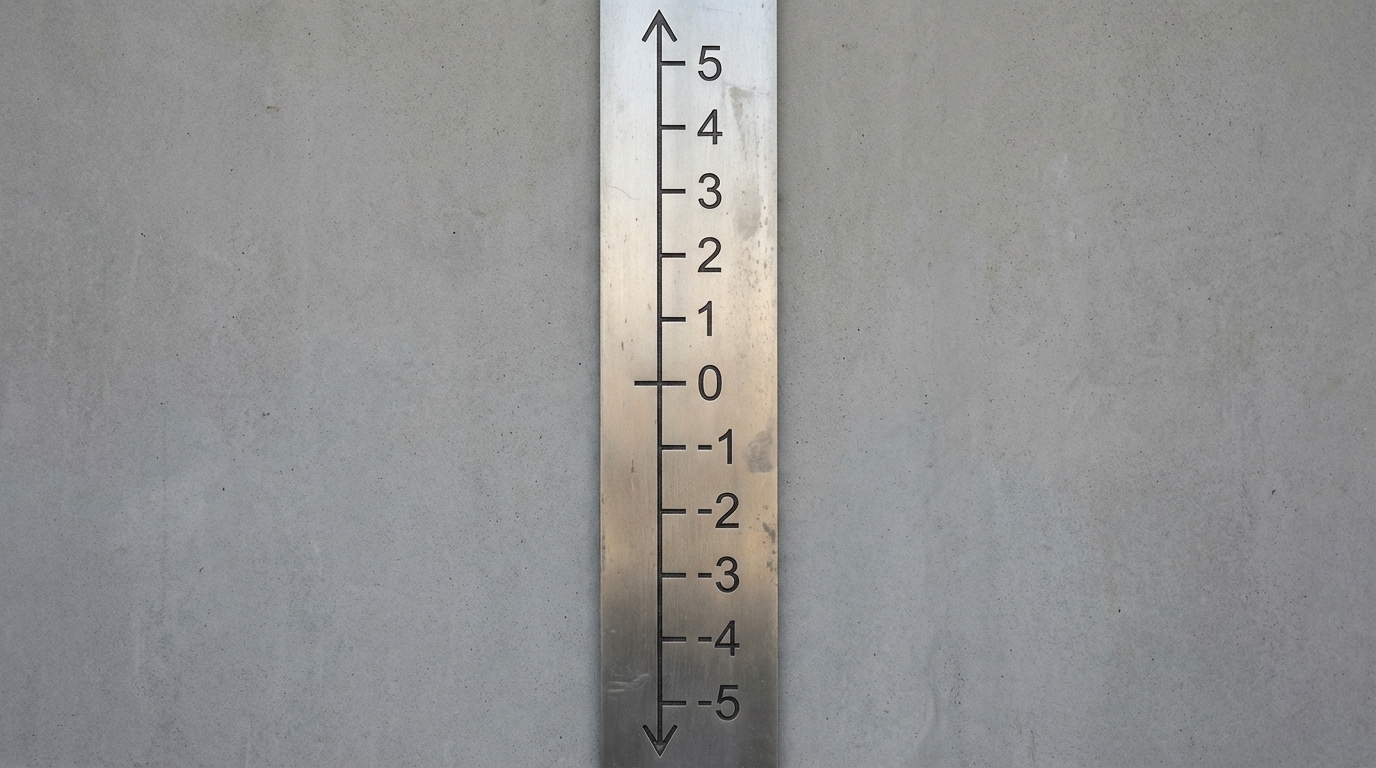
A vertical number line is a straight line drawn from bottom to top.
Vertical number line with ticks from -5 at bottom to 5 at top, 0 in the middle
Key features of a vertical number line:
0 is usually in the center.
Numbers above 0 are positive.
Numbers below 0 are negative.
The distance between neighboring integers is 1 unit (if you choose that scale).
Placing numbers on a vertical line is like placing them on a horizontal line, but you move up for positive numbers and down for negative numbers.
Examples:
Graph 3 on a vertical line: start at 0, move up 3 units, and plot the point.
Graph -2 on a vertical line: start at 0, move down 2 units, and plot the point.
6. Comparing Positions: Greater, Less, and Opposites
The number line helps compare numbers.
On a horizontal line, a number is greater if it is to the right of another number.
On a vertical line, a number is greater if it is higher than another number.
Two numbers are called opposites if they are the same distance from 0 but on opposite sides. For example, 3 and -3 are opposites.
On both horizontal and vertical lines, the number closer to 0 has smaller absolute value. The absolute value of a number is its distance from 0, written \(|x|\). For example, \(|-4|=4\) and \(|3|=3\).
7. Introducing the Coordinate Plane
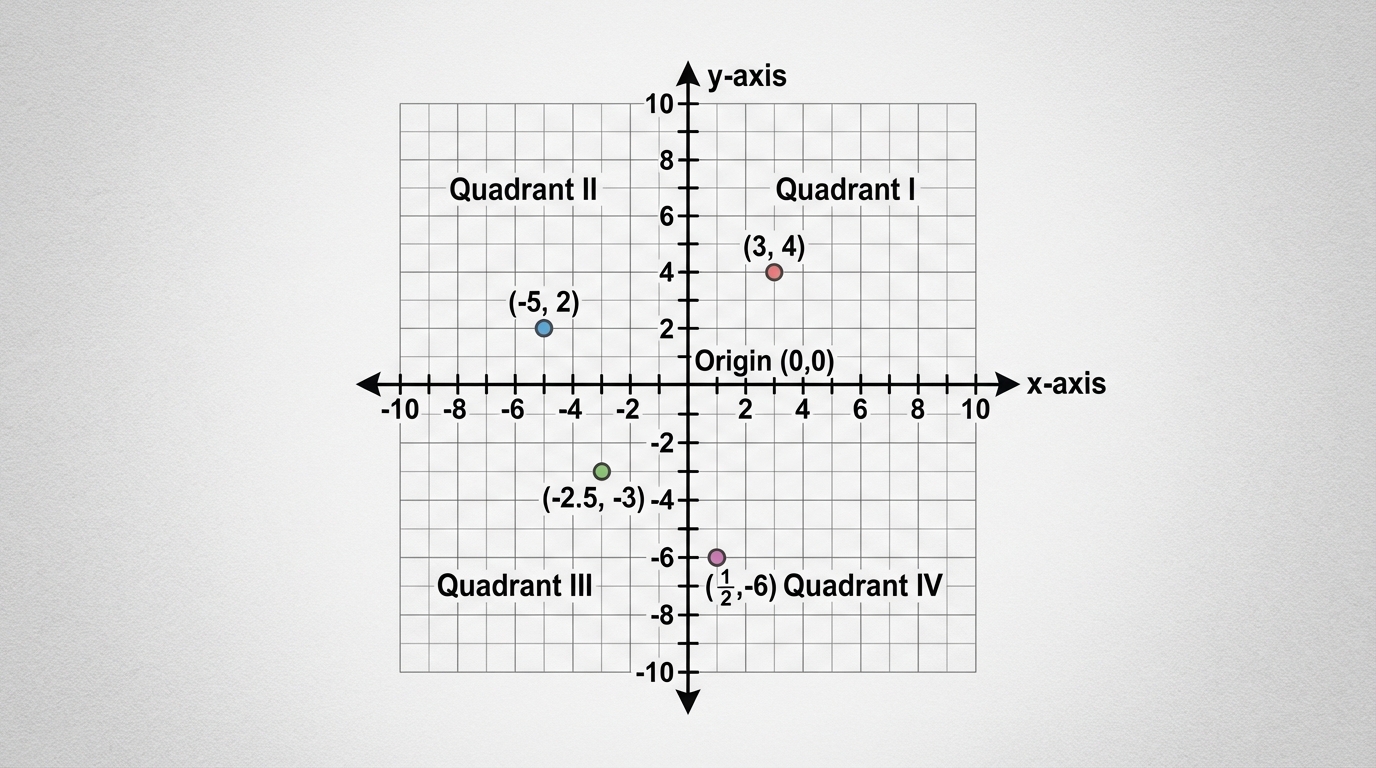
The coordinate plane is made from two number lines crossing at right angles.
Coordinate plane with x-axis horizontal, y-axis vertical, showing all four quadrants and the origin
Parts of the coordinate plane:
x-axis: the horizontal number line.
y-axis: the vertical number line.
Origin: the point where they meet, labeled \((0,0)\).
The plane is divided into four quadrants:
Using \((x,y)\) to describe points:
Quadrant I: x positive, y positive (top-right).
Quadrant II: x negative, y positive (top-left).
Quadrant III: x negative, y negative (bottom-left).
Quadrant IV: x positive, y negative (bottom-right).
8. Ordered Pairs and Their Meaning
A point on the coordinate plane is written as an ordered pair\((x,y)\).
\(x\) is the x-coordinate (or abscissa): how far to move left or right from the origin.
\(y\) is the y-coordinate (or ordinate): how far to move up or down from the origin.
The order matters: \((x,y)\) is not the same as \((y,x)\).
Example: The point \((2,5)\) means move 2 units to the right, then 5 units up. The point \((5,2)\) is 5 units to the right and 2 units up. They are different points.
9. Plotting Integer Pairs on the Coordinate Plane
To plot a point \((x,y)\) where x and y are integers, follow these steps:
Start at the origin \((0,0)\).
Use the x-coordinate: move right if x is positive, left if x is negative.
From that point, use the y-coordinate: move up if y is positive, down if y is negative.
Mark the point and label it with its coordinates.
Example 2 (Step-by-step): Plot \((3,-2)\).
Start at the origin \((0,0)\).
x = 3, so move 3 units to the right along the x-axis.
From there, y = -2, so move 2 units down.
Place a point and label it \((3,-2)\). This point is in Quadrant IV (x positive, y negative).
Example 3 (Step-by-step): Plot \((-4,1)\).
Start at the origin.
x = -4, so move 4 units to the left.
From that point, y = 1, so move 1 unit up.
Place a point and label it \((-4,1)\). This point is in Quadrant II (x negative, y positive).
Points on the axes:
If x = 0, the point is on the y-axis, for example \((0,3)\) or \((0,-5)\).
If y = 0, the point is on the x-axis, for example \((4,0)\) or \((-2,0)\).
10. Plotting Rational Number Pairs on the Coordinate Plane
Now consider ordered pairs made of rational numbers like fractions and decimals, for example \((1.5,-0.5)\) or \(-\frac{3}{2},\frac{2}{3}\).
Steps to plot \((x,y)\) with rational coordinates:
Draw the coordinate plane with equal scales on both axes. For example, each grid square might represent 0.5 units.
Locate x on the x-axis (using fraction or decimal positions).
From that point, move up or down according to y.
Mark and label the point.
Example 4 (Step-by-step): Plot \((1.5,2)\).
Start at the origin.
x = 1.5. Move 1.5 units to the right. This is halfway between 1 and 2.
From that point, y = 2. Move 2 units up.
Mark the point and label it \((1.5,2)\).
Example 5 (Step-by-step): Plot \((-\frac{3}{2},-1)\).
Start at the origin.
x = \(-\frac{3}{2}=-1.5\). Move 1.5 units to the left.
From that position, y = -1. Move 1 unit down.
Mark the point and label it \((-\frac{3}{2},-1)\).
11. Solved Examples (Number Lines and Coordinate Plane)
Solved Example 1: Place \(-2,\;\frac{3}{2},\;-\frac{5}{4}\) on a horizontal number line.
Step 1: Draw a horizontal line and mark 0 in the center.
Step 2: Place -2.
From 0, move 2 units left and mark -2.
Step 3: Place \(\frac{3}{2}\).
Recognize that \(\frac{3}{2}=1.5\).
Locate 1 and 2 on the right side of 0.
Place a point halfway between 1 and 2 and label it \(\frac{3}{2}\).
Step 4: Place \(-\frac{5}{4}\).
Note that \(\frac{5}{4}=1.25\), so \(-\frac{5}{4}\) is -1.25.
Locate -1 and -2 on the left side of 0.
Move from -1 another 0.25 units toward -2 and place the point, labeling it \(-\frac{5}{4}\).
Now all three numbers are correctly positioned, showing their order from left to right: \(-2 < -\frac{5}{4} < 0 < \frac{3}{2}\).
Solved Example 2: Plot and identify the quadrant for points \((2,3),\;(-1,4),\;(-3,-2),\;(5,-1)\).
Point \((2,3)\):
From the origin, move 2 units right (x = 2).
From there, move 3 units up (y = 3).
The point lies in Quadrant I (x positive, y positive).
Point \((-1,4)\):
From the origin, move 1 unit left (x = -1).
From there, move 4 units up (y = 4).
The point lies in Quadrant II (x negative, y positive).
Point \((-3,-2)\):
From the origin, move 3 units left (x = -3).
From there, move 2 units down (y = -2).
The point lies in Quadrant III (x negative, y negative).
Point \((5,-1)\):
From the origin, move 5 units right (x = 5).
From there, move 1 unit down (y = -1).
The point lies in Quadrant IV (x positive, y negative).
Solved Example 3: Find the coordinates of a point using a grid.
Suppose a point P lies on a coordinate grid. From the origin to P, count 4 units to the right and 3 units down.
Right 4 units means x = 4.
Down 3 units means y = -3.
So the coordinates of P are \((4,-3)\).
This point is located in Quadrant IV.
12. Real-World Applications
Temperatures and Elevations (Number Lines)
Number lines are used to represent quantities that go above and below a reference level.
Temperature: A thermometer is like a vertical number line. Temperatures above 0°C are positive, and those below 0°C are negative. For example, -5°C is 5 units below 0 on the thermometer.
Elevation: Sea level can be marked as 0 on a vertical number line. Elevations above sea level (like 500 m) are positive, and those below sea level (like -30 m) are negative.
Maps and Navigation (Coordinate Plane)
Maps and grids use coordinates to locate places.
Cities or locations can be marked on a grid using coordinates \((x,y)\). For example, a treasure on a map might be at \((4,6)\).
Video games often use a coordinate system to control the position of characters or objects on the screen.
Robots and drones can follow paths given by a series of coordinate points.
Data and Graphs
Many graphs in science, economics, and everyday life use coordinate planes:
A graph showing time on the x-axis and distance on the y-axis can show how far someone travels over time.
A graph with temperature on the x-axis and ice cream sales on the y-axis can show how temperature affects sales.
Each point on these graphs is an ordered pair that tells you how two quantities are related.
13. Summary of Key Ideas
Integers and rational numbers can be placed on both horizontal and vertical number lines. Positive numbers lie to the right of 0 on a horizontal line and above 0 on a vertical line. Negative numbers lie to the left of 0 on a horizontal line and below 0 on a vertical line. Rational numbers, including fractions and decimals, are placed by dividing units into equal parts and locating the correct position between integers.
The coordinate plane is formed by a horizontal x-axis and a vertical y-axis intersecting at the origin \((0,0)\). Any point on this plane is represented by an ordered pair \((x,y)\), where x tells the left-right movement and y tells the up-down movement. The plane is divided into four quadrants based on the signs of x and y. Plotting integer and rational-number pairs allows you to represent real-world situations, create graphs, and describe locations precisely.