A spacecraft was once lost because one team used imperial units and another used metric units. That is not just a dramatic story from science and engineering; it is a reminder that units are part of the mathematics, not an afterthought. When you solve a problem involving distance, speed, money, time, area, or data, the units tell you what the numbers mean, what operations make sense, and whether your answer is even possible.
In everyday life, numbers rarely appear alone. A speed, which is a rate, of \(60\) means almost nothing unless it is \(60 \textrm{ miles per hour}\), \(60 \textrm{ meters per second}\), or \(60\%\). A mass of \(5\) could mean \(5 \textrm{ grams}\) or \(5 \textrm{ kilograms}\), and those are very different. Units provide the context that turns a number into a meaningful quantity.
Units also act like a built-in error detector. If you add \(3 \textrm{ meters}\) and \(5 \textrm{ seconds}\), the expression makes no physical sense because distance and time measure different kinds of quantities. If your work leads to an answer in \(\textrm{m}^2\) when the question asks for a speed, that tells you something went wrong.
Quantity is a measurable attribute such as length, time, mass, cost, or temperature.
Unit is the agreed-upon standard used to measure a quantity, such as meters, seconds, liters, or dollars.
Rate compares two different quantities with different units, such as \(\textrm{miles per hour}\), \(\textrm{dollars per ticket}\), or \(\textrm{grams per cubic centimeter}\).
Scale on a graph is the amount represented by each interval on an axis, and the origin is the point where the axes intersect, often \((0,0)\).
When mathematicians say to reason quantitatively, they mean more than computing. They mean understanding what each quantity represents, how quantities are related, and how units help express those relationships clearly.
Some units are simple units, such as \(\textrm{cm}\), \(\textrm{s}\), and \(\textrm{kg}\). Others are compound units, formed by combining units through multiplication or division. For example, area is measured in square units like \(\textrm{m}^2\), volume in cubic units like \(\textrm{cm}^3\), and speed in units like \(\textrm{km/h}\).
A formula often reveals the unit relationship. If distance is found by multiplying speed by time, then the unit of distance comes from \((\textrm{distance/time}) \times (\textrm{time})\), leaving only distance. Symbolically, if \(d = rt\), then the units behave like this: \((\textrm{miles/hour}) \times (\textrm{hours}) = \textrm{miles}\).
This is why units are not separate from formulas. They travel through the calculation and show whether the structure of the work is reasonable.
To convert a measurement, multiply by a form of \(1\) written as a ratio of equal quantities. For example, since \(1 \textrm{ hour} = 60 \textrm{ minutes}\), both \(\dfrac{1 \textrm{ hour}}{60 \textrm{ minutes}}\) and \(\dfrac{60 \textrm{ minutes}}{1 \textrm{ hour}}\) are equal to \(1\). The correct choice is the one that makes unwanted units cancel.
It is also important to distinguish between units that sound similar but measure different ideas. For example, \(\textrm{m/s}\) measures speed, while \(\textrm{m}^2\) measures area. One tells how fast something changes position; the other tells how much surface is covered.
Before solving a multi-step problem, identify what is given and what is being asked. Then attach units to each value. This simple habit often reveals the pathway to the solution. If the question asks for total cost in dollars and you are given hours worked and dollars per hour, then multiplying is reasonable because \((\textrm{hours}) \times (\textrm{dollars/hour}) = \textrm{dollars}\).
Units can also tell you whether to add, subtract, multiply, or divide. Quantities with the same units are often added or subtracted: \(3 \textrm{ liters} + 2 \textrm{ liters} = 5 \textrm{ liters}\). Quantities with different units often form a product or quotient: \((4 \textrm{ tickets}) \times (\$12 \textrm{ per ticket}) = \$48\), or \((120 \textrm{ miles}) \div (2 \textrm{ hours}) = 60 \textrm{ miles/hour}\).
Reasonableness matters too. If a runner completes \(100 \textrm{ meters}\) in \(10 \textrm{ seconds}\), the speed is \(10 \textrm{ m/s}\). A result of \(0.1 \textrm{ m/s}\) would be suspicious because it would imply an extremely slow pace. Units help, but common sense must work with them.
Units as a guide to operations
One of the most powerful habits in problem solving is asking, "What units should the answer have?" If the answer should be in \(\textrm{gallons}\), then your operations should gradually simplify to gallons. If the answer should be in \(\textrm{square feet}\), then some multiplication of lengths is likely involved. Thinking about the destination unit helps you choose a path.
This idea becomes even more useful when problems involve several steps, multiple conversions, or formulas with more than one measured quantity.
[Figure 1] In a long calculation, units can function like signposts. A conversion factor changes the unit name without changing the actual amount, and careful cancellation keeps the meaning intact. Instead of trying to remember disconnected rules, you can let the units guide each step.
Suppose you need to convert \(55 \textrm{ miles/hour}\) to \(\textrm{meters/second}\). You can write a chain of equal ratios so that unwanted units cancel. Each fraction is chosen because it equals \(1\), but the order matters.
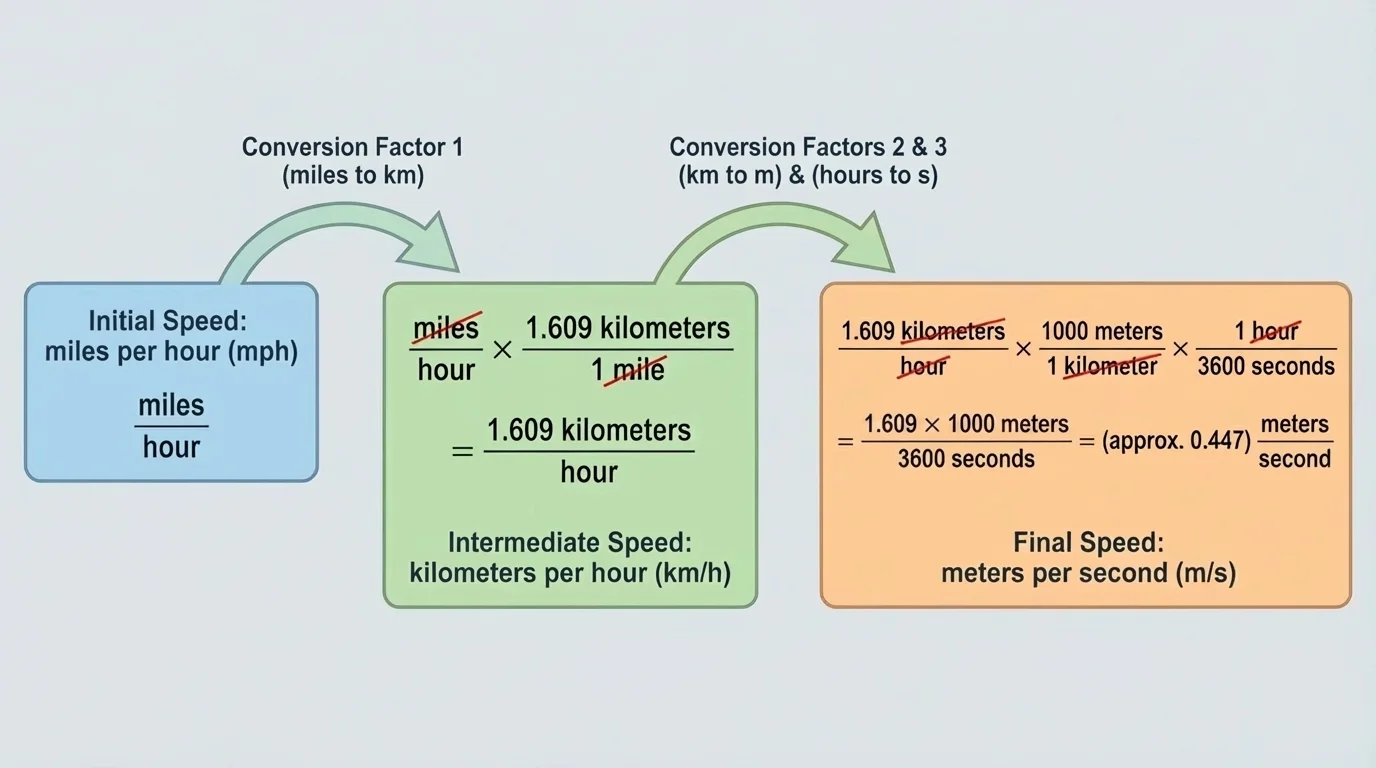
For example, start with \(55 \textrm{ miles/hour}\). Multiply by \(\dfrac{1.609 \textrm{ km}}{1 \textrm{ mile}}\) to change miles to kilometers, then by \(\dfrac{1{,}000 \textrm{ m}}{1 \textrm{ km}}\), and finally by \(\dfrac{1 \textrm{ hour}}{3{,}600 \textrm{ s}}\) to change hours in the denominator to seconds. The units \(\textrm{mile}\), \(\textrm{km}\), and \(\textrm{hour}\) cancel, leaving \(\textrm{m/s}\).
This technique is often called dimensional analysis. It is especially powerful in science, medicine, and engineering because calculations may involve several linked conversions, such as dosage per kilogram, flow rate per minute, or energy per unit mass.
Be careful with square and cubic units. If \(1 \textrm{ foot} = 12 \textrm{ inches}\), then \(1 \textrm{ ft}^2 = 144 \textrm{ in}^2\), not \(12 \textrm{ in}^2\). Squaring or cubing affects both the number and the unit.
Many formulas are only meaningful if the units are consistent. If a formula uses meters for length, then all related lengths should be converted to meters before substitution. Mixing centimeters and meters in the same area formula can produce an incorrect result unless everything is converted first.
Consider the formula for density:
\[\textrm{density} = \frac{\textrm{mass}}{\textrm{volume}}\]
If mass is measured in \(\textrm{g}\) and volume in \(\textrm{cm}^3\), then density is measured in \(\textrm{g/cm}^3\). If the same object is measured in \(\textrm{kg}\) and \(\textrm{m}^3\), the numerical value changes because the units change, even though the physical density of the object is the same.
Another common example is area. For a rectangle, \(A = lw\). If \(l = 2 \textrm{ m}\) and \(w = 30 \textrm{ cm}\), then you should first convert \(30 \textrm{ cm}\) to \(0.30 \textrm{ m}\), so \(A = (2)(0.30) = 0.60 \textrm{ m}^2\). If you multiply \(2\) and \(30\) without converting, the result has mixed units and is not properly interpreted.
Medicine depends on unit precision constantly. A dosage might be prescribed as \(5 \textrm{ mg/kg}\), which means the amount must be adjusted to a patient's body mass. A unit mistake in that calculation could be dangerous.
Formulas may also produce rates. For example, average speed is \(v = \dfrac{d}{t}\), so if distance is in kilometers and time is in hours, speed is in \(\textrm{km/h}\). If time is in minutes instead, the result is in \(\textrm{km/min}\), which may still be correct mathematically but may not be the most useful unit for the context.
[Figure 2] Numbers can be accurate and still be presented in a misleading way. The choice of scale and origin affects how a graph looks and how quickly a viewer interprets it. The same data can appear dramatic or modest depending on these choices.
When creating a graph, choose axis units that match the situation. Time might be measured in seconds, minutes, days, or years. Distance might be measured in centimeters, meters, or kilometers. The best choice helps the viewer see the pattern clearly without crowding the graph or stretching it unnecessarily.
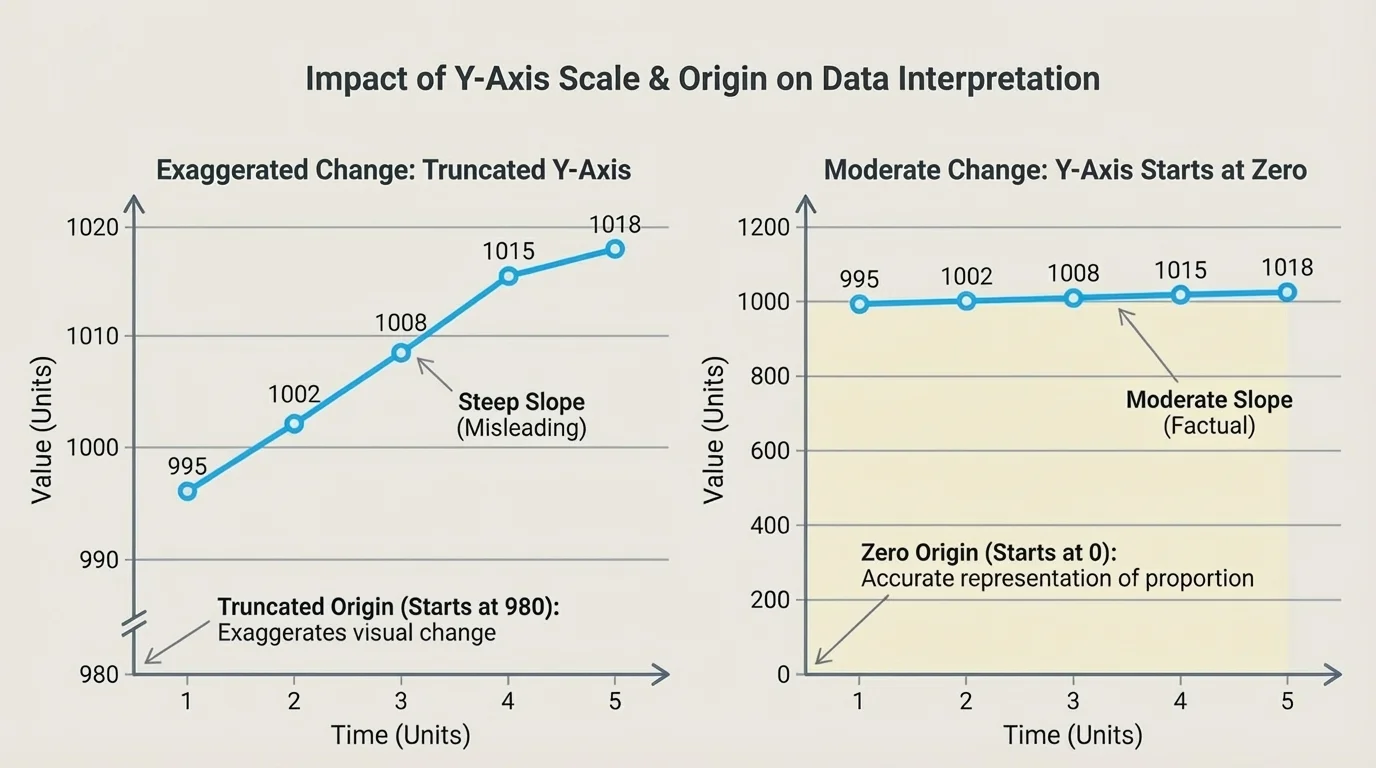
The origin matters especially in bar graphs and some comparisons. Starting a bar graph at a value other than \(0\) can exaggerate small differences. In line graphs, a nonzero origin may sometimes be useful for focusing on small changes, but it must be interpreted carefully. A steep-looking line does not always mean a huge change; the scale may be compressed.
Suppose a stock price rises from \(\$98\) to \(\$102\). If the vertical axis runs from \(\$97\) to \(\$103\), the increase appears dramatic. If the axis runs from \(\$0\) to \(\$120\), the change appears small. Both graphs can be technically correct, but they communicate very different impressions. That is why readers should always check the axis labels and intervals.
Unequal intervals can also distort meaning. If one tick mark represents \(1\) unit and the next represents \(10\) units, the graph may confuse the viewer unless the scale is clearly explained. Consistency helps graphs communicate honestly.
[Figure 3] Worked problems reveal how units help organize thinking. In many real situations, the unit structure tells you the sequence of operations before you even compute. Graphs can also represent relationships between quantities, and a graph with a clear starting value and rate can make a formula easier to interpret.
Worked example 1: Fuel cost for a road trip
A car travels \(180 \textrm{ miles}\). It averages \(30 \textrm{ miles per gallon}\), and gasoline costs \(\$3.60\) per gallon. Find the fuel cost.
Step 1: Identify the target unit.
The answer should be in dollars. Since we have miles, miles per gallon, and dollars per gallon, first find gallons used.
Step 2: Use the rate to find gallons.
\(180 \textrm{ miles} \div 30 \textrm{ miles/gallon} = 6 \textrm{ gallons}\).
Step 3: Convert gallons to cost.
\(6 \textrm{ gallons} \times \$3.60 \textrm{ per gallon} = \$21.60\).
The trip uses \(6 \textrm{ gallons}\) of fuel and costs \(\$21.60\).
Notice how the units guided the structure: miles changed into gallons, and gallons changed into dollars. That is exactly what a multi-step problem should feel like when units are used well.
Worked example 2: Area with mixed units
A rectangular garden is \(8 \textrm{ m}\) long and \(250 \textrm{ cm}\) wide. Find its area in square meters.
Step 1: Make the units consistent.
Convert \(250 \textrm{ cm}\) to meters: \(250 \textrm{ cm} = 2.5 \textrm{ m}\).
Step 2: Use the area formula.
\(A = lw = (8 \textrm{ m})(2.5 \textrm{ m})\).
Step 3: Compute and attach units correctly.
\(A = 20 \textrm{ m}^2\).
The area is \(20 \textrm{ m}^2\).
This example shows why consistency matters. If you multiply \(8\) by \(250\) without converting, the result does not directly represent square meters.
Worked example 3: Converting speed
A cyclist rides at \(12 \textrm{ m/s}\). Express this speed in \(\textrm{km/h}\).
Step 1: Set up conversion factors.
Use \(\dfrac{1 \textrm{ km}}{1{,}000 \textrm{ m}}\) and \(\dfrac{3{,}600 \textrm{ s}}{1 \textrm{ hour}}\).
Step 2: Multiply so units cancel.
\(12 \textrm{ m/s} \times \dfrac{1 \textrm{ km}}{1{,}000 \textrm{ m}} \times \dfrac{3{,}600 \textrm{ s}}{1 \textrm{ hour}}\).
Step 3: Compute.
\(12 \times \dfrac{3{,}600}{1{,}000} = 43.2\).
The speed is \(43.2 \textrm{ km/h}\).
The cancellation of units is not just neat formatting; it tells you that the conversion was organized correctly.
Worked example 4: Interpreting a graph with a nonzero origin
A school tracks daily attendance for one week: \(940\), \(944\), \(947\), \(945\), and \(949\) students. A graph shows the vertical axis from \(938\) to \(950\).
Step 1: Identify what the graph emphasizes.
Because the axis starts at \(938\) instead of \(0\), small differences look larger.
Step 2: Interpret carefully.
The attendance changes by at most \(949 - 940 = 9\) students, which is a small change compared with the full school population.
Step 3: State the conclusion honestly.
The graph highlights day-to-day variation, but it should not be read as showing a dramatic overall change.
A graph can focus attention, but the axis labels must always be checked before drawing conclusions.
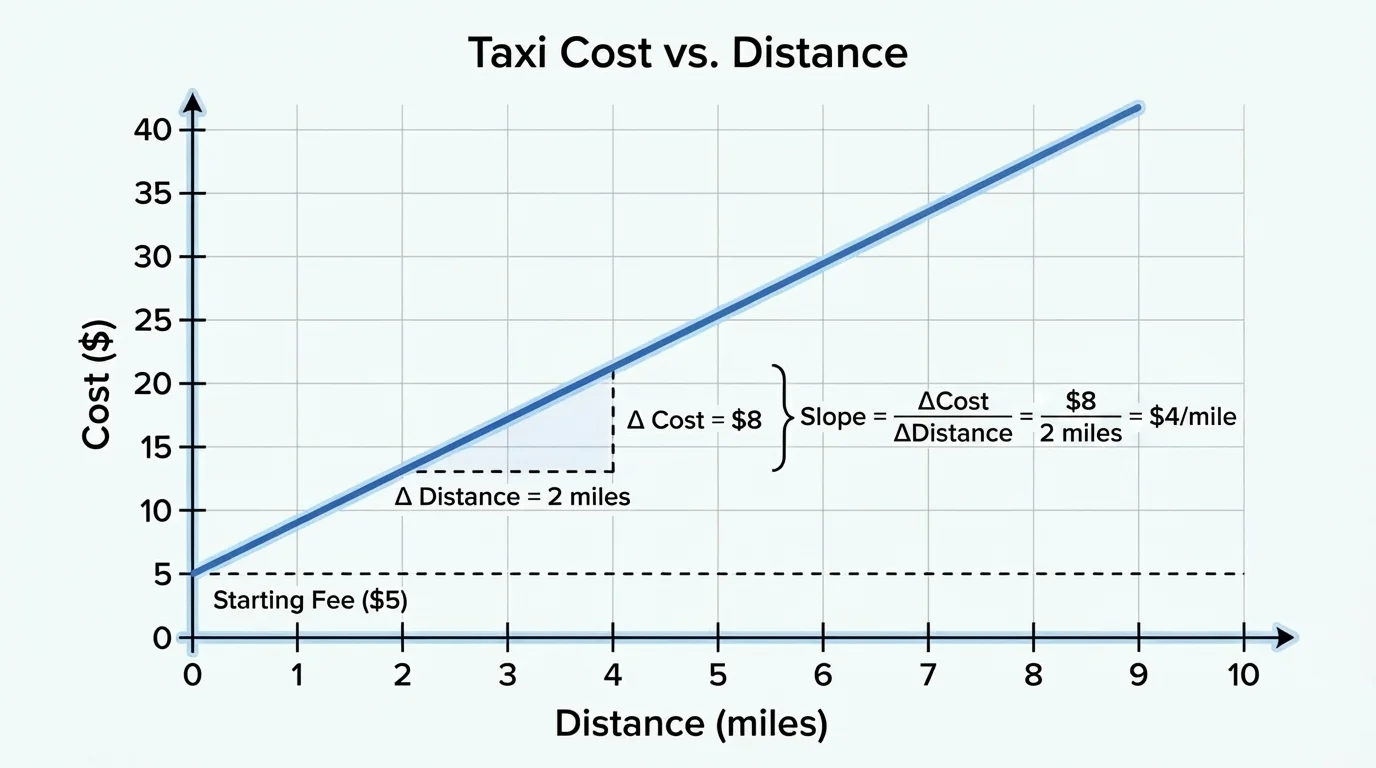
A similar graphing situation occurs with taxi fares. If the graph begins above \(0\) on the cost axis, the relationship still shows a fixed starting fee and a rate per mile, but students must interpret the intercept and scale carefully rather than just trusting the steepness by sight.
Units are central in science. A chemist may compare grams of solute per liter of solution. A physicist might use meters per second for velocity and newtons for force. In environmental science, rainfall may be measured in millimeters while river flow is measured in cubic meters per second. The quantities differ, so the units must too.
In sports, analysts use rates constantly: points per game, meters per second, heartbeats per minute, and shooting percentage. In engineering, materials may be chosen based on density, cost per unit mass, or strength per unit area. In finance, interest rates, price per item, and earnings per hour all rely on understanding compound units correctly.
Healthcare is especially unit-sensitive. Blood oxygen may be recorded as a percentage, medication as milligrams, and infusion flow as milliliters per hour. A dosage formula with inconsistent units is not a small mistake; it can change a patient's treatment.
Graph scale matters in news and business too. A graph about inflation, unemployment, climate data, or election results can shape public opinion depending on whether the axis scale is fair and transparent. The same caution you use in class applies to media you see every day, because scale can amplify or soften the visual message.
One common mistake is dropping units during the middle of a calculation. Keep them attached to every quantity until the end. Another mistake is forgetting that squared or cubed measurements require squared or cubed conversions. A third is substituting mixed units into a formula without converting first.
Students also sometimes trust graphs too quickly. Always ask: What are the axis units? Are the intervals equal? Does the graph start at \(0\)? Is the scale chosen to clarify or to exaggerate?
A useful strategy is to write a short unit sentence before computing. For example: \((\textrm{miles}) \div (\textrm{miles/gallon}) = \textrm{gallons}\). That small line often prevents large mistakes. Another strategy is to estimate. If a trip is about \(200 \textrm{ miles}\) and the car gets about \(25 \textrm{ miles/gallon}\), you expect around \(8\) gallons. An exact answer near \(0.8\) or \(80\) gallons would immediately look wrong.
"The numbers are only half the story; the units tell you what story the numbers are telling."
Strong mathematical reasoning includes both computation and interpretation. A correct number with the wrong unit is not a correct answer. A graph with accurate data but misleading scale is not clear communication. Units, scale, and origin all help turn arithmetic into meaning.