A surprising number of news headlines make a strong claim from weak evidence. One article says students who sleep with phones nearby get lower grades. Another says people who eat breakfast score higher on tests. Another says more screen time causes anxiety. These claims may sound convincing, especially when they are based on real data. But data can show that two things happen together without proving that one causes the other. Learning to tell the difference is one of the most important parts of understanding statistics.
When you compare two variables, you are looking for a relationship. For example, you might compare hours of study and test scores, temperature and ice cream sales, or practice time and free-throw percentage. Sometimes the variables move together in a clear pattern. Sometimes they do not. The key question is this: does the pattern mean one variable actually changes the other, or are they simply connected in some other way?
Correlation means that two variables are associated, or tend to change together in a pattern. Causation means that a change in one variable produces a change in another variable. Correlation describes a relationship; causation explains a reason for the relationship.
[Figure 2] That difference sounds small, but it is huge. If a doctor, scientist, coach, or business leader confuses correlation with causation, the decisions based on the data may be wrong. A correlation can be useful and meaningful, but it is not automatically proof of cause and effect.
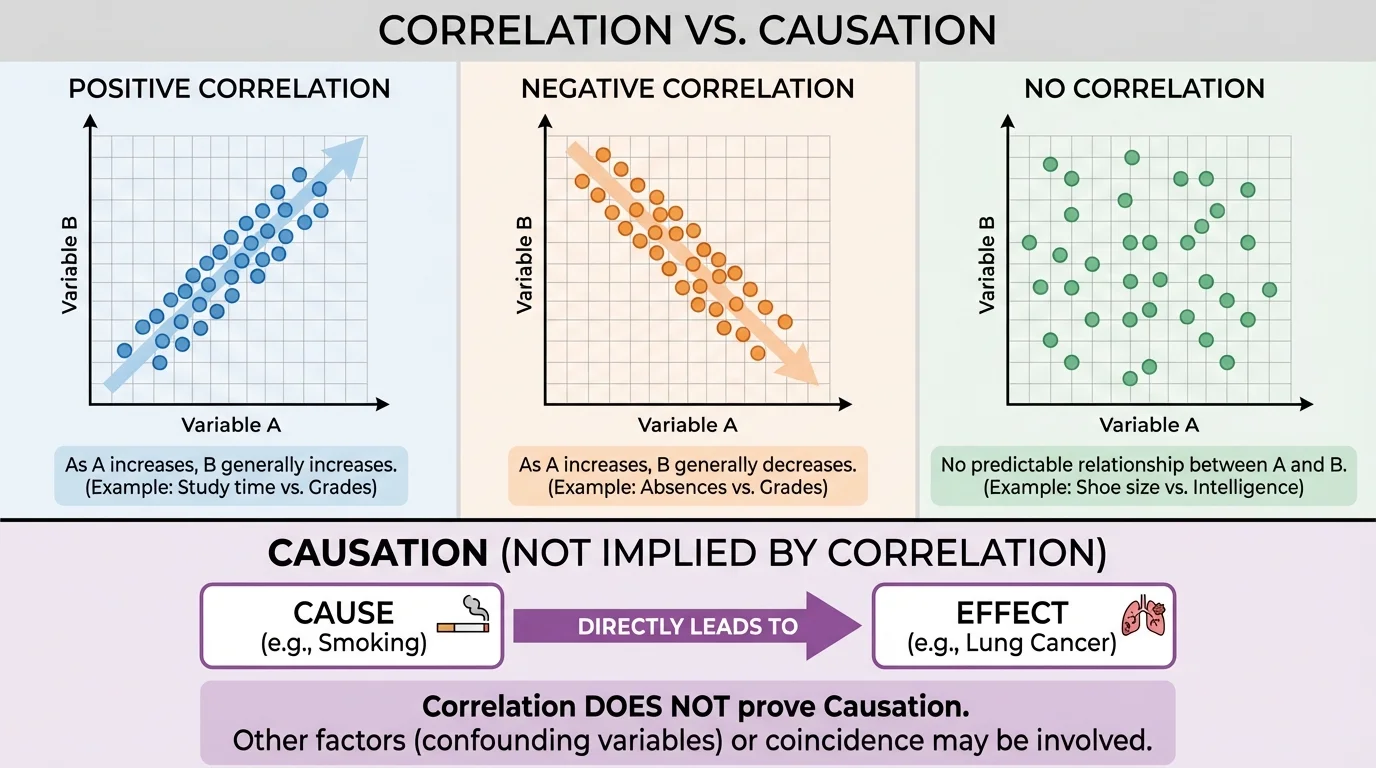
A correlation tells us that two variables are related in some way. If one variable tends to increase when the other increases, that is called a positive correlation. If one tends to decrease when the other increases, that is called a negative correlation. If there is no clear pattern, there may be little or no correlation.
One common way to see correlation is with a scatter plot. Each point represents one pair of data values. When the points form an upward pattern, the variables show positive association; when they form a downward pattern, they show negative association; when the points look random, the association is weak or absent. A visual comparison like [Figure 1] makes it easier to notice direction and strength before making claims about what the relationship means.
Suppose a class records hours studied and quiz scores. If students who studied more often earned higher scores, the data might show a positive correlation. That does not immediately prove that studying caused the higher scores, although it may be a reasonable possibility. A graph can show a pattern, but it cannot by itself explain why the pattern exists.
Correlation can be strong or weak. A strong correlation means the points stay close to a clear pattern. A weak correlation means the pattern is more scattered. Correlation can also be described by a number called the correlation coefficient, often written as r, where values near \(1\) indicate strong positive association, values near \(-1\) indicate strong negative association, and values near \(0\) indicate weak linear association. For many school-level situations, however, the graph and context matter even more than the number alone.
It is also important to remember that correlation usually describes a pattern in data, not a perfect rule. Real-world data are messy. Even if there is a trend, not every point will fit it exactly. In the study example, one student might study for a long time and still do poorly, while another studies less and does well. Correlation is about the overall pattern.
The phrase "correlation does not imply causation" is one of the most famous warnings in statistics because so many believable-looking patterns turn out to have more than one possible explanation.
As we saw with the scatter plots in [Figure 1], noticing a trend is only the beginning. The next step is asking what could explain that trend and whether the data support a true cause-and-effect claim.
Causation is stronger than correlation. It means one variable directly affects another. If a medicine lowers fever, then taking the medicine causes the temperature to decrease. If regular training improves sprint time, the training may cause the improvement. In these cases, there is a mechanism: something happens that explains why one variable changes the other.
Cause-and-effect claims need strong evidence because they go beyond saying, "these two things happen together." They say, "this thing makes that happen." That is a much bigger statement. In statistics, big claims require careful proof.
Sometimes causation is reasonable because the context is well understood. For example, if the amount of water given to identical plants changes and the average growth also changes, it is sensible to suspect causation. Water is a factor that directly affects plant growth. But even then, scientists would still want to control other conditions such as sunlight, soil, and temperature.
Why causation is harder to prove
To show causation, you need more than a pattern. You need evidence that the cause comes first, that other important variables are controlled or balanced, and that the effect changes in a consistent way when the suspected cause changes. This is why experiments are more powerful than simple observations.
So, correlation asks whether variables move together. Causation asks whether one variable actually produces changes in the other.
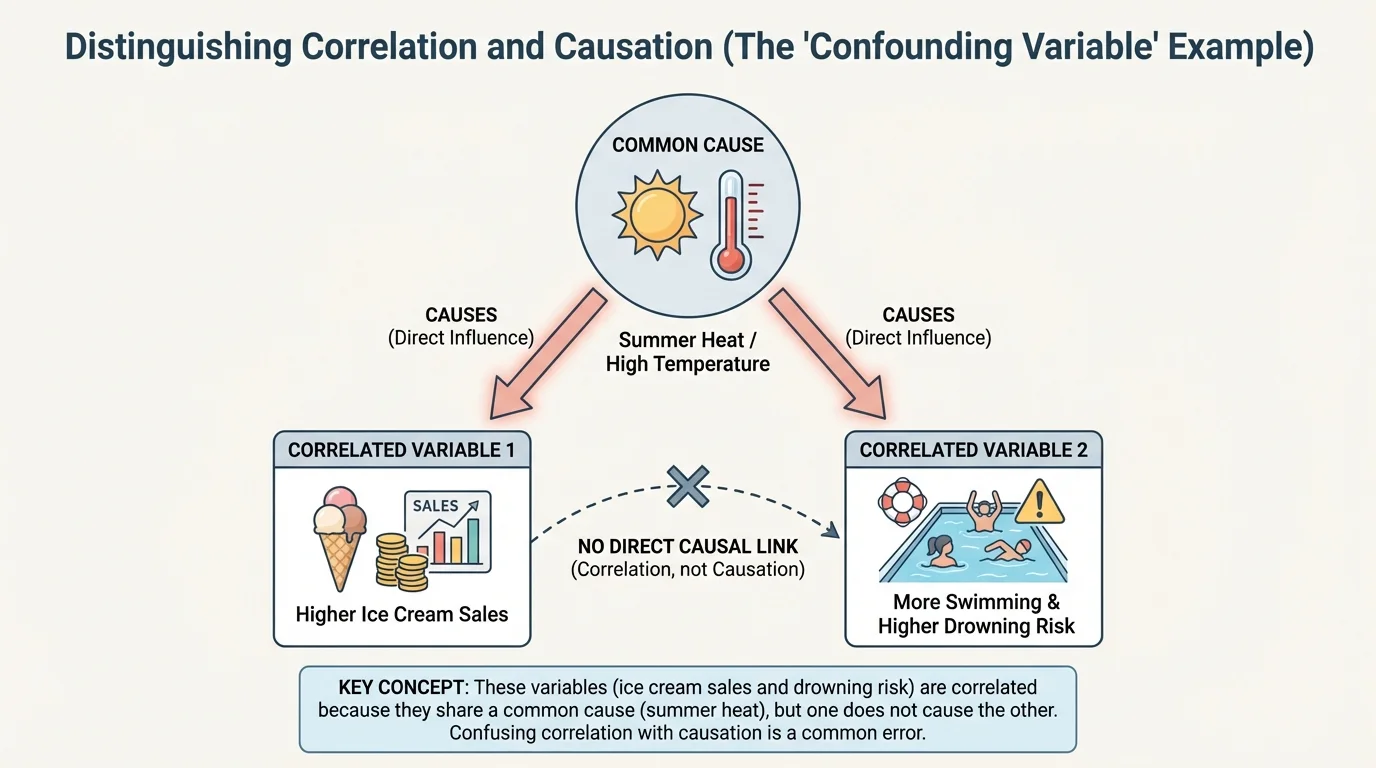
Many relationships in data can fool us. A pattern may look real and still fail to prove cause and effect. One reason is the presence of a lurking variable, which is a variable not included in the analysis that affects the variables being studied. The classic example is that ice cream sales and drowning incidents may both increase during summer. Buying ice cream does not cause drowning. Instead, hot weather increases both ice cream buying and swimming activity.
This kind of situation is sometimes explained by a confounding variable. When a third factor influences both variables, it becomes difficult to separate the effects. The observed correlation is real, but the explanation is not the simple one it first appears to be.
Another problem is reverse causation. Instead of variable A causing variable B, it may be that B causes A. For example, suppose data show that students with more stress tend to sleep less. Does stress cause less sleep, or does less sleep cause more stress? Both could be true. The direction of cause is not always obvious from the data.
A third possibility is coincidence. Sometimes two variables line up by chance, especially when many different comparisons are made. If someone searches enough data sets, they are likely to find strange patterns that mean little. A graph alone cannot tell you whether a pattern is meaningful or accidental.
Context matters. If a headline says, "Students who carry water bottles score higher on exams," you should immediately ask questions. Maybe organized students are more likely to bring water and also more likely to study. Maybe athletes carry water more often and also have different schedules or support systems. The water bottle itself may not be the reason for the higher scores.
| Situation | What the data show | Possible explanation |
|---|---|---|
| Ice cream sales and drowning incidents rise together | Positive correlation | Summer heat affects both |
| Hours practiced and free-throw accuracy rise together | Positive correlation | Practice may help, but skill level and coaching may also matter |
| Stress and sleep move in opposite directions | Negative correlation | Stress may affect sleep, sleep may affect stress, or both |
| Shoe size and reading level rise with age in children | Positive correlation | Age affects both; shoe size does not cause reading ability |
Table 1. Examples showing that a correlation can have different explanations.
The shoe-size example is especially useful. Younger children tend to have smaller shoes and lower reading levels, while older children tend to have larger shoes and higher reading levels. There is a clear correlation, but it would be absurd to claim that bigger shoes cause better reading. Age is the real explanation.
The causal pattern in [Figure 2] helps us see why third variables matter so much. When one outside factor pushes both variables, the graph may suggest a direct link that is not really there.
When you interpret data on two quantitative variables, begin by describing what the graph actually shows. Look for direction, form, and strength. Is the trend upward or downward? Is it roughly linear, meaning the points follow something close to a straight-line pattern? Are there outliers, or unusual points far from the rest? These questions keep your interpretation tied to evidence rather than guesses.
A trend line can help summarize the direction of a scatter plot. If the trend line slopes upward, the data suggest positive association. If it slopes downward, the data suggest negative association. But a trend line is a model, not proof. It summarizes a pattern; it does not explain the cause of the pattern.
Suppose one data set compares daily temperature and sales of cold drinks. If the scatter plot rises from left to right, we may say there is a positive association between temperature and sales. That is a careful statistical statement. Saying "hot weather causes people to buy more cold drinks" may be reasonable, but it adds a causal explanation. Whether that stronger statement is justified depends on the context and evidence.
Earlier data lessons often focus on describing what graphs show before explaining why patterns happen. That habit is crucial here: first describe the association accurately, then decide whether there is enough evidence for a causal claim.
Be cautious with categorical comparisons too. If one group has a higher percentage than another, that difference may suggest an association, but not automatic causation. For example, if students in one club have higher average grades than students not in the club, the club may help, but it is also possible that students who already have strong study habits are more likely to join.
The best way to understand the difference is to analyze specific situations and decide what kind of claim the evidence supports.
Worked Example 1: Study time and test scores
A teacher records hours studied and exam scores for a class. Students who studied more generally earned higher scores.
Step 1: Identify what the data show.
The variables are study time and exam score. The pattern suggests a positive correlation.
Step 2: Ask whether the data alone prove cause and effect.
No. The data show association, but other variables may matter, such as prior knowledge, quality of notes, sleep, or tutoring.
Step 3: Make the strongest justified conclusion.
It is valid to say that more study time is associated with higher scores in this class. It may be reasonable to suspect some causal effect, but the data alone do not prove causation.
Conclusion: Correlation is supported; causation is not fully proved.
This example is realistic because many school data sets are observational. We can notice patterns, but unless we carefully control conditions, we should avoid overclaiming.
Worked Example 2: Shoe size and reading score in children
A data set for children ages \(6\) to \(10\) shows that larger shoe sizes tend to go with higher reading scores.
Step 1: Describe the relationship.
The variables show a positive correlation.
Step 2: Look for a lurking variable.
Age is a likely lurking variable. As children get older, both shoe size and reading ability tend to increase.
Step 3: Decide on causation.
There is no sensible mechanism by which shoe size would improve reading skill. The correlation is explained by age, not by direct cause and effect.
Conclusion: Correlation exists, but there is no causation between shoe size and reading score.
This type of reasoning helps you move beyond "the graph goes up" to "what is the most likely explanation?" That is the heart of good statistical thinking.
Worked Example 3: A new review program
A school tests a new online review program. Students are randomly split into two groups of equal size. One group uses the program for \(4\) weeks, and the other does not. At the end, the program group has a higher average score.
Step 1: Identify the study type.
This is an experiment because the school assigns a treatment.
Step 2: Look for features that support causation.
Random assignment helps balance other variables between groups. The main systematic difference is whether students used the program.
Step 3: State the conclusion carefully.
If the experiment is well designed, the evidence supports the claim that using the review program caused the higher average score.
Conclusion: This is a case where a causal claim is much more justified.
[Figure 3] Notice how the design of the study changes what we can conclude. The more carefully a study controls other variables, the stronger the case for causation becomes.
To test whether one variable causes another, researchers often use an experiment. In an experiment, the researcher actively changes one factor and observes the result. A well-designed experiment usually includes random assignment, so participants are placed into groups by chance rather than choice.
One group may receive the treatment, such as a medicine, a training program, or a new teaching method. Another group, called a control group, does not receive the treatment or receives a standard condition for comparison. If the groups are similar except for the treatment, then differences in outcomes provide stronger evidence of causation.
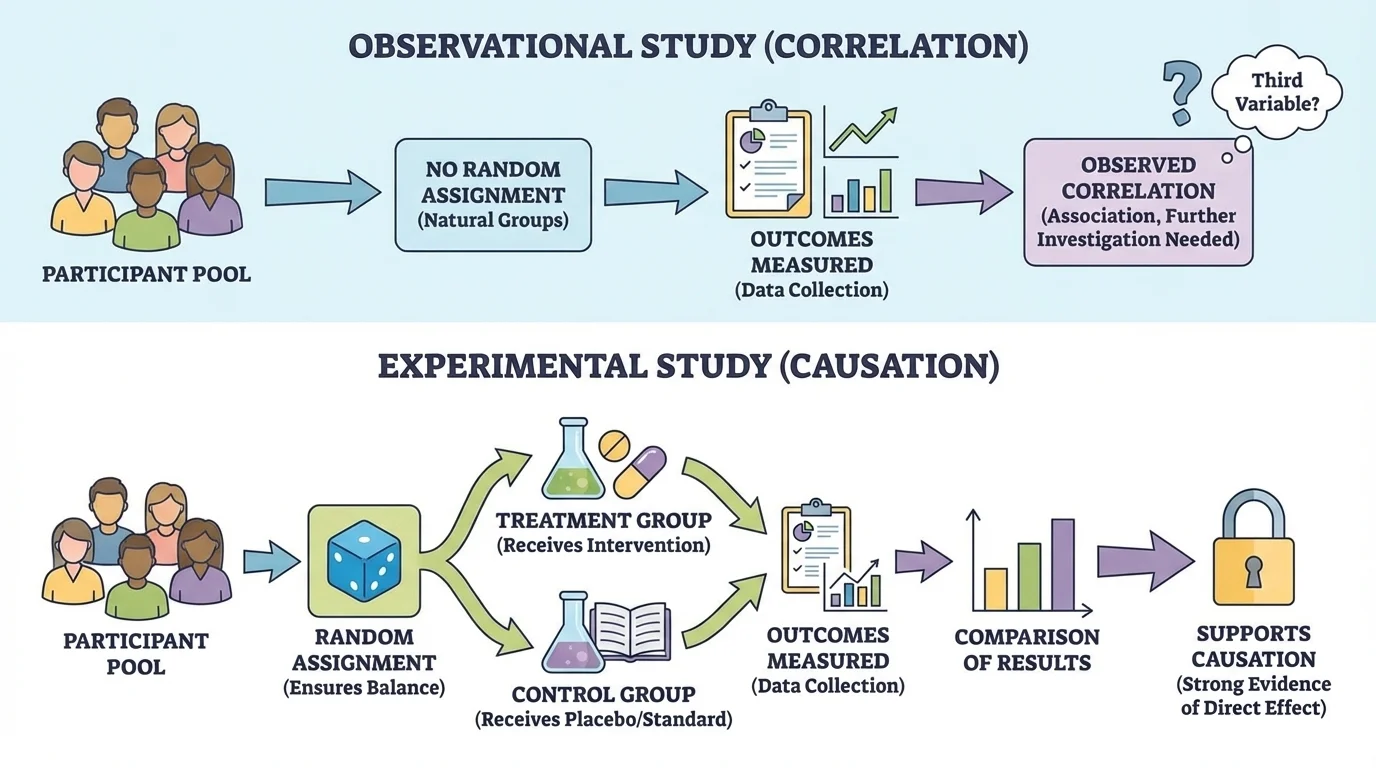
By contrast, an observational study simply records what is already happening without assigning treatments. Observational studies are often easier, cheaper, and more ethical in many situations, but they usually provide weaker evidence for causation because researchers cannot fully control other variables.
For example, it would be unethical to assign some people to smoke for years just to test the effect on lung health. Much evidence in health research comes from observational studies, supported by biological knowledge and repeated findings. In some cases, overwhelming evidence from many studies can strongly support causation even when a perfect experiment is impossible.
The group structure in [Figure 3] shows why random assignment is so valuable: it helps ensure that differences between groups are less likely to come from preexisting advantages or disadvantages.
Association versus explanation
Statistics often begins with finding association, but science goes further by testing explanations. A graph may suggest a relationship. Experiments, repeated evidence, and logical mechanisms help determine whether that relationship is causal.
Another important idea is sample size. A very small study can give unstable results. Larger samples often provide more reliable information, although large samples do not automatically fix a poorly designed study. Good design matters as much as, or more than, sheer amount of data.
In medicine, confusing correlation and causation can be dangerous. Suppose people who take vitamin supplements tend to live longer. That does not necessarily mean the vitamins caused longer life. People who take supplements may also exercise more, eat healthier food, and visit doctors more regularly. If researchers want a stronger answer, they need carefully designed studies.
In technology, companies analyze user behavior constantly. If users who turn on a certain app setting spend more time on the platform, the setting may be linked to engagement. But maybe the most dedicated users are simply more likely to activate that setting. Designers must test changes through controlled experiments before claiming that one feature caused users to stay longer.
In sports, data analysts compare training habits, sleep, nutrition, and performance. If teams that travel less win more games, travel distance might matter. But stronger teams may also earn more favorable schedules or have greater resources. Smart analysts separate description from explanation.
In economics, higher education level and income are often positively correlated. Education may contribute to higher earnings, but family background, location, social connections, and many other variables also matter. Economists use advanced methods to try to isolate causal effects because policy decisions can affect millions of people.
Some of the most famous misleading correlations come from unrelated data sets, such as trends in movie appearances and unrelated social statistics. These examples are funny, but they teach a serious lesson: a strong pattern alone is not enough.
In everyday life, this topic helps you read headlines more critically. Whenever you hear that one thing "leads to," "results in," or "causes" another, ask what kind of study was done and whether another explanation might fit the data.
One common mistake is using causal language when the evidence only shows association. Words like caused, made, and produced should be used carefully. If the evidence comes from a graph or observational data, safer phrases are is associated with, is related to, or shows a correlation with.
Another mistake is ignoring context. A graph is not self-explanatory. You need to ask what the variables mean, how the data were collected, and what other factors may matter. The exact same pattern can have very different explanations in different settings.
A third mistake is assuming that a stronger correlation always means stronger causation. A high correlation can still be caused by a third variable, while a real causal relationship may sometimes appear weaker because real data contain noise and variation.
Good statistical thinking combines careful observation with healthy skepticism. Correlation is valuable because it can reveal patterns worth studying. Causation is valuable because it helps us understand how and why changes happen. The skill is knowing which conclusion the evidence actually supports.
"The purpose of statistics is not just to find patterns, but to understand what those patterns do and do not prove."
When you examine two variables, start by describing the data honestly. Then ask whether the relationship might be explained by a lurking variable, reverse causation, or coincidence. Finally, look at the study design. If the evidence comes from a well-controlled experiment, a causal claim may be justified. If it comes only from observation, the safer conclusion is usually correlation.