Have you ever noticed that two crayons can look almost the same size, but one is just a little longer? Measuring helps us find out exactly how long objects are. When we measure many objects, or measure the same object again and again, we get data. Then we can organize that data so it is easy to read. One helpful way is a line plot.
Measuring is something people do all the time. We measure a book to see if it fits in a backpack. We measure a table to see if it fits against a wall. We measure plants to see how much they grow. When we measure several objects, we can compare them. When we measure one object more than once, we can see whether the measurements stay the same or change a little.
Data is information we collect. If you measure four pencils and get lengths of \(5\), \(6\), \(6\), and \(7\) units, those numbers are your data. A line plot helps us show those numbers in an organized way.
A ruler measures length. Length tells how long something is from one end to the other. A unit is the size we use when measuring, such as \(1\) inch or \(1\) centimeter.
When we work with length data, we usually use whole numbers in this lesson. That means we choose measurements like \(3\), \(4\), or \(8\) units instead of smaller parts between them.
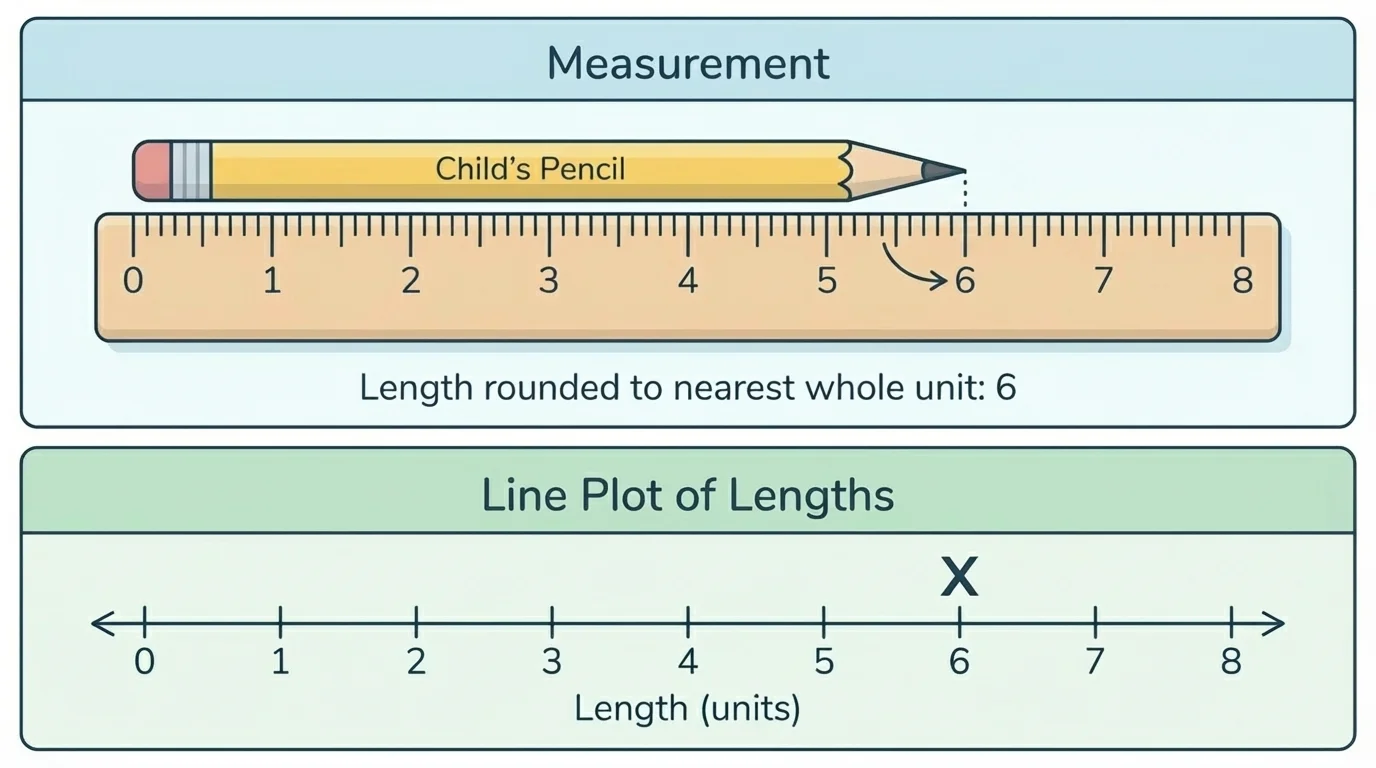
[Figure 1] shows how to line up an object with the \(0\) mark on a ruler before choosing the nearest whole-number unit.
To measure correctly, place one end of the object at the \(0\) mark on the ruler and look at where the other end stops. Then choose the nearest whole-number unit. If the object ends close to \(6\), we say it is about \(6\) units long.
Suppose a crayon ends between \(4\) and \(5\) inches, but it is closer to \(5\). Then the length to the nearest whole unit is \(5\) inches. If it ends closer to \(4\), then the measurement is \(4\) inches.
It is important to start at \(0\). Sometimes the edge of a ruler is before the \(0\) mark. If you start at the edge instead of \(0\), your measurement will not be correct.
You can measure in inches or centimeters. The idea is the same: line up one end at \(0\), look at the other end, and decide which whole number is closest.
Nearest whole unit means the closest full measuring unit. If a length is between two whole numbers, choose the one it is closer to.
Horizontal scale means the number line across the bottom of a graph or line plot. In this topic, it is marked with whole-number units.
Sometimes two students measure the same object and get slightly different answers. One might say \(8\) units and another might say \(9\) units. This can happen if the object is between two marks or if someone does not line it up perfectly. That is why careful measuring matters.
When we measure the same object more than once, we make repeated measurements. For example, a ribbon might be measured three times and the lengths might be \(8\), \(9\), and \(8\) units.
Repeated measurements are useful because they help us notice if measurements are close together. If most of the measurements are \(8\) units, then the object is probably about \(8\) units long. Small differences can happen because measuring is not always exact.
Even scientists repeat measurements. Measuring more than once helps people check their work and notice small differences.
If the same leaf is measured four times and the results are \(6\), \(6\), \(7\), and \(6\), we can tell that \(6\) units appears most often. That gives us a strong clue about the leaf's length.
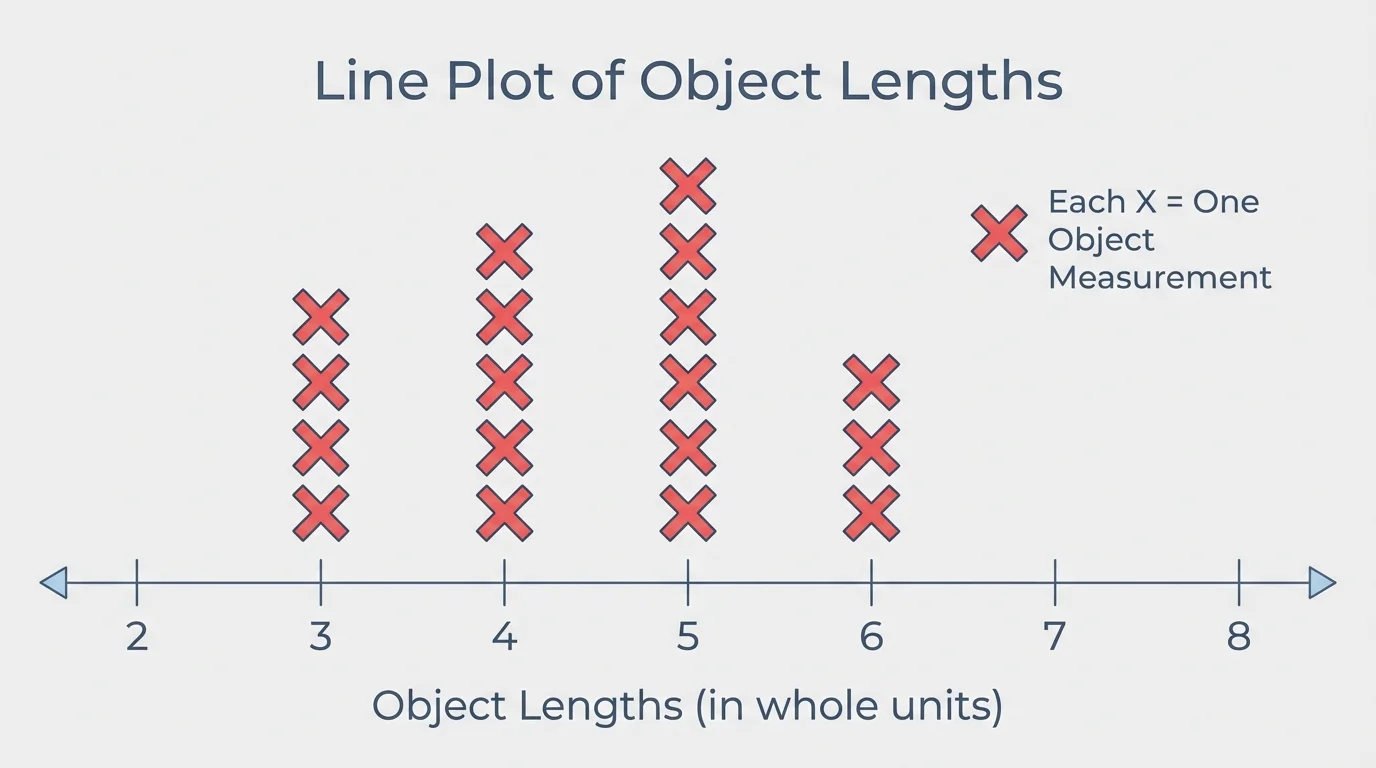
A line plot is a simple graph that shows data above a number line, as shown in [Figure 2]. Each number on the horizontal scale stands for a possible measurement. We place an \(X\) above a number each time that measurement appears.
If the data are \(3\), \(4\), \(4\), and \(6\), then we put one \(X\) above \(3\), two \(X\)s above \(4\), and one \(X\) above \(6\). No \(X\)s go above numbers that are not in the data.
The horizontal scale must be marked in whole-number units. That means the scale might say \(1, 2, 3, 4, 5, 6\), or \(5, 6, 7, 8, 9\), depending on the measurements.
Line plots are helpful because we can quickly see which measurement happens most, which measurements happen only once, and where the data are spread out. Later, when we look back at [Figure 2], we can easily compare how many objects have each length.
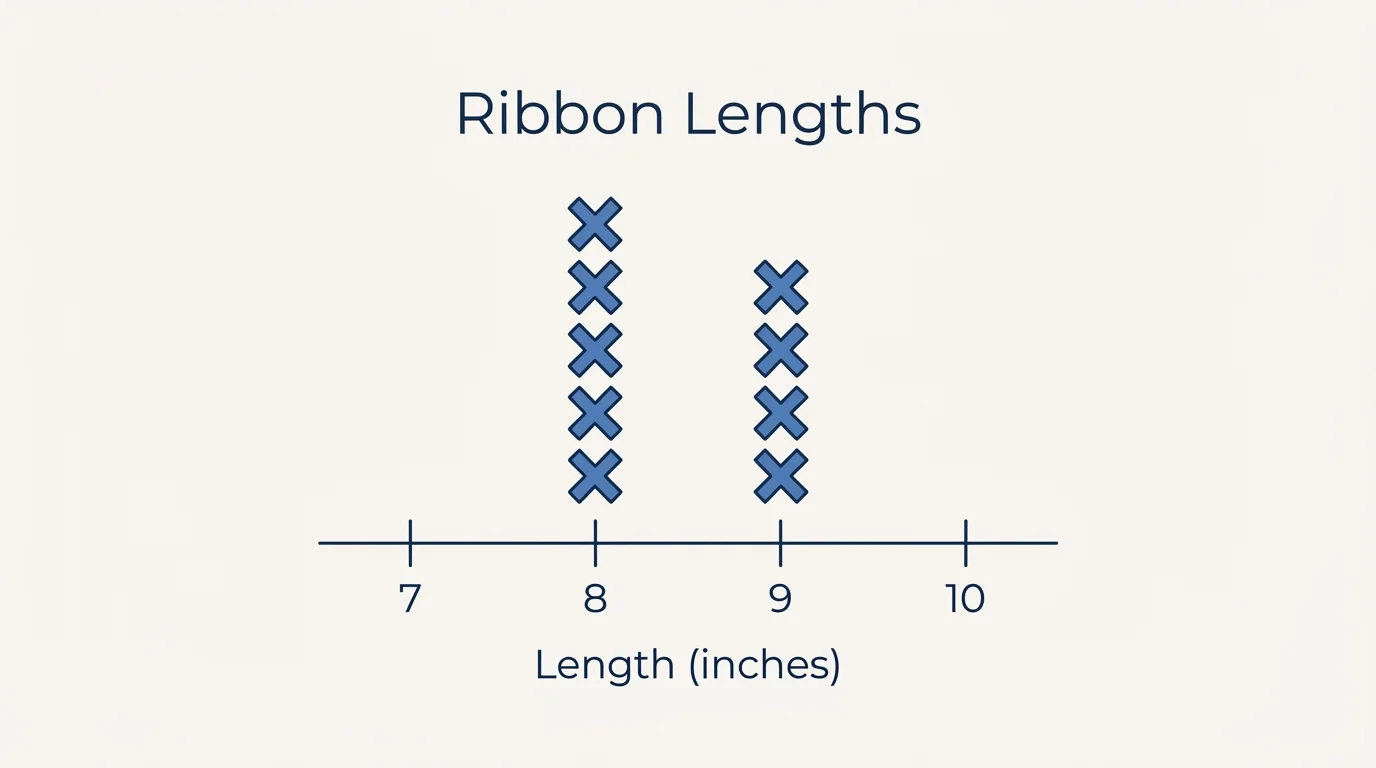
Now let's see how measurement data can be organized and read. [Figure 3] shows how repeated measurements can be displayed clearly on a line plot because each \(X\) stands for one measurement.
Worked Example 1
Measure several objects to the nearest whole unit. Suppose the lengths are a spoon \(4\) units, an eraser \(2\) units, a marker \(5\) units, and a brush \(4\) units. Show the data on a line plot.
Step 1: List the data.
The measurements are \(4, 2, 5, 4\).
Step 2: Make a horizontal scale.
Use whole numbers from \(2\) to \(5\): \(2, 3, 4, 5\).
Step 3: Place an \(X\) for each measurement.
Put one \(X\) above \(2\), none above \(3\), two \(X\)s above \(4\), and one \(X\) above \(5\).
The line plot shows that \(4\) units is the most common length.
This example uses measurements from different objects. A line plot can collect all of them in one place so we can compare lengths quickly.
Worked Example 2
A ribbon is measured four times. The measurements are \(8\), \(9\), \(8\), and \(8\) units. Show the data on a line plot.
Step 1: Write the repeated measurements.
The data are \(8, 9, 8, 8\).
Step 2: Draw a scale with whole numbers.
Use a scale that includes \(8\) and \(9\). You may also include nearby whole numbers such as \(7\) and \(10\) if you want a wider scale.
Step 3: Add \(X\) marks.
Put three \(X\)s above \(8\) and one \(X\) above \(9\).
The ribbon was measured as \(8\) units most often, so it is probably about \(8\) units long.
When you compare the counts, you can tell which measurement appears most. In this ribbon example, the stack above \(8\) is tallest, which helps us see the repeated measurement pattern clearly.
Repeated measurements are especially useful when one object is hard to measure exactly. The line plot keeps all of the tries organized.
Worked Example 3
A line plot shows plant heights of \(3\), \(3\), \(4\), \(5\), \(5\), and \(5\) units. Answer the questions.
Step 1: Find the shortest height.
The smallest number is \(3\), so the shortest plant height is \(3\) units.
Step 2: Find the tallest height.
The greatest number is \(5\), so the tallest plant height is \(5\) units.
Step 3: Find the most common height.
The height \(5\) appears three times, more than \(3\) or \(4\). So \(5\) units is the most common height.
Reading a line plot helps us answer questions about data.
Notice that we do not add the numbers together when we are just showing or reading the data. We focus on where the \(X\) marks are and how many are above each number.
People use measurement data in many places. A teacher might measure the lengths of students' pencils. A gardener might measure the heights of flowers each week. A builder might measure pieces of wood more than once to check accuracy.
In sports, a coach may record jump distances. In cooking, someone may compare the lengths of carrot sticks. In nature, children can measure leaves, shells, or twigs and place the data on a line plot.
Why line plots are useful
Line plots make small sets of measurement data easy to read. They help us compare lengths, notice which measurement appears most often, and see whether the data are close together or spread apart.
Because the scale uses whole numbers, line plots are especially good for data such as \(2\), \(3\), \(4\), and \(5\) units. They are neat, clear, and easy to count.
When you read a line plot, ask questions such as: What is the shortest measurement? What is the longest measurement? Which measurement happens most often? Are there any measurements with no \(X\) marks?
For example, if the data are \(2, 2, 3, 5, 5, 5, 6\), then the shortest length is \(2\), the longest length is \(6\), and the most common length is \(5\). There is no measurement of \(4\), so there would be no \(X\) above \(4\).
| Data set | Shortest | Longest | Most common |
|---|---|---|---|
| \(4, 2, 5, 4\) | \(2\) | \(5\) | \(4\) |
| \(8, 9, 8, 8\) | \(8\) | \(9\) | \(8\) |
| \(3, 3, 4, 5, 5, 5\) | \(3\) | \(5\) | \(5\) |
Table 1. Examples of measurement data sets with their shortest, longest, and most common values.
If two measurements have the same number of \(X\) marks, then both are equally common. If every measurement appears only once, then there is no single most common measurement.
"Measure carefully, then let the data tell the story."
As you become better at measuring, your data become more accurate. As you become better at reading line plots, you can understand the story the measurements are telling.