Have you ever noticed that two crayons can look almost the same length, but one is just a little longer? That tiny difference matters when we measure carefully. In math, we can collect those measurements, write them down as data, and then show them in a graph. One very useful graph for measurements is a line plot.
When we measure real objects, we are gathering information about the world. If a class measures pencils, leaves, toy cars, or strips of paper, the lengths can help us compare objects, sort them, and describe what we notice. This kind of information is called data.
Sometimes the lengths are exactly whole numbers, such as \(2\) inches or \(5\) inches. But many objects are not exactly a whole number of inches long. They may be \(2\dfrac{1}{2}\) inches long or \(3\dfrac{1}{4}\) inches long. That is why we need to understand rulers marked with halves and fourths of an inch.
You already know that an inch is a unit for measuring length. You also know fractions such as \(\dfrac{1}{2}\) and \(\dfrac{1}{4}\). In this lesson, those fraction ideas help you read a ruler and describe lengths more exactly.
Once we have measured several objects, we can place the data on a line plot. A line plot helps us see which lengths occur often, which lengths are rare, and how the measurements compare.
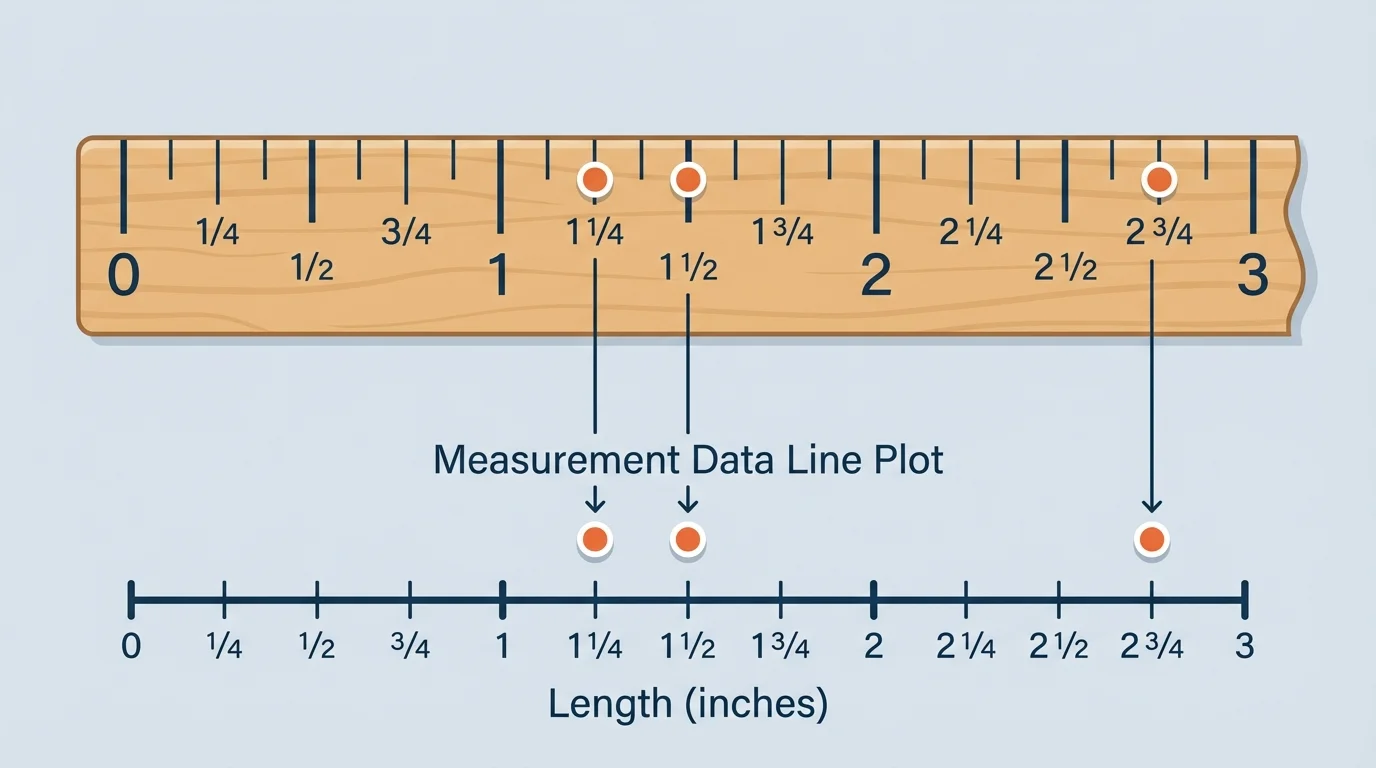
As [Figure 1] shows, a ruler is a tool for measuring length. On an inch ruler, the longest numbered marks show whole inches. Between each pair of whole inches, there can also be smaller marks. The mark halfway between two whole numbers stands for \(\dfrac{1}{2}\) inch, and the shorter marks can divide the inch into fourths: \(\dfrac{1}{4}\), \(\dfrac{2}{4}\), and \(\dfrac{3}{4}\).
Between \(1\) inch and \(2\) inches, the quarter-inch marks are \(1\dfrac{1}{4}\), \(1\dfrac{1}{2}\), and \(1\dfrac{3}{4}\). Notice that \(1\dfrac{2}{4}\) is the same as \(1\dfrac{1}{2}\). The ruler helps us find these lengths exactly.
If an object ends exactly at the first quarter mark after \(2\), its length is \(2\dfrac{1}{4}\) inches. If it ends at the middle mark between \(2\) and \(3\), its length is \(2\dfrac{1}{2}\) inches. If it ends at the third quarter mark after \(2\), its length is \(2\dfrac{3}{4}\) inches.
Whole inch means an exact numbered inch such as \(1\), \(2\), or \(3\). Half-inch means a point halfway between two whole inches, such as \(1\dfrac{1}{2}\). Quarter-inch means one of four equal parts of an inch, such as \(\dfrac{1}{4}\), \(\dfrac{2}{4}\), or \(\dfrac{3}{4}\).
When we measure to the nearest marked point on the ruler, we use the mark where the object ends. This means we are reading the closest whole, half, or fourth-inch mark.
To measure correctly, put one end of the object at the \(0\) mark on the ruler. Then look at where the other end stops. That ending point tells the length.
A common mistake is starting at the edge of the ruler instead of the \(0\) mark. If the ruler edge is a little before or after \(0\), the measurement will be wrong. Another mistake is reading the wrong small mark. Count the spaces carefully: the first quarter after a whole number is \(\dfrac{1}{4}\), the second is \(\dfrac{1}{2}\), and the third is \(\dfrac{3}{4}\).
Suppose a strip of paper starts at \(0\) and ends at the mark halfway between \(4\) and \(5\). Its length is \(4\dfrac{1}{2}\) inches. Suppose another strip ends at the first quarter mark after \(3\). Its length is \(3\dfrac{1}{4}\) inches.
Carpenters, tailors, and builders often need to measure parts of an inch very carefully. A small measuring error can make pieces not fit together correctly.
Careful measurement gives us better data. Better data leads to better graphs and better conclusions.
When we measure several objects and write down their lengths, we create measurement data. If a class measures \(8\) pencils, the set of \(8\) lengths is the data set.
For example, suppose these pencil lengths are measured in inches:
\(3\dfrac{1}{4}, 3\dfrac{1}{2}, 3\dfrac{1}{4}, 3\dfrac{3}{4}, 3\dfrac{1}{2}, 3\dfrac{1}{4}, 4, 3\dfrac{3}{4}\)
Each measurement tells about one pencil. Together, all of the measurements help us understand the whole group.
Before making a graph, it helps to put the lengths in order from least to greatest. This makes it easier to count how many times each length appears. A measurement that appears more than once should be counted each time.
For the pencil data, ordering the measurements gives:
\(3\dfrac{1}{4}, 3\dfrac{1}{4}, 3\dfrac{1}{4}, 3\dfrac{1}{2}, 3\dfrac{1}{2}, 3\dfrac{3}{4}, 3\dfrac{3}{4}, 4\)
Now we can see that \(3\dfrac{1}{4}\) appears \(3\) times, \(3\dfrac{1}{2}\) appears \(2\) times, \(3\dfrac{3}{4}\) appears \(2\) times, and \(4\) appears \(1\) time.
Equal-sized measurement steps are important when organizing data. If your measurements are in fourths of an inch, then the possible values increase by \(\dfrac{1}{4}\) each time: \(2, 2\dfrac{1}{4}, 2\dfrac{1}{2}, 2\dfrac{3}{4}, 3\), and so on. This same pattern is used on the line plot so each mark on the scale is spaced evenly.
Sometimes the data use only whole numbers and halves, such as \(2, 2\dfrac{1}{2}, 3, 3\dfrac{1}{2}\). Other times the data include fourths, so the scale must include quarter-inch marks too.
As [Figure 2] shows, a line plot is a graph that shows data along a number line. Each value on the line has an \(X\) placed above it for every time that value appears. The horizontal scale must be marked with the correct units so every measured length has a place.
If the data include quarter-inch measurements, the scale should count by \(\dfrac{1}{4}\). For example, a scale might be marked at \(2, 2\dfrac{1}{4}, 2\dfrac{1}{2}, 2\dfrac{3}{4}, 3, 3\dfrac{1}{4}, 3\dfrac{1}{2}, 3\dfrac{3}{4}, 4\). The spaces between marks must be equal.
To make the line plot, write the possible lengths along the horizontal line. Then place one \(X\) above each measurement in the data set. If a length appears \(3\) times, stack \(3\) Xs above that number.
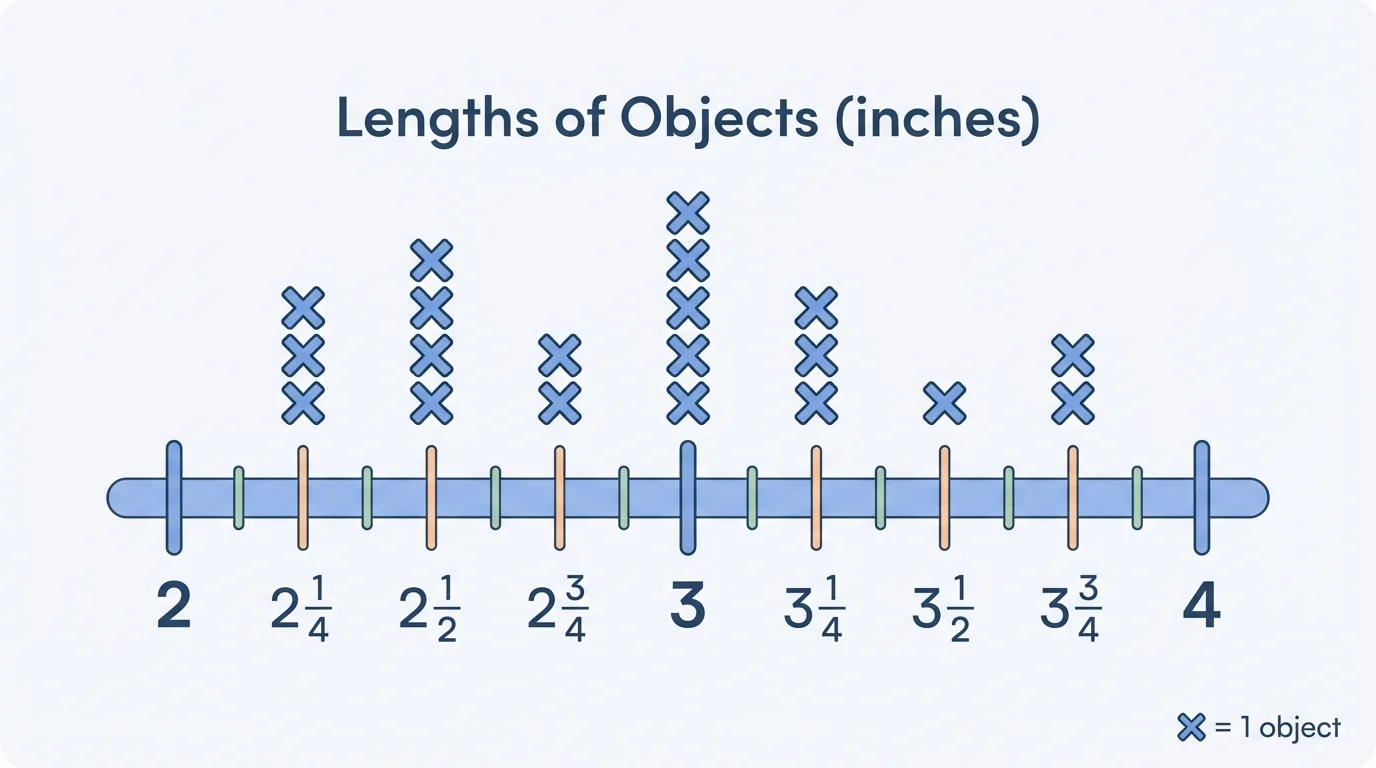
The line plot does not show the objects themselves. Instead, it shows how many objects have each length. That makes it easy to compare the measurements all at once.
If your data are only whole numbers and halves, you do not need quarter marks on the scale. The scale should match the data you have.
Once a line plot is made, we can learn a lot from it. The tallest stack of Xs shows the measurement that happens most often. This helps us notice patterns in the data.
For example, if \(3\dfrac{1}{4}\) has \(4\) Xs and \(3\dfrac{1}{2}\) has \(2\) Xs, then more objects measure \(3\dfrac{1}{4}\) inches than \(3\dfrac{1}{2}\) inches. We can also count all the Xs to find how many objects were measured in all.
A line plot can help answer questions such as these: Which length is most common? How many objects are longer than \(3\dfrac{1}{2}\) inches? How many objects are exactly \(2\dfrac{3}{4}\) inches long? Are there more short objects or long objects?
Later, when you compare two lengths or count groups of measurements, the structure from [Figure 2] still matters. The equal spaces on the horizontal scale make the graph accurate and easy to read.
These examples show how to measure lengths and display the data clearly.
Example 1: Reading a ruler
A ribbon starts at \(0\) and ends at the third quarter mark after \(2\).
Step 1: Find the whole number part.
The ribbon has passed \(2\) whole inches.
Step 2: Count the quarter marks after \(2\).
The first quarter mark is \(2\dfrac{1}{4}\), the second is \(2\dfrac{1}{2}\), and the third is \(2\dfrac{3}{4}\).
Step 3: Write the measurement.
The ribbon measures \(2\dfrac{3}{4}\) inches.
Answer: \(2\dfrac{3}{4}\) inches.
That same idea works for any ruler marked in fourths. Count carefully from the whole number to the endpoint.
Example 2: Organizing measurement data
Suppose the lengths of \(6\) crayons are \(4\dfrac{1}{4}, 4, 4\dfrac{1}{2}, 4\dfrac{1}{4}, 4\dfrac{3}{4}, 4\dfrac{1}{2}\).
Step 1: Put the data in order from least to greatest.
\(4, 4\dfrac{1}{4}, 4\dfrac{1}{4}, 4\dfrac{1}{2}, 4\dfrac{1}{2}, 4\dfrac{3}{4}\)
Step 2: Count how many times each measurement appears.
\(4\) appears \(1\) time, \(4\dfrac{1}{4}\) appears \(2\) times, \(4\dfrac{1}{2}\) appears \(2\) times, and \(4\dfrac{3}{4}\) appears \(1\) time.
Step 3: Decide the scale for the line plot.
Because the data use fourths, the scale should include \(4, 4\dfrac{1}{4}, 4\dfrac{1}{2}, 4\dfrac{3}{4}\).
Answer: The data are organized and ready to graph.
Ordering the data before graphing makes the line plot much faster to build and much easier to check.
Example 3: Making and reading a line plot
Measure \(7\) paper clips and get these lengths: \(2, 2\dfrac{1}{4}, 2\dfrac{1}{4}, 2\dfrac{1}{2}, 2\dfrac{1}{2}, 2\dfrac{1}{2}, 2\dfrac{3}{4}\).
Step 1: Draw the horizontal scale.
Mark the scale at \(2, 2\dfrac{1}{4}, 2\dfrac{1}{2}, 2\dfrac{3}{4}\).
Step 2: Place one \(X\) for each measurement.
Put \(1\) X above \(2\), \(2\) Xs above \(2\dfrac{1}{4}\), \(3\) Xs above \(2\dfrac{1}{2}\), and \(1\) X above \(2\dfrac{3}{4}\).
Step 3: Answer questions from the plot.
The most common length is \(2\dfrac{1}{2}\) inches because it has \(3\) Xs. The total number of paper clips is \(1 + 2 + 3 + 1 = 7\).
Answer: The most common measurement is \(2\dfrac{1}{2}\) inches, and there are \(7\) paper clips altogether.
We can also compare groups. In Example 3, the lengths greater than \(2\dfrac{1}{4}\) are \(2\dfrac{1}{2}, 2\dfrac{1}{2}, 2\dfrac{1}{2}, 2\dfrac{3}{4}\). That is \(4\) paper clips.
Measurement data appears in many real situations. A class might measure plant stems each week and graph the lengths to see growth over time. A group of students might measure the lengths of bookmarks they made in art class. A science class could measure shells, feathers, or leaves and compare the results.
Sports equipment can be measured too. If several jump ropes are cut for a game, a line plot can show which lengths are most common. In building and crafts, people often compare measured pieces before putting them together.
When people collect data and graph it clearly, they can make smart decisions. They can tell whether most objects are about the same size or whether the measurements are spread out across many lengths.
One mistake is forgetting to start at \(0\) on the ruler. Another is mixing up \(\dfrac{1}{4}\), \(\dfrac{1}{2}\), and \(\dfrac{3}{4}\). Remember that \(\dfrac{1}{2}\) is the middle point between two whole numbers.
Another mistake happens when the line plot scale does not match the measurements. If your data include \(\dfrac{1}{4}\)-inch lengths, the scale must include quarter-inch marks. If the spaces are not equal, the graph will be confusing.
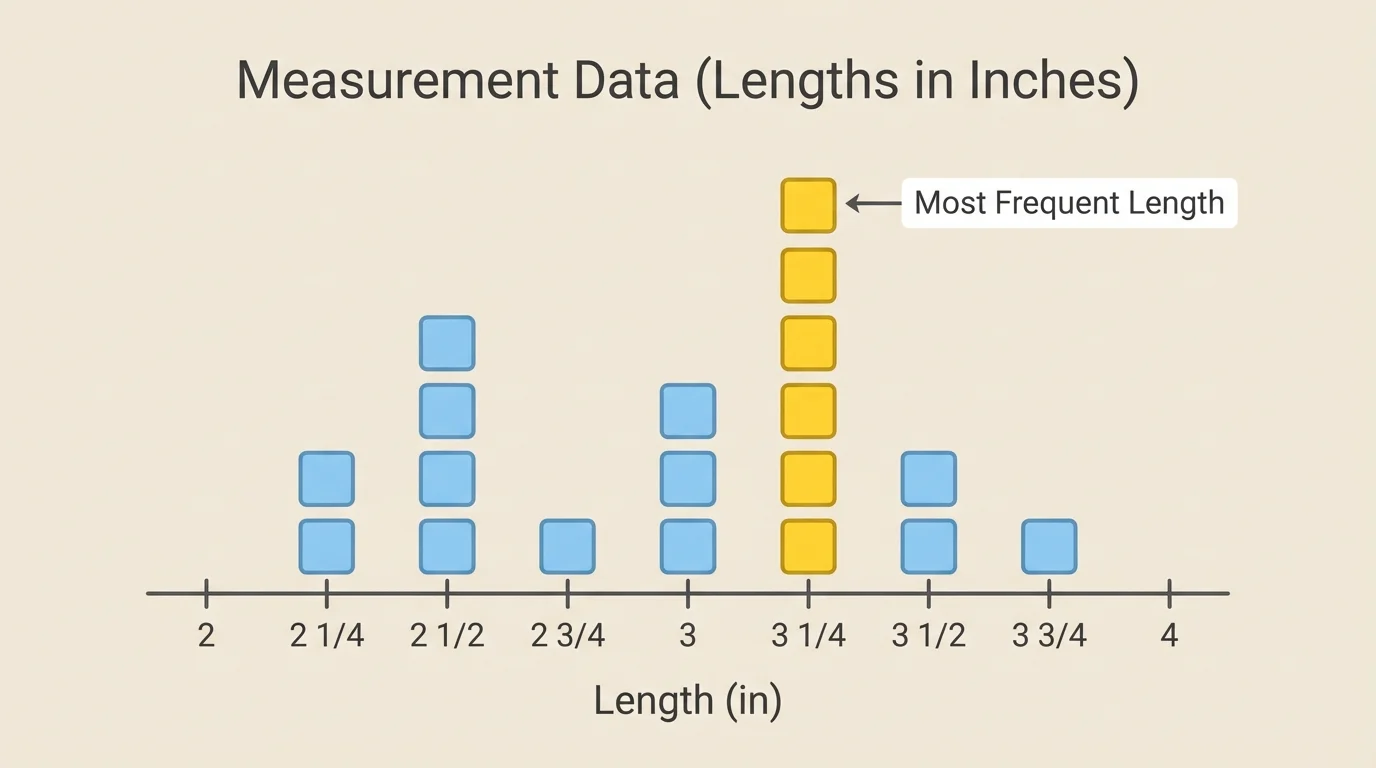
It also matters to place one X for every single measurement. If \(3\dfrac{1}{4}\) appears \(4\) times, the plot must show \(4\) Xs above \(3\dfrac{1}{4}\). As seen earlier in [Figure 3], the height of each stack shows the count, so every X matters.
When you talk about a line plot, use clear math language. You can say a length appears more often, less often, or the same number of times. You can describe the shortest measurement, the longest measurement, and the total number of measurements.
For example, if a graph shows \(2\) Xs above \(3\) inches and \(5\) Xs above \(3\dfrac{1}{4}\) inches, then \(3\dfrac{1}{4}\) inches appears more often. The difference is \(5 - 2 = 3\), so there are \(3\) more objects measuring \(3\dfrac{1}{4}\) inches than \(3\) inches.
"Good measurement leads to good graphing."
— A useful math rule
Careful measuring, careful counting, and careful graphing all work together. First measure the objects. Next record the data. Then choose the correct scale and place the Xs in the right spots.