If two sports drinks taste exactly the same, even when one bottle is much larger than the other, something important is happening: the ingredients stay in the same ratio. Ratios help us describe fair mixes, equal scaling, and matching comparisons. They are used in recipes, maps, shopping, and even game scores. When we organize ratios in tables and graphs, we can see patterns that are hard to notice otherwise.
A ratio compares two quantities. For example, if a class has \(12\) girls and \(8\) boys, the ratio of girls to boys is \(12:8\). It can also be written as \(\dfrac{12}{8}\). A ratio tells how much there is of one quantity compared with another.
Ratios must keep the quantities in the same order. The ratio of girls to boys, \(12:8\), is not the same as the ratio of boys to girls, \(8:12\). The order matters because the comparison changes.
Equivalent ratios are ratios that name the same comparison, even though the numbers are different. You can make equivalent ratios by multiplying or dividing both parts of a ratio by the same nonzero whole number.
Ratio table is a table that lists pairs of equivalent values that represent the same ratio.
Coordinate plane is a graphing grid formed by a horizontal axis and a vertical axis, used to plot ordered pairs such as \((x,y)\).
For example, \(2:3\), \(4:6\), and \(10:15\) are all equivalent ratios because each one shows the same relationship. In each case, for every \(2\) of one quantity, there are \(3\) of the other.
One helpful way to think about equivalent ratios is scaling. If every amount doubles, the relationship stays the same. If every amount triples, the relationship also stays the same. But if only one quantity changes, the ratio is no longer equivalent.
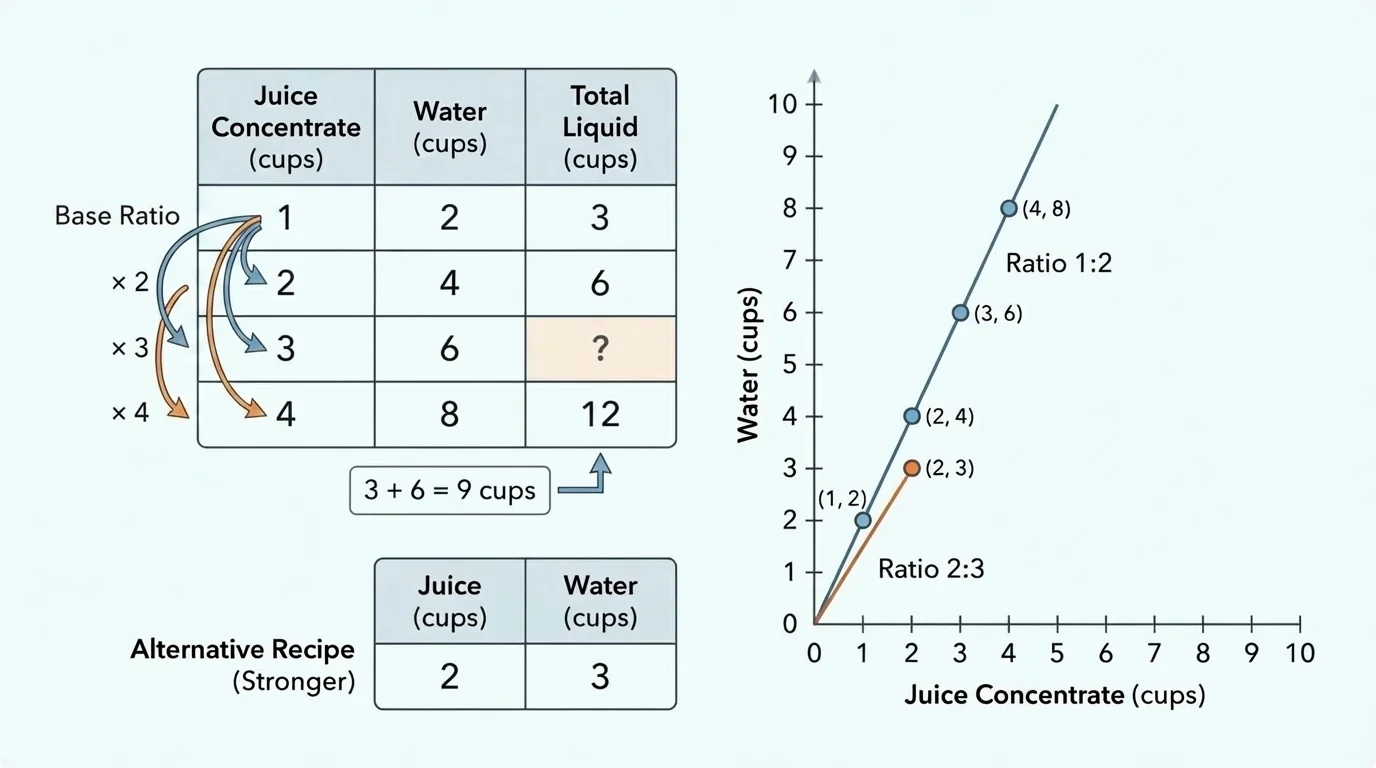
A ratio table helps organize equivalent ratios. It shows pairs of numbers that all represent the same relationship, as [Figure 1] illustrates with a mixture that keeps the same taste. To make a ratio table, start with one ratio and multiply both parts by the same whole number.
Suppose a fruit punch recipe uses \(2\) cups of juice concentrate for every \(5\) cups of water. The starting ratio is \(2:5\). We can build a table of equivalent ratios.
| Juice concentrate | Water |
|---|---|
| \(2\) | \(5\) |
| \(4\) | \(10\) |
| \(6\) | \(15\) |
| \(8\) | \(20\) |
Table 1. A ratio table showing equivalent ratios for juice concentrate and water.
Each row is made by multiplying both numbers in \(2:5\) by the same factor: \(2\), \(3\), and \(4\). For example, \(2 \times 3 = 6\) and \(5 \times 3 = 15\). Since both parts are multiplied by \(3\), \(6:15\) is equivalent to \(2:5\).
You can also work backward by dividing. If you know the ratio \(8:20\), dividing both numbers by \(4\) gives \(2:5\). Multiplying and dividing are both useful because ratio tables can grow or shrink.
Worked example 1
A trail mix recipe uses \(3\) cups of nuts for every \(2\) cups of raisins. Make a table of equivalent ratios.
Step 1: Write the starting ratio.
The ratio is \(3:2\).
Step 2: Multiply both parts by the same whole numbers.
Multiply by \(2\): \(3 \times 2 = 6\), \(2 \times 2 = 4\).
Multiply by \(3\): \(3 \times 3 = 9\), \(2 \times 3 = 6\).
Multiply by \(4\): \(3 \times 4 = 12\), \(2 \times 4 = 8\).
Step 3: Record the pairs in a table.
The table includes \((3,2)\), \((6,4)\), \((9,6)\), and \((12,8)\).
These are all equivalent ratios because the same multiplication rule is used for both quantities each time.
Ratio tables are especially useful because they show patterns clearly. In Table 1, the juice amounts increase by \(2\) while the water amounts increase by \(5\). That repeated pattern matches the original ratio.
Sometimes a ratio table has blanks. To fill them in, think about how the known values are connected. You might multiply, divide, or use a value for one unit.
A unit rate is a rate for one unit of something. In ratio problems, finding the amount for \(1\) can make missing values easier to solve. For example, if \(4\) notebooks cost \(\$12\), then one notebook costs \(12 \div 4 = 3\), so the unit rate is \(\$3\) per notebook.
When you work with multiplication tables, you already use scaling: \(5, 10, 15, 20\) are all multiples of \(5\). Ratio tables use the same idea, but both quantities must scale together.
Suppose \(3\) tickets cost \(\$24\). How much do \(5\) tickets cost? First find the cost of one ticket: \(24 \div 3 = 8\). Then multiply by \(5\): \(8 \times 5 = 40\). So \(5\) tickets cost \(\$40\).
Worked example 2
Complete the table if \(4\) muffins use \(6\) cups of flour.
| Muffins | Flour (cups) |
|---|---|
| \(4\) | \(6\) |
| \(8\) | ? |
| \(?\) | \(15\) |
Table 2. A ratio table with missing values for muffins and flour.
Step 1: Find the multiplier from \(4\) muffins to \(8\) muffins.
\(8 \div 4 = 2\), so multiply by \(2\).
Step 2: Apply the same multiplier to flour.
\(6 \times 2 = 12\).
So \(8\) muffins use \(12\) cups of flour.
Step 3: Find the number of muffins for \(15\) cups of flour.
Since \(6\) cups become \(15\) cups, the multiplier is \(15 \div 6 = 2.5\).
Apply the same multiplier to muffins: \(4 \times 2.5 = 10\).
The missing values are \(12\) cups and \(10\) muffins.
Notice that the quantities in the original situation are whole numbers, but a multiplier can still help you find a missing value. Another strategy is to first find the amount for \(1\) muffin: \(6 \div 4 = 1.5\) cups per muffin, and then multiply by the number of muffins you want.
When a table is based on equivalent ratios, every pair must match the same relationship. If one row does not follow the pattern, then it does not belong in the table.
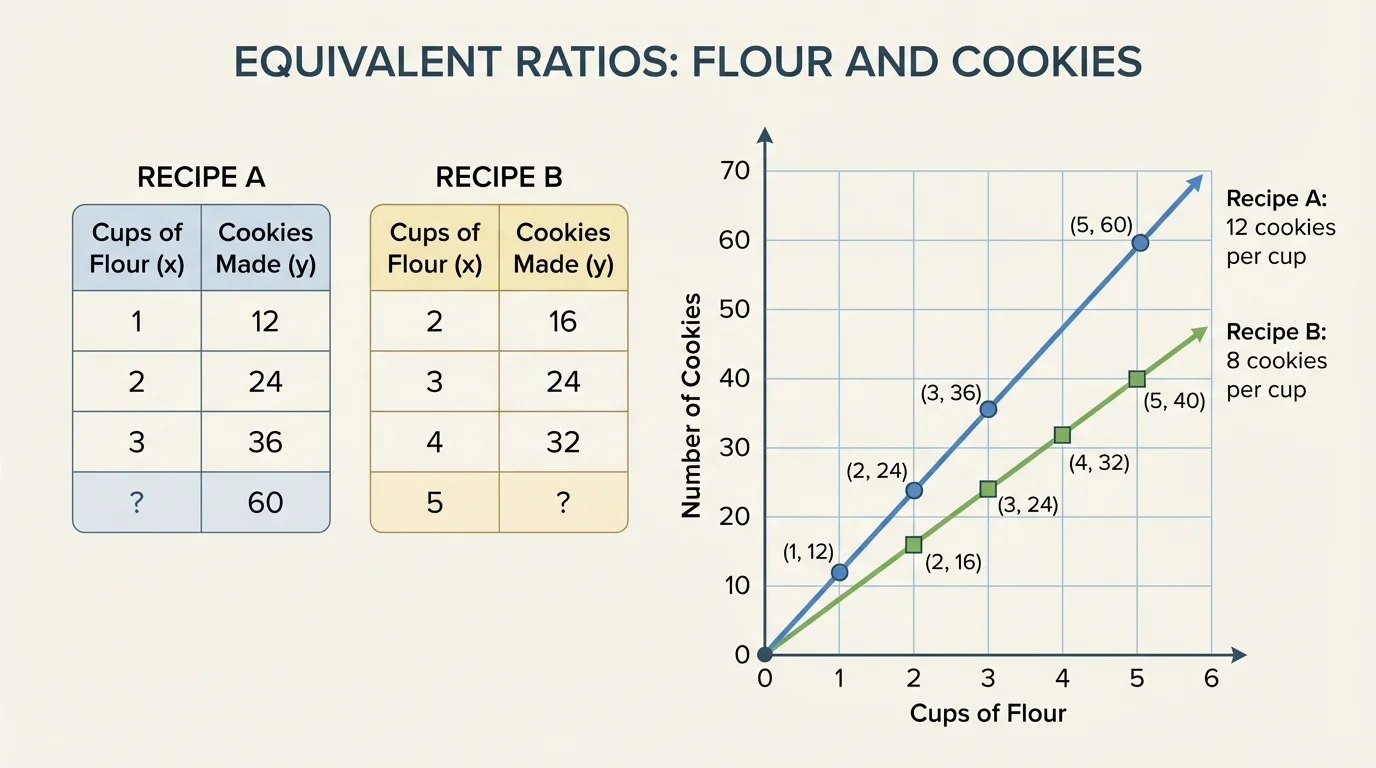
Ratio tables and graphs are closely connected. Each row in a table can be written as an ordered pair and plotted on the coordinate plane. For equivalent ratios, the points form a straight pattern through the origin, as [Figure 2] shows. The origin is the point \((0,0)\), which means zero of one quantity and zero of the other.
Suppose \(2\) sandwiches need \(6\) slices of bread. The ratio table might include \((2,6)\), \((4,12)\), \((6,18)\), and \((8,24)\). If the horizontal axis shows sandwiches and the vertical axis shows slices of bread, each row becomes a point on the graph.
These points lie on a straight line because the ratio stays constant. As the number of sandwiches doubles, the number of bread slices also doubles. The graph makes this pattern easy to see.
Why the graph goes through the origin
If there are \(0\) groups, there are \(0\) items. For example, \(0\) sandwiches need \(0\) slices of bread. That is why graphs of equivalent ratio tables include the point \((0,0)\) when the quantities can both be zero.
Be careful about the order of coordinates. The point \((2,6)\) means \(2\) sandwiches and \(6\) slices of bread. If you switch the order and plot \((6,2)\), the point represents a completely different situation.
Worked example 3
A bike travels \(4\) miles in \(1\) hour at a constant speed. Make a ratio table and list points to plot.
Step 1: Start with the given ratio.
The ratio of hours to miles is \(1:4\).
Step 2: Build equivalent ratios.
Multiply both parts by \(2\), \(3\), and \(4\).
The table gives \((1,4)\), \((2,8)\), \((3,12)\), and \((4,16)\).
Step 3: Include the origin.
At \(0\) hours, the bike has gone \(0\) miles, so include \((0,0)\).
Step 4: Describe the graph.
The points \((0,0)\), \((1,4)\), \((2,8)\), \((3,12)\), and \((4,16)\) lie on a straight line.
The graph shows a constant speed of \(4\) miles per hour.
Later, when you compare different situations, the graph can help you decide which ratio is greater. A steeper line means more of the vertical quantity for each unit of the horizontal quantity.
The same idea appears in many settings: recipes, travel, and cost. Equivalent pairs create a predictable straight-line pattern because the relationship stays constant.
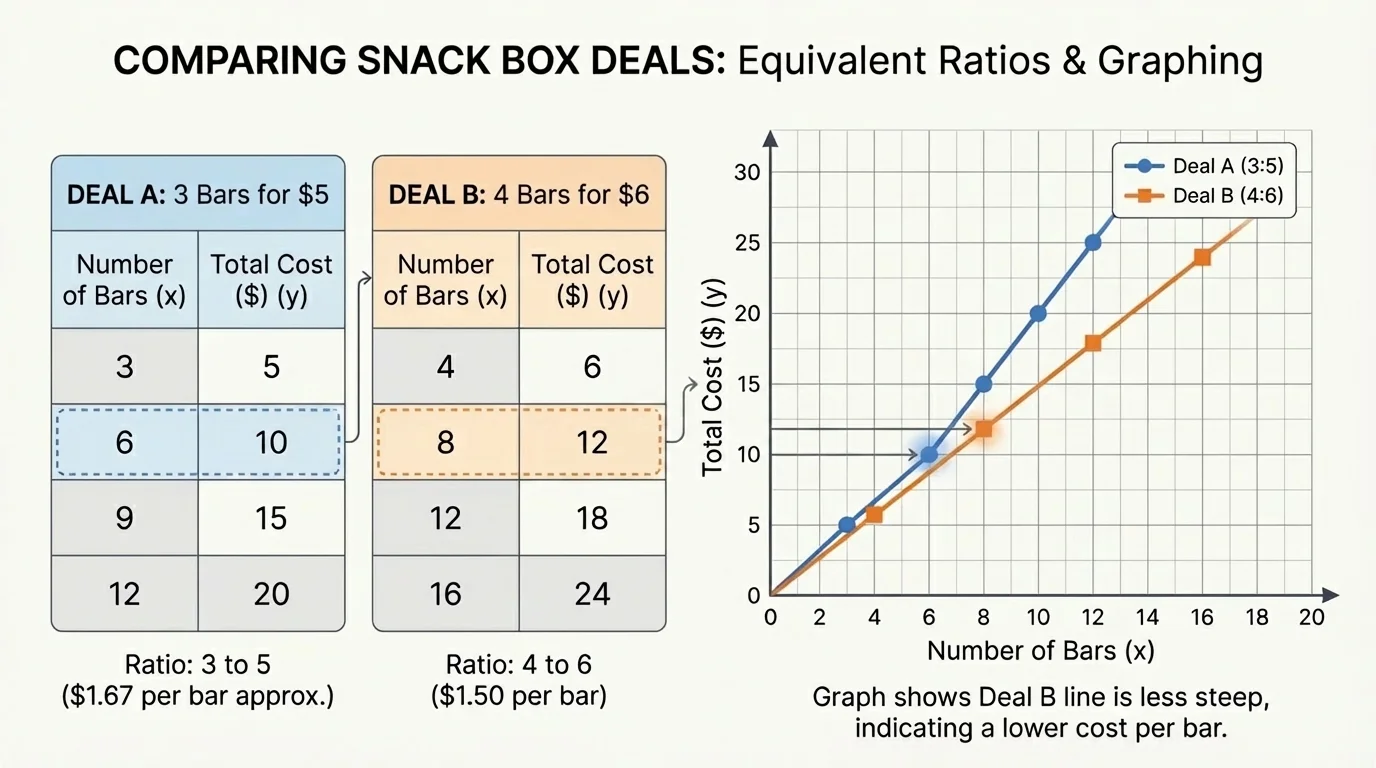
Tables are also powerful tools for deciding which of two ratios is greater. When two situations are organized side by side, as shown in [Figure 3], you can compare equal amounts or compare the amount for one unit. This helps answer questions like which store has the better price or which team scores faster.
Suppose Store A sells \(3\) pens for \(\$6\), and Store B sells \(5\) pens for \(\$9\). Which is the better buy?
One method is to find the cost for one pen at each store. For Store A, \(6 \div 3 = 2\), so the unit rate is \(\$2\) per pen. For Store B, \(9 \div 5 = 1.8\), so the unit rate is \(\$1.80\) per pen. Since \(\$1.80\) is less than \(\$2\), Store B is the better buy.
Another method is to make tables until the number of pens matches. Store A can make \(15\) pens for \(\$30\) because \(3 \times 5 = 15\) and \(6 \times 5 = 30\). Store B already reaches \(15\) pens by multiplying by \(3\): \(5 \times 3 = 15\) and \(9 \times 3 = 27\). Since \(\$27\) is less than \(\$30\) for the same number of pens, Store B is still the better buy.
| Store | Pens | Cost | Unit rate |
|---|---|---|---|
| A | \(3\) | $6 | $2 per pen |
| B | \(5\) | $9 | $1.80 per pen |
Table 3. A comparison of two pen prices using ratios and unit rates.
When comparing ratios, make sure the units match. Comparing miles per hour to pages per minute would not make sense because the situations measure different things.
Professional sports analysts use ratio thinking all the time. Stats such as points per game, shots made per attempt, and goals allowed per match are all comparisons that help people judge performance fairly.
Tables let you compare by building equal-sized groups. This is often easier than guessing from the original numbers.
Ratio reasoning appears everywhere. In cooking, if \(2\) cups of rice serve \(3\) people, then \(4\) cups serve \(6\) people and \(6\) cups serve \(9\) people, assuming the recipe scales evenly. In map reading, if \(1\) inch represents \(20\) miles, then \(3\) inches represent \(60\) miles.
In shopping, price comparisons use ratios. In science labs, mixtures often depend on keeping the same ratio of ingredients. In music, a pattern may repeat in equal groups. In art, enlarging a drawing without changing its shape also depends on scaling both dimensions by the same factor.
Worked example 4
A map uses the ratio \(1\) inch to \(25\) miles. How far apart are two towns that are \(7\) inches apart on the map?
Step 1: Write the ratio.
\(1\) inch corresponds to \(25\) miles.
Step 2: Scale to \(7\) inches.
Multiply both parts by \(7\).
\(1 \times 7 = 7\) and \(25 \times 7 = 175\).
Step 3: State the answer.
Two towns \(7\) inches apart on the map are \(175\) miles apart in real life.
This works because the map scale is a constant ratio.
Many real-world questions can be solved by organizing the information into a table first. Once the table is built, patterns become easier to notice and missing values are easier to calculate.
One common mistake is adding the same number to both parts of a ratio and expecting an equivalent ratio. For example, starting with \(2:3\), adding \(1\) to both parts gives \(3:4\), but \(2:3\) and \(3:4\) are not equivalent. Equivalent ratios must be made by multiplying or dividing both parts by the same number.
Another mistake is reversing the order of the quantities. If the ratio is cups of juice to cups of water, keep that order in the table and on the graph. Reversing the order changes the meaning.
A third mistake is plotting points incorrectly. If a table row is \((4,10)\), the first number belongs on the horizontal axis and the second on the vertical axis. Mixing them up changes the graph.
Finally, do not compare ratios by looking only at the larger numbers. A ratio with larger numbers is not automatically greater. For example, \(8:12\) and \(4:6\) are equivalent even though one uses bigger numbers.
"A ratio table is not just a list of numbers. It is a pattern that stays true every time you scale both quantities together."
When you use tables, missing values, and graphs together, you have several ways to understand the same relationship. That makes ratio reasoning a very powerful tool in mathematics and everyday life.