Two students can be the same age, but a whole school almost never is. That simple idea is the heart of statistics: when we ask about a group, we expect differences in the answers. Some students are older, some are younger, some are exactly the same age. Statistics begins when a question is designed to notice those differences instead of ignoring them.
People use statistical questions all the time, even when they do not call them that. A coach may wonder how many free throws players usually make. A principal may ask how long students spend on homework each night. A scientist may ask how much rain falls in a city during different months. These questions are not answered by just one number from one person. They need data from many cases, and the answers must deal with differences in those data.
A question can have just one exact answer, or it can have many possible answers. If you ask, "What is my birthday?" there is one correct answer. If you ask, "What are the birthdays of students in my class?" there will be many answers. That second question makes us expect variety.
Questions with one fixed answer are not statistical questions. Questions about a group, a set of objects, or repeated measurements often are statistical questions because the answers are not all identical. If ten students measure their hand spans, the results might be close, but they will probably not all match exactly.
A statistical question is a question that expects variability in the data and is answered by collecting data that show that variability.
Variability means that the data values are not all the same; they differ from one person, object, or measurement to another.
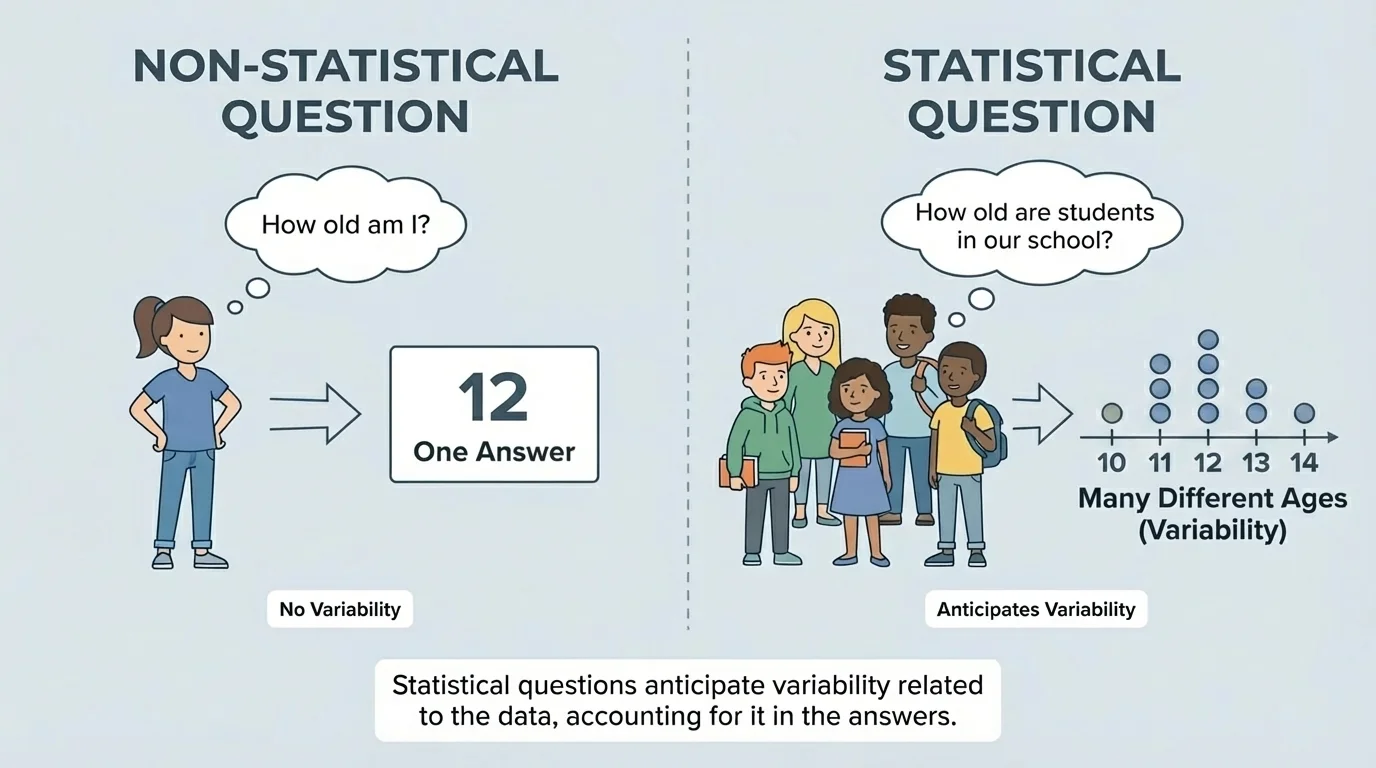
When you hear a question, a good first test is this: Do I expect the answers to vary? If the answer is yes, then the question may be statistical. If the answer is no, then it is probably not statistical, as shown in [Figure 1].
A statistical question does more than ask about a topic. It asks in a way that expects different results and allows us to answer by looking at a set of values. For example, "How old am I?" has one answer. "How old are the students in my school?" expects many ages, so it is statistical.
There are two main parts to recognize. First, the question anticipates variability. Second, the answer accounts for that variability. That means the answer might describe the data with words like most, some, about, between, or the average, instead of giving just one exact value.
For example, suppose someone asks, "How many books did sixth-grade students read last month?" We expect different students to read different numbers of books. One student may read \(0\), another may read \(3\), and another may read \(8\). Because the answers vary, this is statistical.
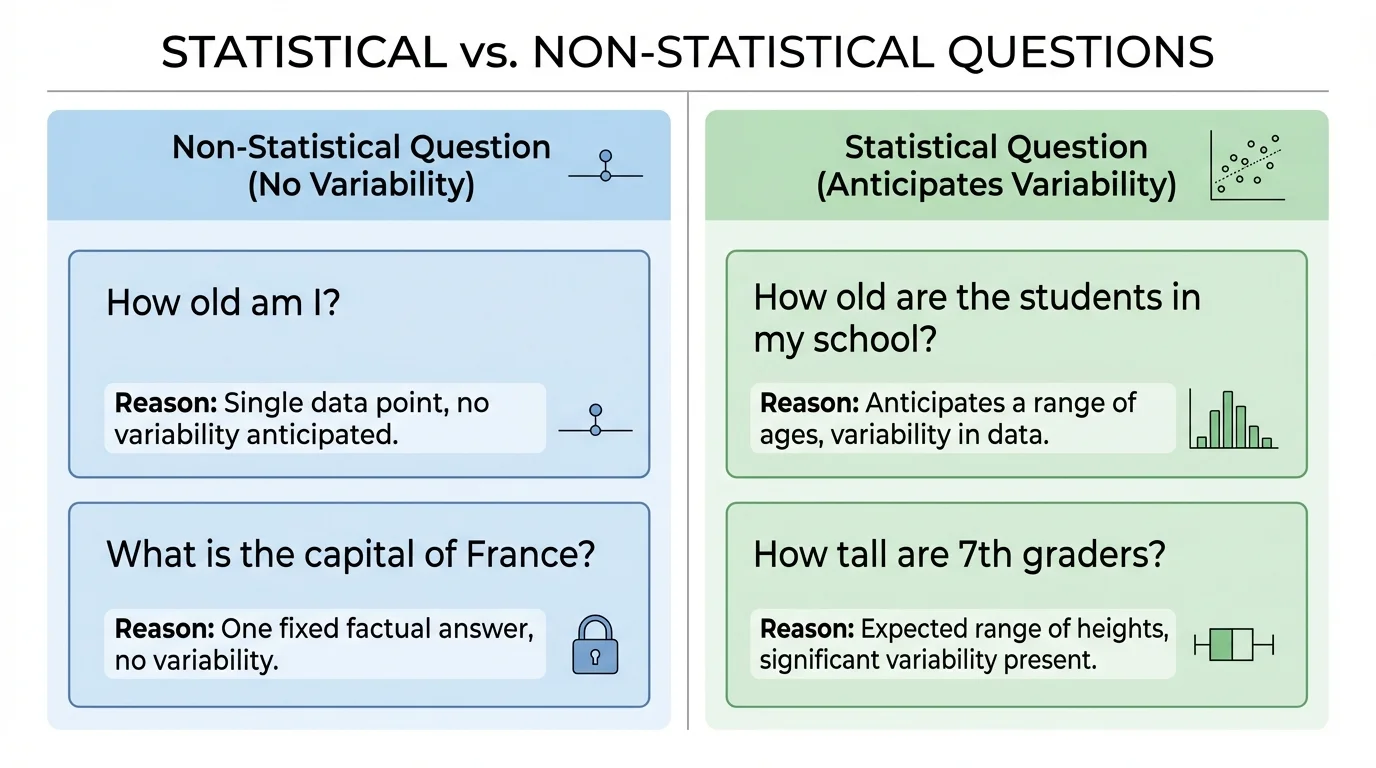
Now compare that with "How many books did Maya read last month?" If Maya is one person and we are asking about one month, there is one answer. Even if we do not know it yet, the question itself does not expect a set of varying answers. So it is not statistical. This contrast is shown in [Figure 2].
Sometimes students think a question is statistical just because it sounds hard or because numbers are involved. But numbers alone do not make a question statistical. "What is the temperature in this room right now?" may involve a number, but it still has one measured answer at that moment.
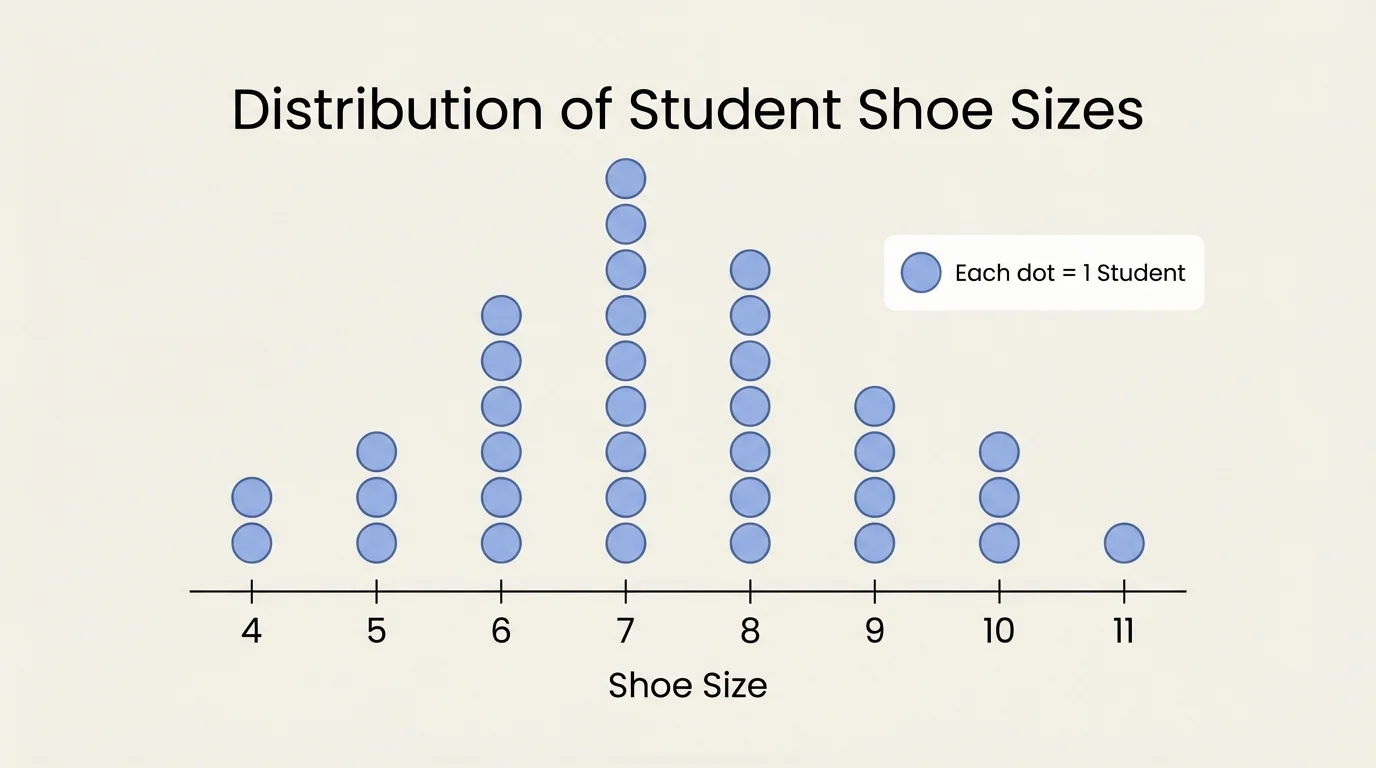
Data in a group are often different, and that difference matters. Student shoe sizes can spread across several values instead of landing on just one size. That spread is what statistical questions are built to study.
Think about asking, "How tall are the students in our class?" Even if everyone is about the same age, heights will still differ. Some students may be \(56\) inches tall, some \(60\), and some \(63\). If all we said was one height, we would miss the real story of the data.
Variability can happen for many reasons: people are different, conditions change, measurements are not identical, and events do not always happen the same way. If you record how many minutes students practice an instrument each week, you should expect differences because schedules, interests, and activities are not all the same.
Not every difference is large. Sometimes values are close together, and sometimes they are far apart. Both situations still involve variability. If six students have quiz scores of \(88\), \(89\), \(90\), \(90\), \(91\), and \(92\), the data vary only a little. If the scores are \(60\), \(72\), \(78\), \(89\), \(95\), and \(100\), the variability is much greater.
Recognizing variability helps us understand why a statistical answer is usually not one single number by itself. A better answer might describe a typical value, a range, or a pattern in the data.
Weather reporters use statistical questions often. A question like "What is the high temperature today?" is not statistical, but "What are the high temperatures in our city during April?" is statistical because the daily temperatures vary.
When we ask about repeated events, such as daily rainfall or the number of steps someone takes each day, variability is expected because each day can be different. [Figure 3] helps organize this way of testing a question.
A useful way to test a question is to ask three things: Is it about more than one case or repeated measurements? Do I expect different values? Will the answer need data that show those differences?
Let us compare several examples.
Not statistical: "How many siblings does Carlos have?" This has one answer for Carlos.
Statistical: "How many siblings do students in our class have?" Different students may have \(0\), \(1\), \(2\), \(3\), or more siblings.
Not statistical: "What time does the movie start?" There is one scheduled time.
Statistical: "What times do students in our class usually go to bed on school nights?" Bedtimes vary from student to student.
Not statistical: "What is the score of this game right now?" At one moment, the game has one score.
Statistical: "How many points does our team usually score in games?" Different games produce different scores.
| Question | Statistical? | Reason |
|---|---|---|
| How old is the school librarian? | No | It asks about one person and has one answer. |
| How old are the teachers in our school? | Yes | Different teachers have different ages. |
| How long is this pencil? | No | One object has one measured length. |
| How long are the pencils in this box? | Yes | Different pencils may have different lengths. |
| Did Ava bring lunch today? | No | It asks about one student on one day. |
| How many students bring lunch on Fridays? | Yes | Data from many students are needed. |
Table 1. Examples comparing statistical and non-statistical questions.
Some statistical questions can be answered with numbers, and some with categories. For example, "What pets do students in our class own?" is statistical even though answers may be categories like dog, cat, fish, or no pet. The key idea is still variability: different students may give different answers.
Also, a question can be statistical even if the group is small. Asking five students about their favorite school subject can still be statistical because the answers may vary. A huge group is not required.
Answers to statistical questions often describe a set of data, not just one value. If someone asks, "How many minutes do sixth graders read each night?" a strong answer might be, "Most students read between \(20\) and \(40\) minutes, and the average is about \(30\) minutes." That answer accounts for differences.
Notice that this type of answer may mention a distribution, a center, or a spread. The formal study of these ideas comes later, but even now you can understand the big picture: a statistical answer tells something about the whole set of data.
How statistical answers account for variability
A statistical question is not fully answered by naming just one data value from the set. Instead, the answer should describe what the data are like overall. It may mention what values are common, what values are unusual, how far apart the values are, or what category appears most often.
For example, if the question is "What are the favorite fruits of students in class \(6A\)?" then saying "Lena likes apples" is not enough. A better answer is "Apples and mangoes are the most common choices, and only a few students chose pears." That answer uses the whole group.
In the same way, for "How far do students travel to school?" one answer might be "Distances range from about \(0.5\) mile to \(6\) miles, and many students travel around \(2\) miles."
These worked examples show how to decide whether a question is statistical and how to improve a question when needed.
Worked Example 1
Decide whether the question "What is the height of the flagpole outside our school?" is statistical.
Step 1: Identify what is being asked.
The question asks about one object: one flagpole.
Step 2: Check for expected variability.
There is no set of many values expected here. The flagpole has one height.
Step 3: Decide.
Because the question does not anticipate different data values, it is not a statistical question.
Answer: The question is not statistical.
A single measurement can still be useful, but usefulness does not make it statistical. The main test is whether variation is expected in the data.
Worked Example 2
Decide whether the question "How many hours of sleep do students in grade \(6\) get on school nights?" is statistical.
Step 1: Identify the group.
The group is all students in grade \(6\).
Step 2: Check for expected variability.
Different students likely sleep for different numbers of hours, such as \(7\), \(8\), \(9\), or \(10\) hours.
Step 3: Decide how the answer would look.
The answer would need data from many students and would probably describe what amount is common or typical.
Answer: The question is statistical.
Notice that the answer might include a range like "most students sleep between \(8\) and \(9\) hours." That is the answer accounting for variability.
Worked Example 3
Rewrite the non-statistical question "How long does it take Mia to get to school?" so that it becomes statistical.
Step 1: Find why the original question is not statistical.
It asks about one person, Mia, for one travel time.
Step 2: Change it so variation is expected.
We can ask about many students instead of one student.
Step 3: Write a statistical version.
A better question is "How long does it take students in our class to get to school?"
Answer: The rewritten question is statistical because different students will have different travel times.
Rewriting is a powerful skill. Often, all you need to do is shift from one case to a group or from one moment to repeated observations.
Worked Example 4
Classify the question "What is the most common favorite ice cream flavor among students at our school?"
Step 1: Notice the group.
The question is about students at a school, not one student.
Step 2: Check for different possible answers.
Students may choose chocolate, vanilla, strawberry, mint, or other flavors.
Step 3: Decide whether the answer uses the whole set of data.
The phrase "most common" means the answer must compare many responses.
Answer: This is a statistical question.
This example is important because the answers are categories, not measurements. Statistical questions can involve either kind of data.
Schools use statistical questions to make decisions. A cafeteria manager may ask, "Which lunch choices are most popular?" That helps with planning meals. A teacher may ask, "How many minutes do students need to finish this assignment?" That helps with setting fair time limits.
Sports are full of statistical questions. A coach might ask, "How many rebounds does our team get per game?" Because each game is different, data vary from game to game. Looking at the collection of scores or rebounds helps the coach understand team performance better than one game alone.
Scientists and doctors ask statistical questions too. "How many hours do patients sleep after taking this medicine?" or "How much rain falls in this town each month?" both require many data values and attention to variability. As we saw earlier with the spread of shoe sizes in [Figure 2], patterns are clearer when we look at the whole set rather than one case.
Companies also use statistical questions when designing products. They may ask what screen size people prefer, how long batteries last under normal use, or how many users click a certain button. The answers guide real choices in the world.
One common mistake is thinking that any question about a group is automatically statistical. Usually that is true, but only if variation is expected. For example, "How many sides do shapes in this set of triangles have?" is about a group, but every triangle has \(3\) sides. No variability is expected in that data, so it is not statistical.
Another mistake is thinking that only numerical questions can be statistical. But categorical data can vary too. Favorite color, type of pet, and choice of music can all be part of statistical questions.
A third mistake is forgetting that repeated measurements can create variability even for one object or place. "What is the temperature in our classroom at \(2{:}00\) p.m. each day for a month?" is statistical because the temperature may change from day to day.
Earlier work with questions and data helps here: a question leads to data collection, and data collection leads to analysis. The new idea is that statistical questions are specially designed to expect and use variation in the results.
It is also possible for a yes-or-no question to be statistical if it is asked about a group. "Did Jordan finish the book?" is not statistical. "How many students in our class finished the book?" is statistical because students may answer differently, and we need the set of responses. [Figure 4] shows how such a question leads into data collection and analysis.
A statistical investigation follows a path from asking a question to organizing data and describing variation. The question comes first, and its wording matters because it decides what data are needed.
If the question is statistical, the next step is to collect data from a group or from repeated observations. After that, the data can be organized in a table, a list, or a graph. Then we look for patterns: what is common, what is uncommon, and how much the values vary.
For example, suppose the question is "How many minutes do students in our class spend reading on weekends?" We might survey the class, collect the numbers, sort them, and then describe the data. We may find that many students read between \(30\) and \(60\) minutes, while a few read much longer. That kind of answer uses the variability instead of ignoring it.
The flow matters because a weak question leads to weak data. If the question does not expect variability, then there is not much statistical analysis to do. If the question is well designed, the data can reveal interesting patterns.
Later, when students study graphs and measures such as mean and range, they will use these tools to answer statistical questions more precisely. But the first and most important skill is recognizing whether a question is statistical in the first place.
When deciding, keep returning to the same idea: a statistical question expects differences in the data and answers those differences by using information from a whole set of data, not just one case. That is why "How old am I?" is not statistical, while "How old are the students in my school?" is statistical.