A number by itself can be a mystery. If someone says, "My answer is \(12\)," you still do not know whether that means \(12\) inches, \(12\) minutes, \(12\) books, or \(12\) points in a game. In statistics, clear descriptions matter because data are only useful when we know what was studied, how the information was collected, and which units were used.
When people study data, they are usually investigating some feature of a group. They might look at how tall students are, how many push-ups they can do, how long seeds take to sprout, or how much water different cups can hold. A good statistical description tells the reader exactly what each number means.
Attribute under investigation is the characteristic or feature being studied in a group. It is what the data values are about.
Measurement is the process of finding a value for an attribute, often using a tool or procedure.
Unit of measurement is the label that tells what kind of amount a number represents, such as centimeters, seconds, grams, or liters.
For example, if a class records numbers like \(135\), \(142\), \(128\), and \(150\), those values are not meaningful until we know their context. They might be students' heights in centimeters, times to finish a race in seconds, or the number of pages in different books. Context turns raw numbers into useful information.
Statistics is not just about doing calculations. It is about making sense of real information. If we say, "The median is \(24\)," that is incomplete. But if we say, "The median amount of time students in the class spent reading last night is \(24\) minutes," now the statement is clear.
Descriptions help us avoid confusion. They also help us compare data fairly. Suppose one student measures desk length in inches and another measures in centimeters. If they do not tell their units, their numbers may look very different even when the desks are nearly the same size.
Good statistical descriptions have three parts. A strong description of numerical data usually tells: the attribute being studied, the way it was measured or counted, and the unit used. For example: "These data show the masses of lunch apples, measured on a digital scale in grams." That sentence tells the reader what the values mean.
Clear descriptions also help when summarizing distributions. If you talk about the center, spread, or overall shape of a data set, the context should always stay attached to the numbers. A range of \(18\) could mean a big difference in quiz points, but a small difference in plant heights, depending on the units and situation.
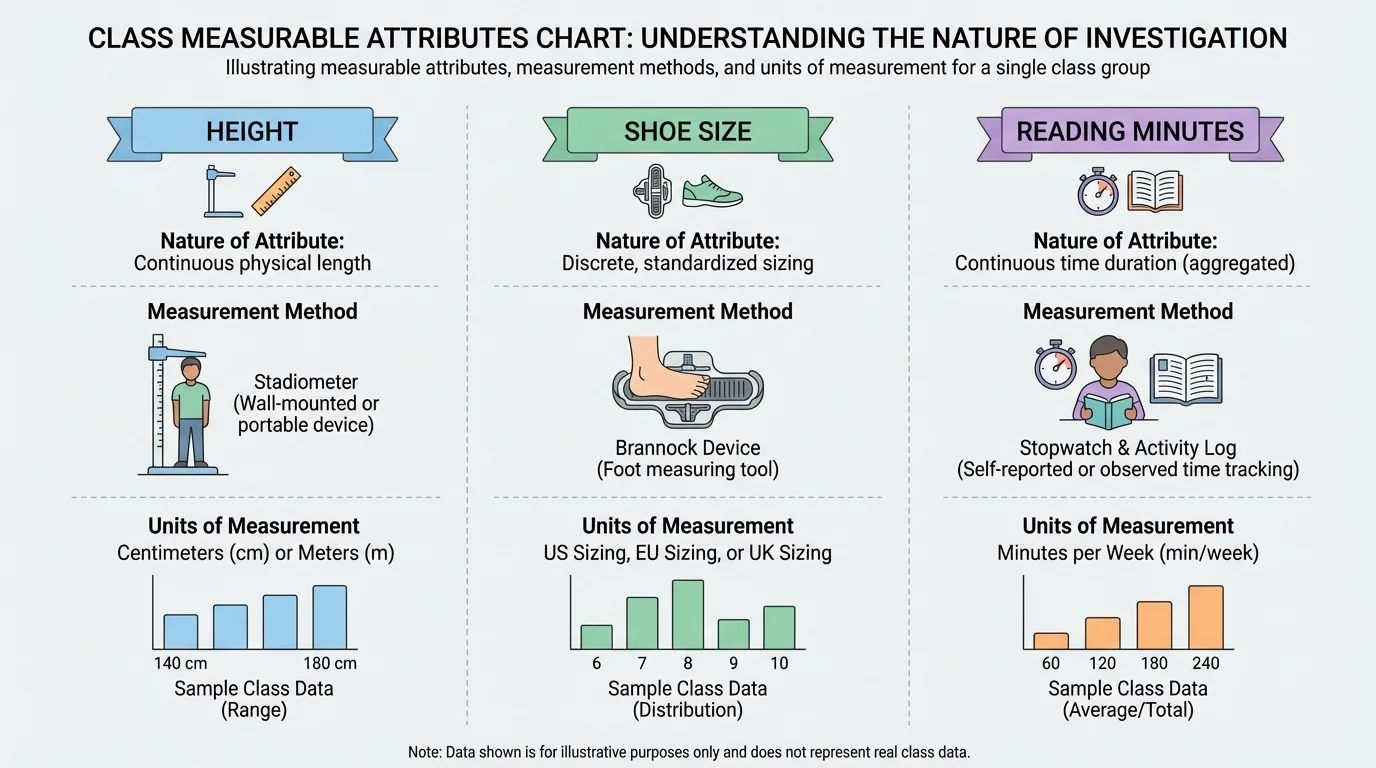
The attribute under investigation is the exact characteristic you want to learn about. The same group can be studied in many different ways, as [Figure 1] shows. A class of students could be investigated by height, age, number of siblings, reading time, shoe size, or distance jumped. The group stays the same, but the attribute changes.
To name the attribute clearly, be specific. "Student information" is too broad. "Student height" is much better. "Time each student spent on homework last night" is even more specific, because it tells exactly what was measured and when.
Some attributes are found by counting. For example, the number of pets in each household is counted. Other attributes are found by measuring. For example, the length of each pencil is measured with a ruler. Both counting and measuring can create numerical data, but the method is different.
Here are several examples of attributes under investigation:
Notice that these descriptions focus on the thing being measured, not on the list of numbers. That is important because statistics always begins with a question about a real situation.
Later, if we say a data set has a median of \(18\), the meaning depends completely on the attribute. A median of \(18\) centimeters, \(18\) seconds, and \(18\) books are very different ideas, which is why the context seen earlier in [Figure 1] continues to matter even after the data are collected.
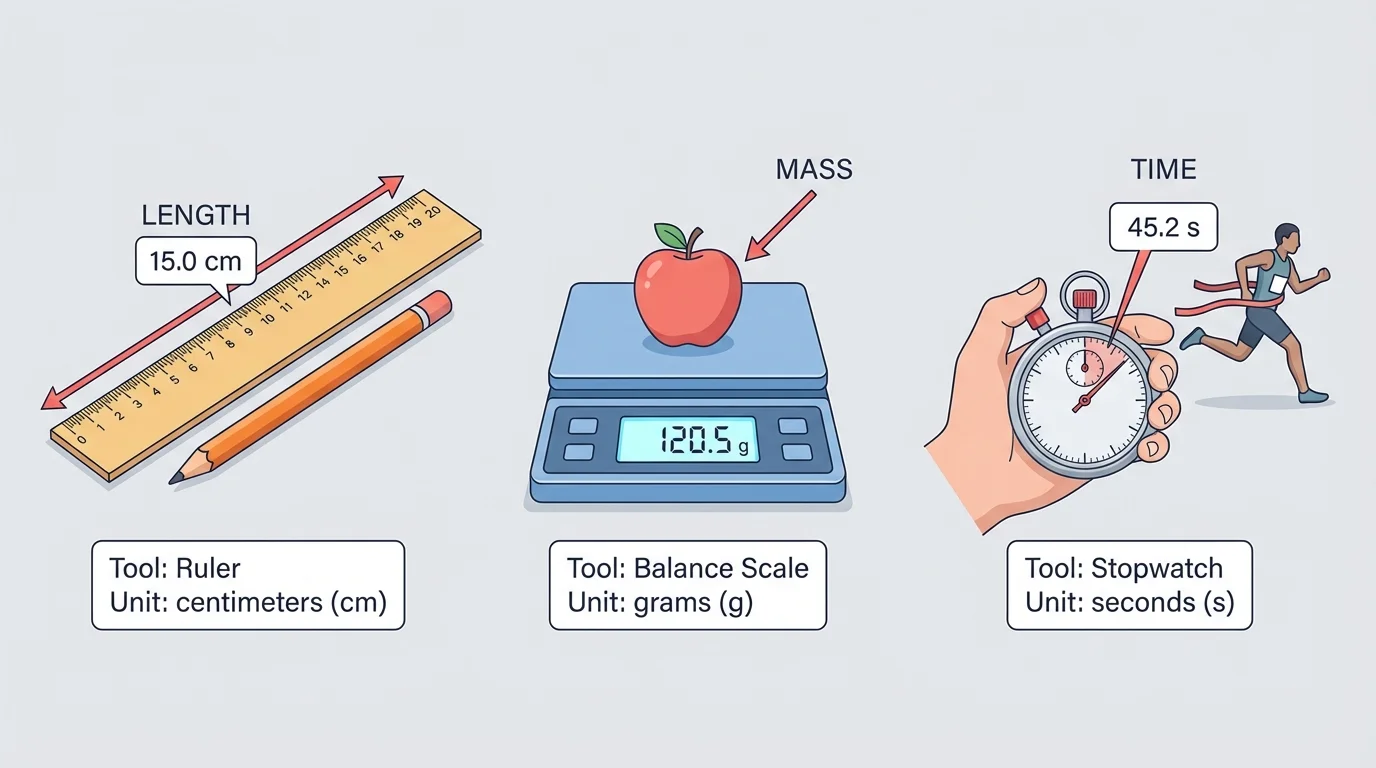
The measurement method tells how each value was obtained. Different attributes need different tools and procedures, as [Figure 2] illustrates. Length might be measured with a ruler or measuring tape. Mass might be measured with a balance or digital scale. Time might be measured with a clock or stopwatch.
The method should match the attribute. If you want the mass of an apple, a ruler is the wrong tool. If you want the length of a desk, a stopwatch is not helpful. Choosing the correct tool makes the data more accurate.
It is also important to measure the same way each time. If one student measures height with shoes on and another measures height with shoes off, the data may not be fair to compare. If one race time starts when the runner hears "go" but another begins a second later, the times are not collected consistently.
Sometimes values are not measured with tools at all. They are counted. For example, if students collect data on the number of books read in a month, they count the books. The description should say this clearly: the values are counts, not lengths, masses, or times.
Good measurement descriptions answer questions like these:
For example, "The lengths of the pencils were measured to the nearest centimeter with a ruler" is much clearer than just saying "pencil data."
A tiny change in how data are measured can change the results. In sports, race times are often recorded to very small parts of a second because even a difference of less than \(1\) second can decide the winner.
Consistency is one reason scientists and survey makers write careful instructions. The clearer the method, the easier it is to trust and understand the data. That same idea appears in [Figure 2], where each attribute is matched with a suitable tool.
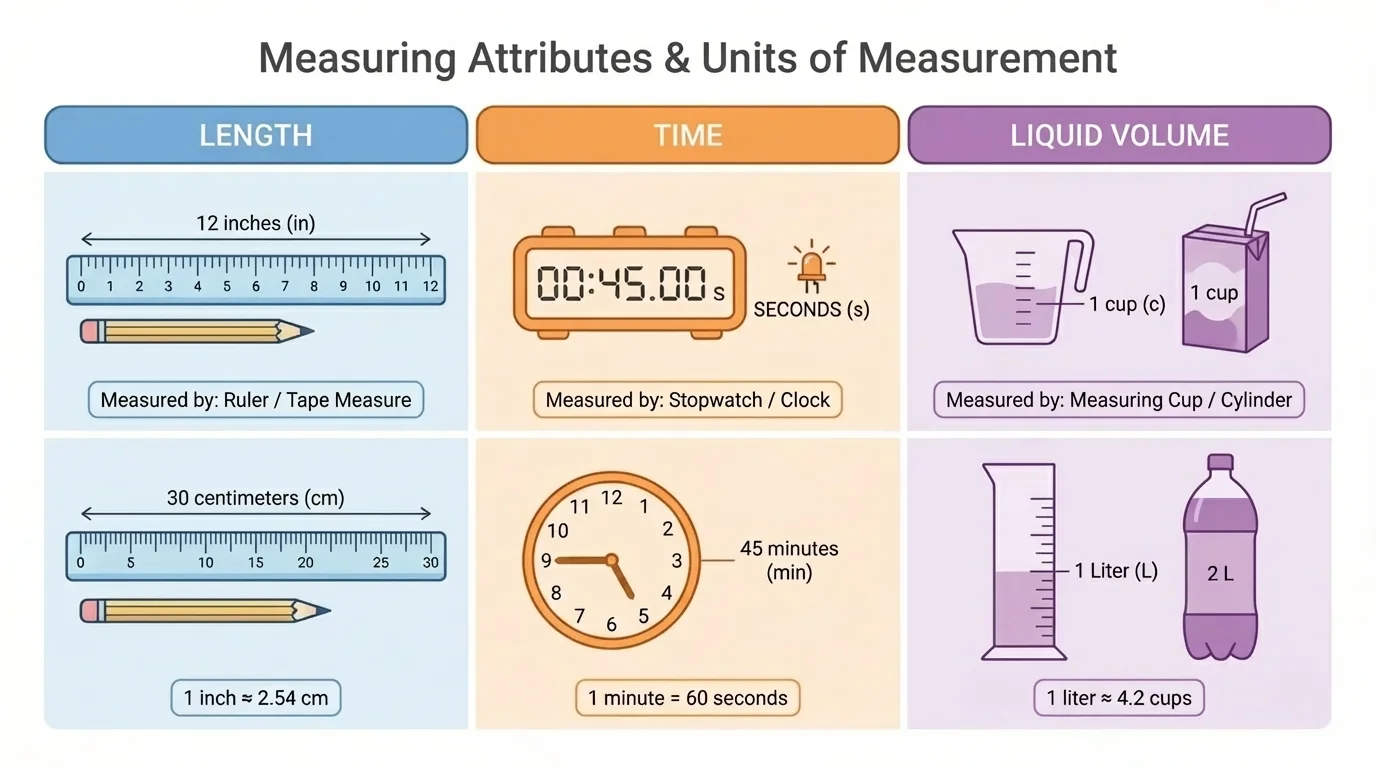
A unit of measurement tells what kind of amount the number represents. Without units, a number is incomplete, as [Figure 3] makes clear. If someone says a ribbon is \(30\), you must ask: \(30\) what? It could be \(30\) centimeters, \(30\) inches, or even \(30\) millimeters.
Common units for sixth-grade data include centimeters and inches for length, seconds and minutes for time, grams and kilograms for mass, and milliliters and liters for liquid volume. The best unit depends on the size of the thing being measured.
Here is a comparison of some common attributes and units:
| Attribute | How it may be measured | Possible units |
|---|---|---|
| Length of a pencil | Ruler | centimeters, inches |
| Time to run a lap | Stopwatch | seconds, minutes |
| Mass of an apple | Scale | grams |
| Water in a bottle | Measuring cup or marked bottle | milliliters, liters |
| Number of siblings | Count | no measurement unit; counted items |
Table 1. Examples of attributes, ways to obtain values, and possible units.
Notice that counted data, such as number of siblings, do not use measurement units like centimeters or grams. The values are still numerical, but they represent counts of objects or people.
Sometimes the same attribute can be expressed in different units. For example, a race time of \(120\) seconds is the same as \(2\) minutes. A desk length of about \(122\) centimeters is about \(48\) inches. The units may change, but the actual measurement does not. This is why the labels in [Figure 3] are so important when reading a data table or graph.
When you describe a numerical data set, your description should sound like a complete sentence about a real situation. Instead of saying, "These are measurements," say, "These data show the heights of bean plants after \(3\) weeks, measured in centimeters."
Context helps us understand whether values are reasonable. If a student reports a pencil length of \(150\) centimeters, that seems too large for a pencil. If the value is actually \(150\) millimeters, the measurement makes more sense. Good descriptions help spot mistakes.
When you summarize a data set, you may talk about its center, spread, and overall pattern. Those summaries are only meaningful when attached to the context. A median, range, or cluster must always refer to an actual attribute with clear units or counts.
Context also matters when comparing groups. Suppose two classes collect reading-time data. One class records minutes read per night, and the other records pages read per night. Both are useful, but they measure different attributes. Because the attributes are different, the data sets should not be compared as if they mean the same thing.
A strong description often includes four ideas: the group being studied, the attribute, the measurement method, and the units. For example, "The data represent the masses of \(20\) science notebooks, measured on a digital scale in grams."
Let's practice identifying the important parts of a description and writing them clearly.
Worked example 1
A teacher records the numbers \(18, 20, 21, 17, 19\) after students finish a short sprint. Describe the attribute, the method, and the units.
Step 1: Identify what the numbers are about.
Because the numbers were recorded after a sprint, the attribute is the time each student took to finish the sprint.
Step 2: Decide how the values were obtained.
Race time is measured, not counted. A likely method is using a stopwatch.
Step 3: State the units.
For a short sprint, the units are most reasonably seconds.
A clear description is: The data show the time each student needed to finish the sprint, measured with a stopwatch in seconds.
This example shows that the same numbers could mean something completely different in another setting. The context tells us what the values represent.
Worked example 2
A class survey gives the values \(0, 1, 2, 2, 3, 4, 1\) for students in the class. The question on the survey is "How many brothers and sisters do you have?" Describe the data.
Step 1: Identify the attribute.
The attribute is the number of siblings each student has.
Step 2: Decide whether the values were measured or counted.
These values are counted. Students count their brothers and sisters.
Step 3: Consider units.
There is no measurement unit like centimeters or grams. The values are counts of people.
A clear description is: The data show the number of siblings for each student in the class, found by counting.
Count data are still numerical data, but they usually do not use standard measurement units.
Worked example 3
Students collect the values \(250, 300, 275, 290\) for four water bottles. They use a graduated cup to find how much water each bottle holds. Describe the data.
Step 1: Identify the attribute.
The attribute is the amount of water each bottle can hold, also called capacity or volume.
Step 2: Identify the method.
The bottles were measured using a graduated cup.
Step 3: Identify the units.
Values like \(250\) and \(300\) for bottles are likely milliliters.
A clear description is: The data show the amount of water each bottle can hold, measured with a graduated cup in milliliters.
Here the unit is essential. Without milliliters, the numbers \(250\) and \(300\) would be unclear.
Worked example 4
A student writes: "These data are about plants. The numbers are \(12, 14, 11, 15\)." Rewrite the description so it is complete, assuming the values are plant heights measured after two weeks.
Step 1: Find what is missing.
The description does not say exactly what plant feature was studied, how the values were obtained, or the units.
Step 2: Add the attribute.
The attribute is the height of each plant after two weeks.
Step 3: Add method and units.
Plant height is measured, likely with a ruler, in centimeters.
A complete description is: These data show the heights of the plants after two weeks, measured with a ruler in centimeters.
Each worked example follows the same pattern: name the attribute, explain the method, and include the units when needed.
One common mistake is giving only the numbers. For example, writing "\(8, 10, 12, 15\)" does not tell the reader anything useful by itself. Always attach the numbers to a real-world meaning.
Another mistake is using vague descriptions. "Sports data" is too broad. A better description is "the number of free throws made by each player in one game." The more precise your words are, the easier it is to understand the data.
A third mistake is leaving out units. Suppose a student says the average plant height is \(24\). If the unit is centimeters, that may be normal. If the unit is meters, it would be impossible for a classroom plant. Units help us judge whether the data make sense.
Be careful with mixed units. If one value is recorded in inches and another in centimeters, the data set is hard to compare fairly. Before summarizing or graphing, measurements should use the same unit throughout the set.
Students also sometimes confuse the attribute with the object. The object might be "pencils," but the attribute is "length of each pencil." The object tells what items are in the study. The attribute tells what feature of those items is being examined.
People use careful data descriptions all the time. Doctors record patients' temperatures, heights, masses, and heart rates using specific tools and units. Coaches track lap times in seconds and jump distances in meters or feet. Scientists measure rainfall, temperature, and plant growth using standard methods so that different people can understand and compare the results.
Businesses also need clear descriptions. A company might study the mass of cereal in each box, the time needed to assemble a toy, or the number of customers entering a store each hour. If the attribute or units are unclear, the data can be misunderstood and lead to poor decisions.
"Numbers tell a story only when we know what they are measuring."
Even in everyday life, you use this skill. When you read a sports scoreboard, a recipe, a weather report, or a fitness app, you are interpreting data with attributes, methods, and units. Understanding those pieces helps you read information accurately and describe it clearly yourself.