Every day, people make claims about large groups using information from much smaller groups. A news poll may predict how people will vote. A company may test only a few cereal boxes from a factory. A school may ask some students what lunch they prefer instead of asking everyone. These decisions matter because a small amount of data can be powerful—but only when it is collected the right way.
In statistics, the population is the entire group we want to learn about. The sample is a smaller group taken from that population. If a seventh-grade class wants to know the average number of hours students in the whole school spend on homework, the population is all students in the school, and the sample might be a smaller set of students chosen to answer the question.
Sometimes it is possible to ask every person in a population, but often it is too difficult, too expensive, or takes too much time. A school with 900 students could survey everyone, but a state with millions of people cannot easily ask each person every question. That is why statistics often depends on samples.
Population means the entire group being studied.
Sample means part of the population chosen for study.
Inference means a conclusion about a population based on information from a sample.
The goal is not just to collect data. The goal is to use the data to make an accurate inference about the whole population. If the sample reflects the population well, then the inference may be useful. If the sample does not reflect the population well, the conclusion may be misleading.
Suppose a principal wants to know whether students would support a later school start time. Asking all students may take too long, so the principal surveys 100 students. The principal then uses the responses from those 100 students to estimate what all students might think. That is statistics in action: using a sample to learn about a population.
But there is an important warning. A sample does not automatically represent the population. A sample can be too small, chosen unfairly, or focused on only one kind of person. If that happens, the sample result may not match the population at all.
Why sample results can never guarantee the exact truth
A sample gives information, not certainty. Even a good sample is still only part of the population. Statistics helps us make reasonable conclusions, but those conclusions depend on how the sample was chosen and how much it resembles the population.
For example, if 62 out of 100 students in a sample support a later start time, we might estimate that about \(62\%\) of the whole school might support it. That estimate is useful only if the 100 students were chosen in a fair way.
A representative sample is a sample that reflects the important characteristics of the population, as [Figure 1] shows. If the school population includes students from all grade levels, activities, and schedules, then a representative sample should also include a reasonable mix of those groups.
If a survey about school lunch includes only students who eat in the cafeteria every day, it leaves out students who bring lunch from home. If a survey about sports interest includes only members of the basketball team, it does not represent the whole school. In both cases, the sample may be biased.
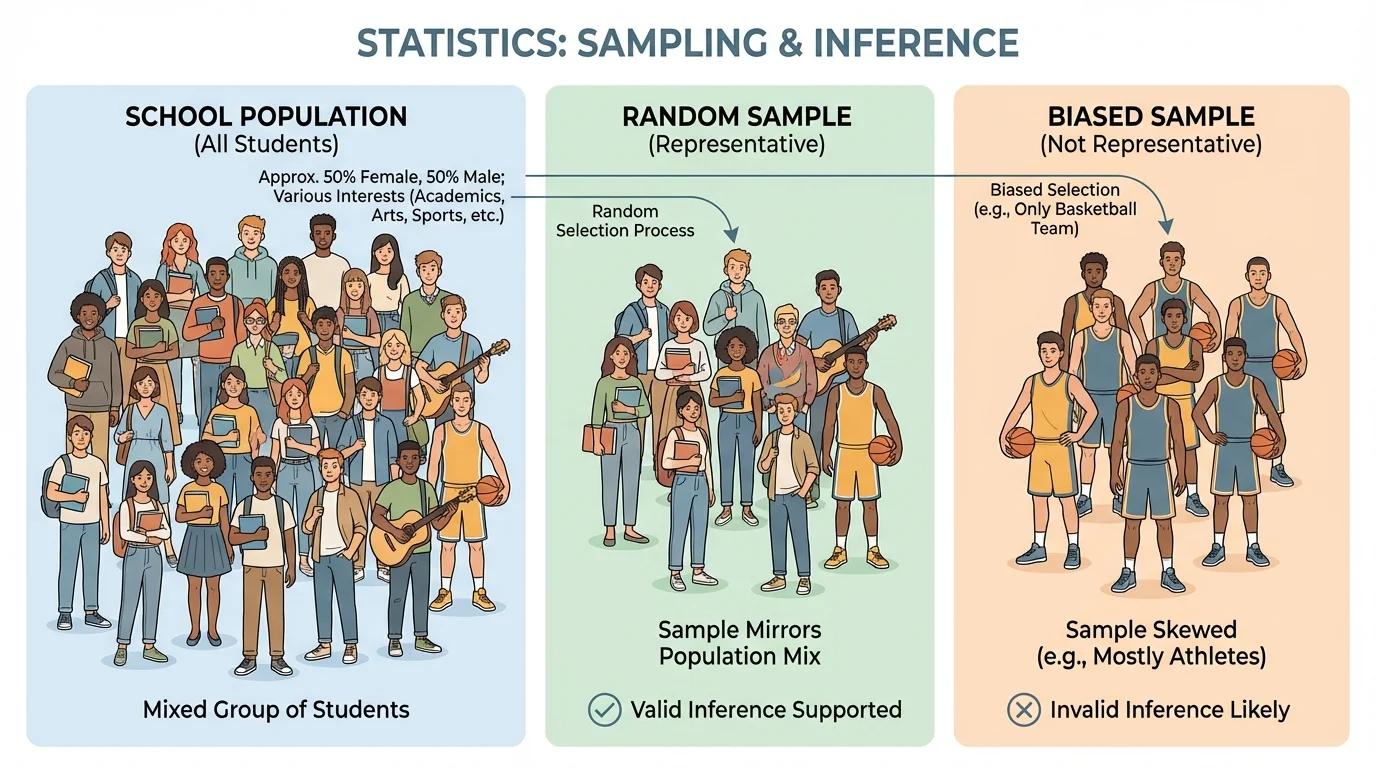
A biased sample favors some parts of the population over others. Bias can happen when the sample is chosen in a way that gives too much weight to one group and too little to another. Biased samples can lead to invalid generalizations.
Think of tasting soup. If you stir the soup and take one spoonful, the taste is more likely to represent the whole pot. But if you only scoop from the top where the oil is floating, your spoonful may not represent the soup well. A sample works the same way. It should give a fair picture of the whole group.
Election polls sometimes seem wrong not because statistics failed, but because the sample did not fully represent the voters who actually showed up. Getting a truly representative sample is one of the hardest parts of real-world statistics.
Being representative does not mean the sample must be exactly identical to the population. It means the sample should be close enough that using it to make a general statement is reasonable.
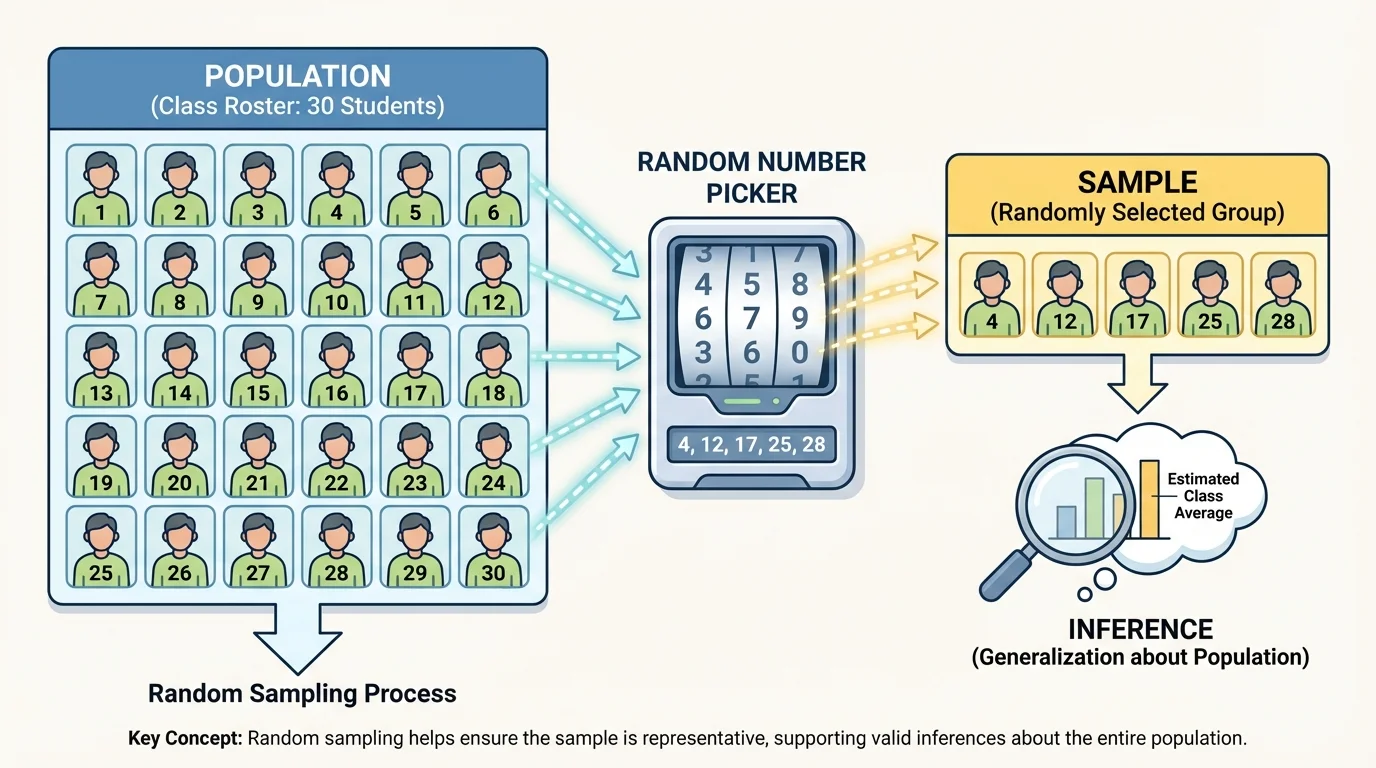
Random sampling means choosing members of the population so that each member has a fair chance to be selected, as [Figure 2] illustrates with a numbered list and random number picker. Random sampling helps prevent people from choosing only the individuals they expect to agree with them.
One simple way to create a random sample is to number every person in the population and then use a random number generator to select the sample. If there are 200 students in a grade, you could label them from \(1\) to \(200\) and randomly choose \(25\) numbers. The students whose numbers are selected become the sample.
Random sampling does not guarantee a perfect sample every time, but it tends to produce samples that are more representative than samples chosen by convenience or personal choice. That is why random sampling supports more valid inferences.
For instance, suppose you stand by the gym before school and survey the first 20 students you see about favorite after-school activities. You may get too many athletes because of where you are standing. But if you randomly choose 20 students from the whole student list, you are less likely to favor one group.
In earlier work with data, you learned to describe distributions and compare groups. Here, the new idea is that the way the data is collected matters just as much as the numbers themselves.
Random sampling is powerful because it gives the sample a better chance of including the variety that exists in the population. Later, when we use percentages or ratios from the sample, our estimates are more trustworthy.
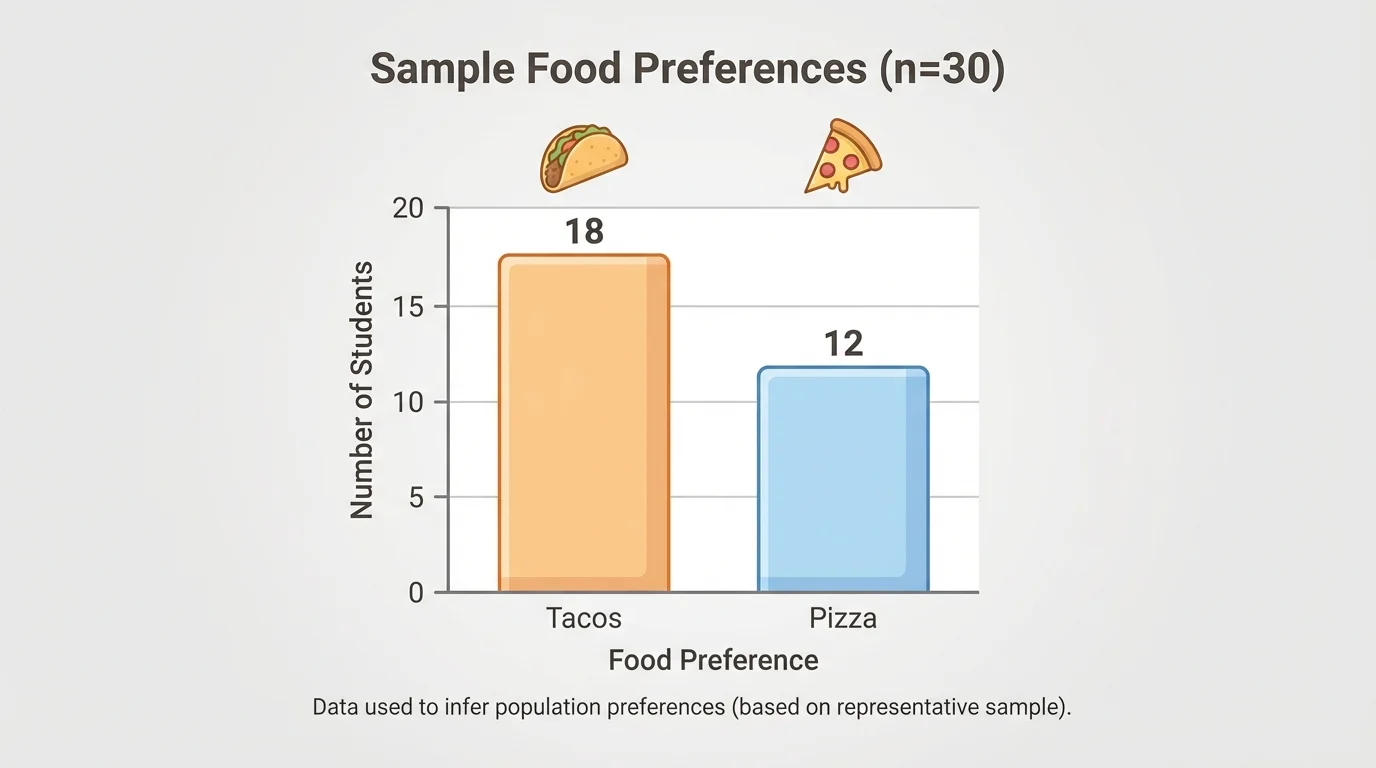
A sample proportion can be used to estimate a population proportion, and [Figure 3] connects the sample data to the schoolwide estimate. Suppose a school wants to know whether students prefer tacos or pizza for a special lunch day. A random sample of \(30\) students is chosen. In the sample, \(18\) prefer tacos and \(12\) prefer pizza.
Worked example: estimating a population preference
Step 1: Find the sample proportion that prefers tacos.
The proportion is \(\dfrac{18}{30}\).
\[\frac{18}{30} = \frac{3}{5} = 0.6\]
Step 2: Convert the proportion to a percent.
\(0.6 = 60\%\).
Step 3: Use the sample to make an inference about the population.
If the sample is representative, then about \(60\%\) of the whole school may prefer tacos.
The school can reasonably infer that tacos are likely more popular than pizza, but only because the sample was randomly selected.
If the school has \(500\) students, we can also estimate the number who may prefer tacos by finding \(60\%\) of \(500\).
\[0.6 \times 500 = 300\]
So about \(300\) students may prefer tacos. This is an estimate, not an exact count.
Now consider two different ways to survey students about whether school should add more bike racks.
Worked example: deciding whether a sample is valid
Step 1: Look at Sample A.
Sample A surveys \(25\) students who arrived by bicycle.
Step 2: Look at Sample B.
Sample B randomly surveys \(25\) students from the entire student roster.
Step 3: Decide which sample is more representative.
Sample B is more representative because every student had a fair chance to be chosen. Sample A is biased because it includes only students already using bicycles.
Generalizations from Sample B are more likely to be valid than generalizations from Sample A.
This example shows that the size of a sample is not the only thing that matters. A sample of \(25\) people can still be poor if it is chosen unfairly. A smaller random sample may be more useful than a larger biased one.
As we saw with the comparison in [Figure 1], a sample must reflect the whole population, not just one subgroup. Otherwise, the data answers a different question than the one we intended to ask.
Sometimes a sample tells us a fraction or percent, and we use that to estimate how many individuals in the whole population have a certain trait.
Worked example: estimating from a random sample
A random sample of \(50\) books from the school library is checked. In the sample, \(14\) books are mystery books. The library has \(1{,}200\) books total. Estimate how many books in the whole library are mystery books.
Step 1: Find the sample proportion.
\[\frac{14}{50} = 0.28\]
Step 2: Apply the proportion to the whole population.
\[0.28 \times 1{,}200 = 336\]
Step 3: State the inference clearly.
If the sample is representative, then about \(336\) books in the library may be mystery books.
The word about is important because the result is an estimate based on a sample.
This type of reasoning is common in science, business, and government. People often cannot count every item immediately, so they estimate using a well-chosen sample.
Even when a sample is random, different random samples can produce different results. One random sample might show that \(58\%\) of students prefer online homework reminders, while another random sample might show \(63\%\). Both samples can still be reasonable.
This happens because samples naturally vary. A sample is only part of the population, so its results are not always exactly the same as the population results. That is one reason statistics is about making informed estimates, not claiming perfect certainty.
| Type of result | What it means | Can we generalize? |
|---|---|---|
| Random, representative sample | The sample fairly reflects the population | Yes, with caution |
| Biased sample | The sample overrepresents or underrepresents part of the population | No, not reliably |
| Too-small sample | The sample may not capture enough variety | Sometimes, but less confidently |
| Convenience sample | The sample is chosen because it is easy to reach | Usually not well |
Table 1. Comparison of different sample types and how reliable their generalizations are.
Sample size also matters. In general, a larger random sample tends to give a more stable estimate than a very small random sample. For example, a random sample of \(200\) students often gives a better picture than a random sample of only \(5\) students. But a large biased sample can still be misleading.
Valid inference
A valid inference is a conclusion about a population that is supported by a representative sample. The inference may still be an estimate, but it is based on a reasonable method of data collection.
That is why statisticians ask two important questions: How was the sample chosen? and Does the sample look like the population? If the answer to those questions is strong, then the inference is stronger too.
Random sampling is used in many places outside math class. Doctors may study a sample of patients to learn how a treatment works. Manufacturers may test a sample of products from a large shipment to check quality. Environmental scientists may test water from selected sites to estimate the health of an entire lake.
Sports analysts also use sampling ideas. A coach may study a sample of plays to understand a team's performance patterns. Social media companies test new features on a sample of users before launching them for everyone. In each case, the same idea appears: learn about a large group by examining part of it.
The school lunch example in [Figure 3] works the same way as these professional uses of statistics. A carefully chosen sample can guide decisions, save time, and reduce cost.
"Good decisions depend on good data, and good data begins with good sampling."
This is why sampling is not just about numbers. It is about fairness, accuracy, and making sure our conclusions are based on evidence that truly represents the group we care about.
One common mistake is to assume that any sample can represent a population. That is not true. If students are asked to fill out a survey voluntarily, the people who choose to respond may have stronger opinions than those who do not. The sample might not represent everyone.
Another mistake is to confuse a sample result with an exact population fact. If \(72\%\) of a random sample agrees with a rule change, that does not prove exactly \(72\%\) of the whole population agrees. It only suggests that the population percentage may be near that value.
A third mistake is to ignore who was left out. If a survey is given only online, people without easy internet access may be missing from the sample. A sample can seem large and organized but still fail to represent the entire population.
When reading statistics, always ask whether the sample was random, whether it seems representative, and whether the conclusion goes beyond what the data can support. Those questions help you judge whether a generalization is valid.