A company might describe one payment plan with a formula, show another in a graph, and list a third in a table. If you had to choose the best plan, you would need to compare functions even though they are not written the same way. That skill is one of the most useful ideas in algebra: seeing that different representations can describe the same kind of relationship.
A function is a rule that gives exactly one output for each input. In introductory algebra, functions often describe how one quantity changes as another changes. For example, the number of miles traveled may depend on time, or the total cost may depend on how many items are bought.
Sometimes two functions are easy to compare because both are written as equations. But often, one is written as an equation like \(y = 3x + 2\), while the other appears as a graph, a table, or a verbal description. Your job is to find important properties in each form and then compare them fairly.
From earlier work, you may remember that a linear relationship has a constant rate of change. That means when the input changes by equal amounts, the output also changes by equal amounts.
When comparing functions, the most important questions are often: Which function has the greater rate of change? Which one starts at a greater value? Which one gives a greater output for a certain input? Answering these questions requires reading carefully from each representation.
One of the most powerful ideas in algebra is that the same function can appear in several forms, as [Figure 1] shows. A function can be represented by an equation, a table, a graph, or a verbal description, and each form gives useful information in a different way.
An equation gives a direct rule. A table shows pairs of inputs and outputs. A graph shows the relationship visually on a coordinate plane. A verbal description explains the pattern in words, such as "The temperature starts at \(18\) degrees and rises \(2\) degrees each hour."
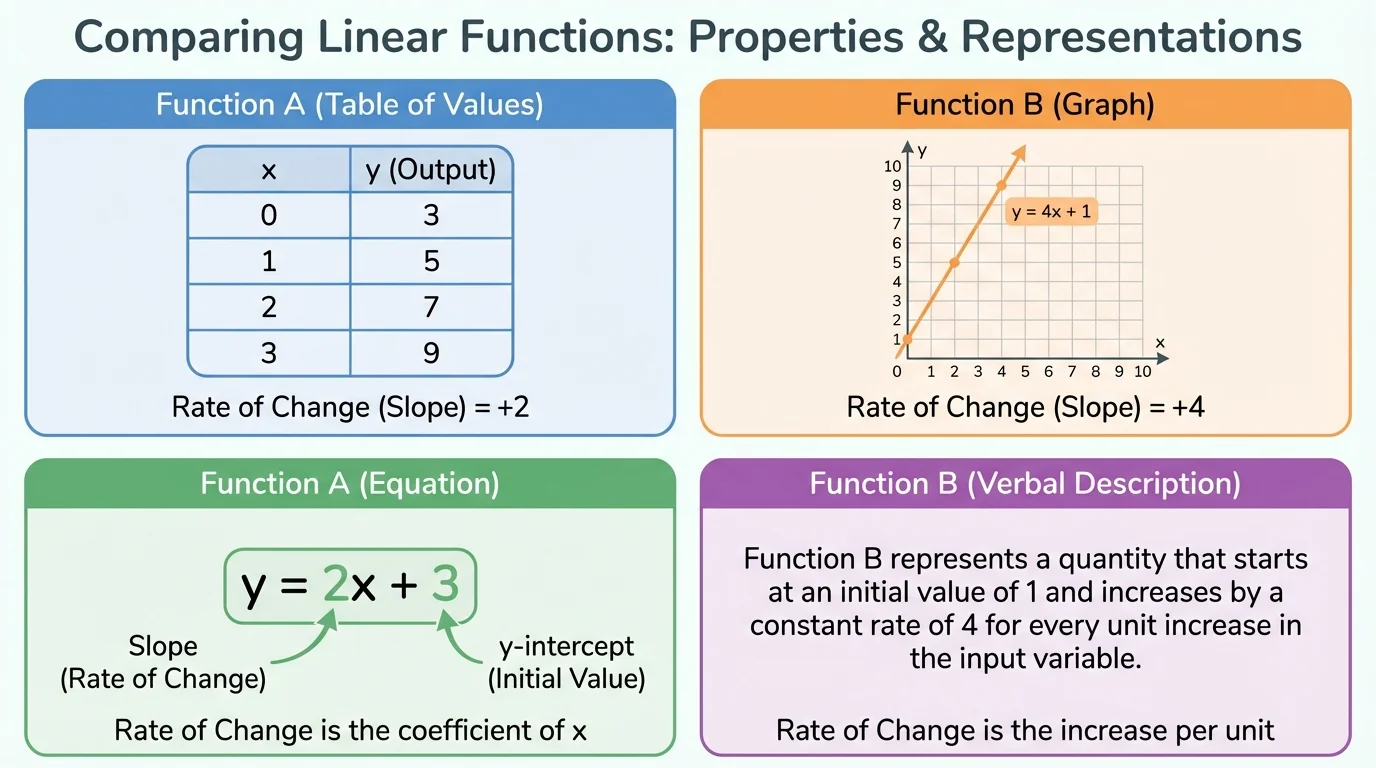
For a linear function, these different forms all describe a straight-line pattern. Even if the forms look different, they can still be compared by focusing on the same properties: rate of change, initial value, and outputs for specific inputs.
Linear function is a function that has a constant rate of change. Its graph is a straight line.
Initial value is the output when the input is \(0\). On a graph, it is the \(y\)-intercept.
Output is the value of the function for a given input.
For example, the equation \(y = 4x + 1\) has rate of change \(4\) and initial value \(1\). A table with outputs increasing by \(4\) each time \(x\) increases by \(1\) would represent a function with the same rate of change. A graph of that function would be a line rising \(4\) units for every \(1\) unit to the right.
When students compare functions, they should not just look at the format. A table is not "better" than a graph, and an equation is not automatically easier. Instead, compare the same properties in each representation.
The first major property is the slope, which is another word for rate of change in a linear function. Slope tells how fast the output changes compared with the input. If one function has slope \(5\) and another has slope \(2\), the first function changes faster in the positive direction.
The second major property is the initial value. In the equation \(y = mx + b\), the initial value is \(b\). In a table, it is the output when \(x = 0\). In a verbal description, it is the starting amount. In a graph, it is the point where the line crosses the \(y\)-axis.
A third important comparison is the value of each function at a particular input. You might be asked which function is greater when \(x = 3\), or whether two functions ever have the same output. To answer, evaluate each function or read the correct point from its representation.
Same questions, different forms
Whether a function is shown in words, a table, a graph, or an equation, the goal is the same: locate the relationship between input and output. If you can find how fast it changes and where it starts, you can compare it with another function in any form.
It is also important to notice whether a function is increasing or decreasing. A positive rate of change means the outputs increase as the inputs increase. A negative rate of change means the outputs decrease as the inputs increase.
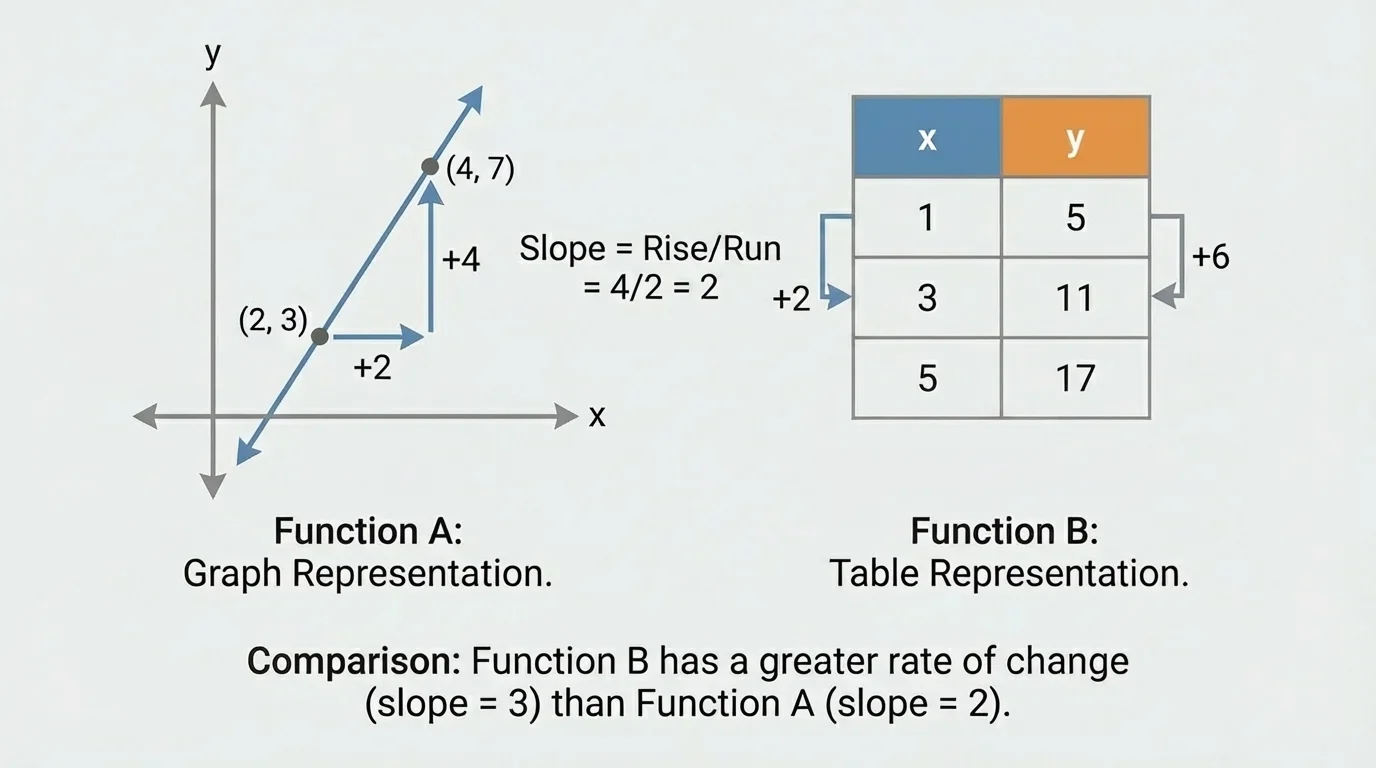
To compare linear functions accurately, you must know how to find rate of change from every form. For graphs, [Figure 2] illustrates that slope is found by comparing the vertical change, called rise, to the horizontal change, called run.
From an equation: In \(y = mx + b\), the rate of change is \(m\). For example, in \(y = -3x + 7\), the rate of change is \(-3\).
From a table: Compute the change in \(y\) divided by the change in \(x\). If \(x\) increases from \(1\) to \(3\) while \(y\) increases from \(4\) to \(10\), then the rate of change is \(\dfrac{10-4}{3-1} = \dfrac{6}{2} = 3\).
From a graph: Choose two clear points on the line and calculate rise divided by run. If the line goes through \((1,2)\) and \((4,8)\), then the slope is \(\dfrac{8-2}{4-1} = \dfrac{6}{3} = 2\).
From a verbal description: Look for how much the output changes for each unit of input. If a babysitter earns $12 for each hour worked, the rate of change is \(12\) dollars per hour. If a water tank loses \(5\) liters per minute, the rate of change is \(-5\) liters per minute.
Be careful: if the input does not increase by \(1\), you still divide the change in output by the change in input. For instance, if a table shows that when \(x\) increases by \(4\), \(y\) increases by \(12\), the rate of change is \(\dfrac{12}{4} = 3\), not \(12\).
Suppose Function A is represented by the table below, and Function B is represented by the equation \(y = 2x + 5\). We want to determine which function has the greater rate of change.
| Input \(x\) | Output \(y\) |
|---|---|
| \(0\) | \(1\) |
| \(1\) | \(4\) |
| \(2\) | \(7\) |
| \(3\) | \(10\) |
Table 1. Values for Function A showing a constant change in output.
Worked example 1
Step 1: Find the rate of change of Function A from the table.
As \(x\) increases by \(1\), the outputs go \(1, 4, 7, 10\). The output increases by \(3\) each time, so the rate of change is \(3\).
Step 2: Find the rate of change of Function B from the equation.
In \(y = 2x + 5\), the coefficient of \(x\) is \(2\), so the rate of change is \(2\).
Step 3: Compare the rates.
Function A has rate of change \(3\), and Function B has rate of change \(2\).
\(3 > 2\)
Therefore, Function A has the greater rate of change.
This example shows that you do not need the functions in the same form. You just need to identify the same property in each representation and compare.
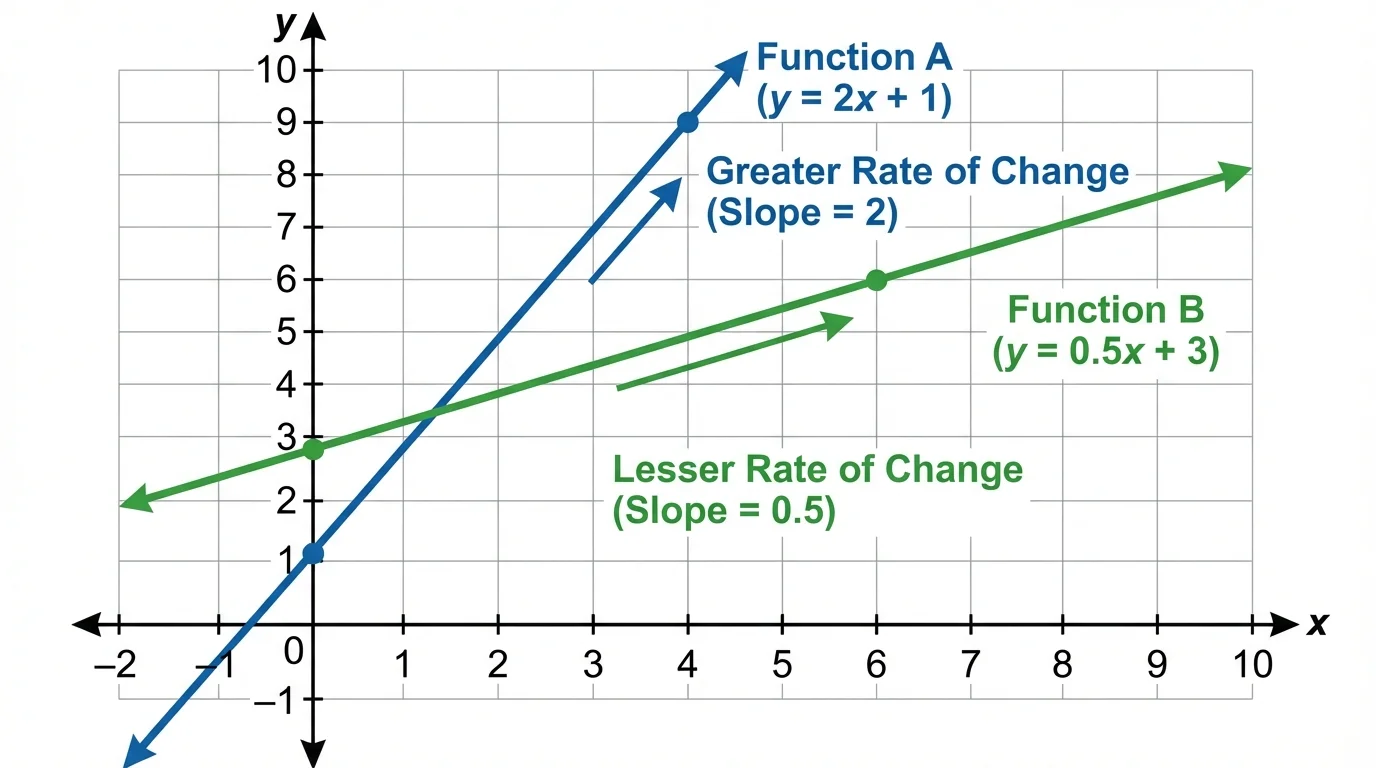
A line on a graph can be compared to a written rule in words, and [Figure 3] helps show that the important ideas are still slope and starting value. Suppose Function C is shown by a graph passing through the points \((0,1)\) and \((4,9)\). Function D is described as "starts at \(3\) and increases by \(1\) for every increase of \(1\) in \(x\)."
Worked example 2
Step 1: Find the rate of change of Function C from the graph points.
\[\frac{9-1}{4-0} = \frac{8}{4} = 2\]
So Function C has rate of change \(2\).
Step 2: Find the rate of change of Function D from the verbal description.
The description says the function increases by \(1\) for each increase of \(1\) in \(x\), so its rate of change is \(1\).
Step 3: Compare initial values.
Function C passes through \((0,1)\), so its initial value is \(1\). Function D starts at \(3\), so its initial value is \(3\).
Function C changes faster because \(2 > 1\), but Function D starts higher because \(3 > 1\).
This is an important result: one function can have the greater rate of change while the other has the greater initial value. Those are different properties, so they should not be confused.
Now compare Function E, given by \(y = -2x + 8\), and Function F, given by the verbal description "starts at \(10\) and decreases by \(1\) for every increase of \(1\) in \(x\)." Which function has the greater output when \(x = 3\)?
Worked example 3
Step 1: Evaluate Function E at \(x = 3\).
Substitute \(x = 3\) into \(y = -2x + 8\):
\[y = -2(3) + 8 = -6 + 8 = 2\]
So Function E gives output \(2\).
Step 2: Evaluate Function F at \(x = 3\).
Function F starts at \(10\) and decreases by \(1\) per step in \(x\). After \(3\) steps, the output is \(10 - 3 = 7\).
Step 3: Compare the outputs.
Function E gives \(2\), and Function F gives \(7\).
\(7 > 2\)
So Function F has the greater output when \(x = 3\).
Notice that this question is not asking which function changes faster overall. It is only asking which one is greater at one specific input.
Students often focus only on slope, but many comparison questions ask about where a function starts. The y-intercept is the graph point where \(x = 0\). For linear functions, this tells the initial value.
Here is a quick guide for finding initial value in each form:
| Representation | How to find the initial value |
|---|---|
| Equation \(y = mx + b\) | Look at \(b\) |
| Table | Find the output when \(x = 0\) |
| Graph | Find where the line crosses the \(y\)-axis |
| Verbal description | Look for the starting amount |
Table 2. Ways to locate the initial value in different function representations.
Suppose one function is given by \(y = 5x - 2\) and another by a table with \(x = 0\) giving \(y = 4\). The second function has the greater initial value because \(4 > -2\), even though the first function may have a different rate of change.
Many real systems are compared this way. Two phone battery graphs might start at different percentages, but one may drain faster. Comparing both the starting value and the rate of change gives a more complete picture.
Later, if you use the graph in [Figure 3] again, you can see this clearly: the steeper line has the greater rate of change, while the other line may still begin above it on the \(y\)-axis.
One common mistake is forgetting to divide by the change in input. If a table jumps from \(x = 1\) to \(x = 5\), the input changed by \(4\), not \(1\). You must compute \(\dfrac{\Delta y}{\Delta x}\).
Another mistake is confusing a larger initial value with a larger rate of change. A line can start higher and still grow more slowly. In fact, that happens often, as the comparison in [Figure 2] helps you remember: slope depends on steepness, not where the line crosses the axis.
A third mistake is reading the graph inaccurately. Always choose points that lie exactly on the line when possible. If the graph is unclear, use labeled points instead of guessing from the picture.
Negative rates of change
A greater rate of change does not always mean the line looks "bigger" in every way. Between \(-1\) and \(-4\), the greater rate of change is \(-1\) because \(-1 > -4\). A function with rate \(-1\) decreases more slowly than a function with rate \(-4\).
Also watch for the exact question being asked. If the question says "Which function has the greater rate of change?" you compare slopes. If it says "Which has the greater value when \(x = 2\)?" you evaluate or read each function at \(x = 2\).
Comparing functions appears in many real situations. A gym may offer two membership plans: one with a higher starting fee but lower monthly increase, and one with no starting fee but a higher monthly increase. To compare them, you identify the initial value and rate of change for each plan.
Travel is another example. One car's distance might be shown in a graph, while another car's distance is listed in a table. By comparing rates of change, you can tell which car is traveling faster. By comparing outputs at a certain time, you can tell which car has gone farther.
In science, temperature can be recorded in a table while another pattern is described verbally. In business, one company may model profit with an equation and another with a graph. The representation may change, but the comparison process stays the same.
"The form may change, but the relationship stays the same."
That idea is central to function thinking. When you compare functions, you are looking past the format and focusing on what the function actually does.