A company tracks delivery time against distance. A scientist tracks temperature over time. A streaming service tracks monthly cost based on the number of premium add-ons. These all look different on the surface, but they can often be described by the same mathematical idea: a line. When data follow a roughly straight-line pattern, the equation does more than draw a graph. It tells a story about how one quantity changes compared with another.
A linear model is used when the relationship between two variables is approximately straight when graphed. In many real situations, one quantity changes at a steady rate as another quantity changes. That steady pattern is exactly what a linear model is designed to represent.
For example, if a bike rental shop charges a fixed starting fee plus a certain amount for each hour, the total cost grows at a constant rate. If the fee is $8 to start and $5 per hour, then each additional hour adds the same amount. This is linear because the change is consistent.
Linear model means an equation, graph, or rule that represents a relationship with a constant rate of change. In a linear model, equal changes in the input produce equal changes in the output.
Slope is the rate of change in a linear relationship. It tells how much the output changes for each unit change in the input.
Intercept is the constant term in a linear model. It gives the value of the output when the input is zero.
Understanding these features lets you move beyond solving equations. You can explain what the numbers mean in the situation that produced the data. That is a big part of interpreting statistics and models: not just calculating, but making sense of the results.
A linear model is often written in slope-intercept form: \(y = mx + b\). Here, \(m\) is the slope and \(b\) is the intercept. Usually, the variable \(x\) represents the input or explanatory variable, and \(y\) represents the output or response variable.
If you know the equation, you can identify the rate of change and the starting value immediately. For instance, in \(y = 3x + 7\), the slope is \(3\), so \(y\) increases by \(3\) whenever \(x\) increases by \(1\). The intercept is \(7\), so when \(x = 0\), the value of \(y\) is \(7\).
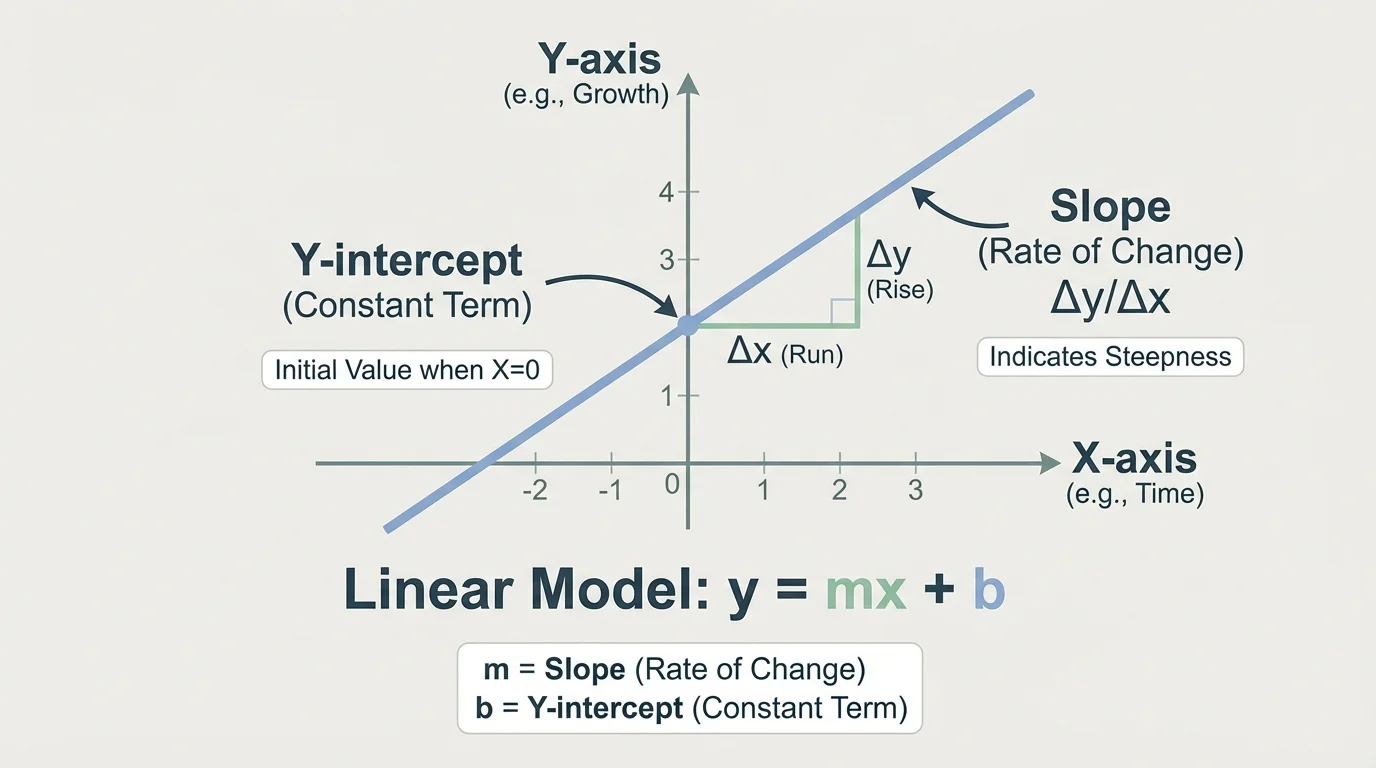
On a graph, the slope tells how steep the line is and whether it rises or falls from left to right. The intercept is where the line crosses the y-axis. In context, though, we need more than a visual description. We need to translate the numbers into meaning, with units.
Suppose \(x\) represents hours and \(y\) represents gallons of water in a tank. In the equation \(y = -4x + 50\), the slope \(-4\) means the tank loses \(4\) gallons every hour, and the intercept \(50\) means the tank starts with \(50\) gallons.
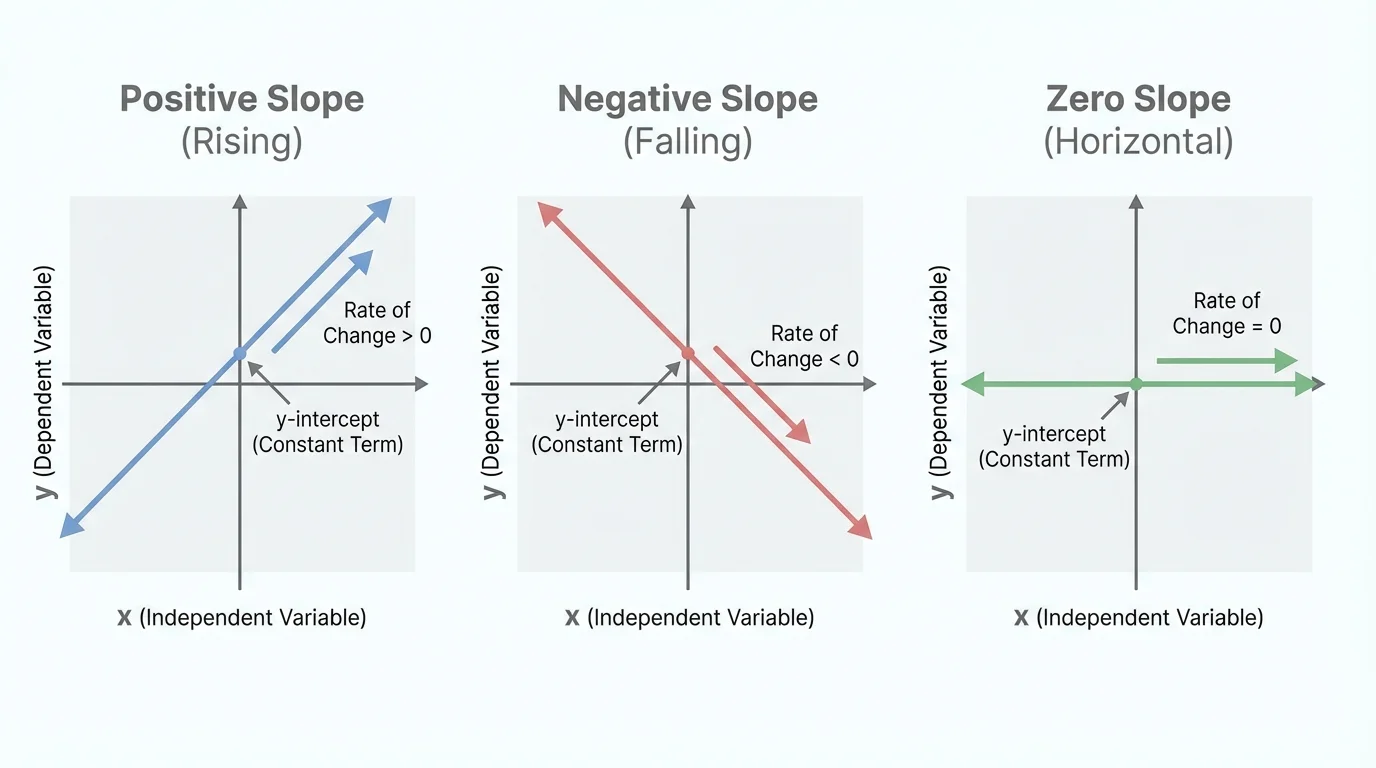
The rate of change is one of the most important ideas in algebra and data analysis. In a linear model, the slope gives that rate, and as [Figure 2] illustrates, it can be positive, negative, or zero. To interpret it correctly, include both the amount of change and the units.
Mathematically, slope can be written as \[m = \frac{\Delta y}{\Delta x}\] This means "change in \(y\) divided by change in \(x\)." If \(y\) is measured in dollars and \(x\) in hours, then the slope has units of dollars per hour. If \(y\) is temperature and \(x\) is time, then the slope may be degrees per minute.
A positive slope means the output increases as the input increases. A negative slope means the output decreases as the input increases. A slope of zero means the output stays constant even as the input changes.
For example, if a student earns points in a game according to \(P = 12t\), where \(t\) is time in minutes, then the slope is \(12\). That means the score increases by \(12\) points per minute. If a car's fuel level is modeled by \(F = -2.5d + 14\), where \(d\) is distance in miles, then the slope \(-2.5\) means the fuel decreases by \(2.5\) gallons for every mile, which would be unrealistic for a real car but still mathematically interpretable.
From earlier work with graphs, remember that slope is not just "rise over run" as a procedure. In data analysis, it represents a meaningful change in one variable compared with another, including units.
Context matters. A slope of \(5\) by itself tells very little. A slope of \(5\) dollars per ticket, \(5\) centimeters per second, or \(5\) degrees per hour tells much more. Good interpretation always names the quantities involved.
Also notice that in data situations, the slope may come from a line that fits the trend, not from every point exactly. Real data are often scattered. The slope still describes the general rate of change predicted by the model.
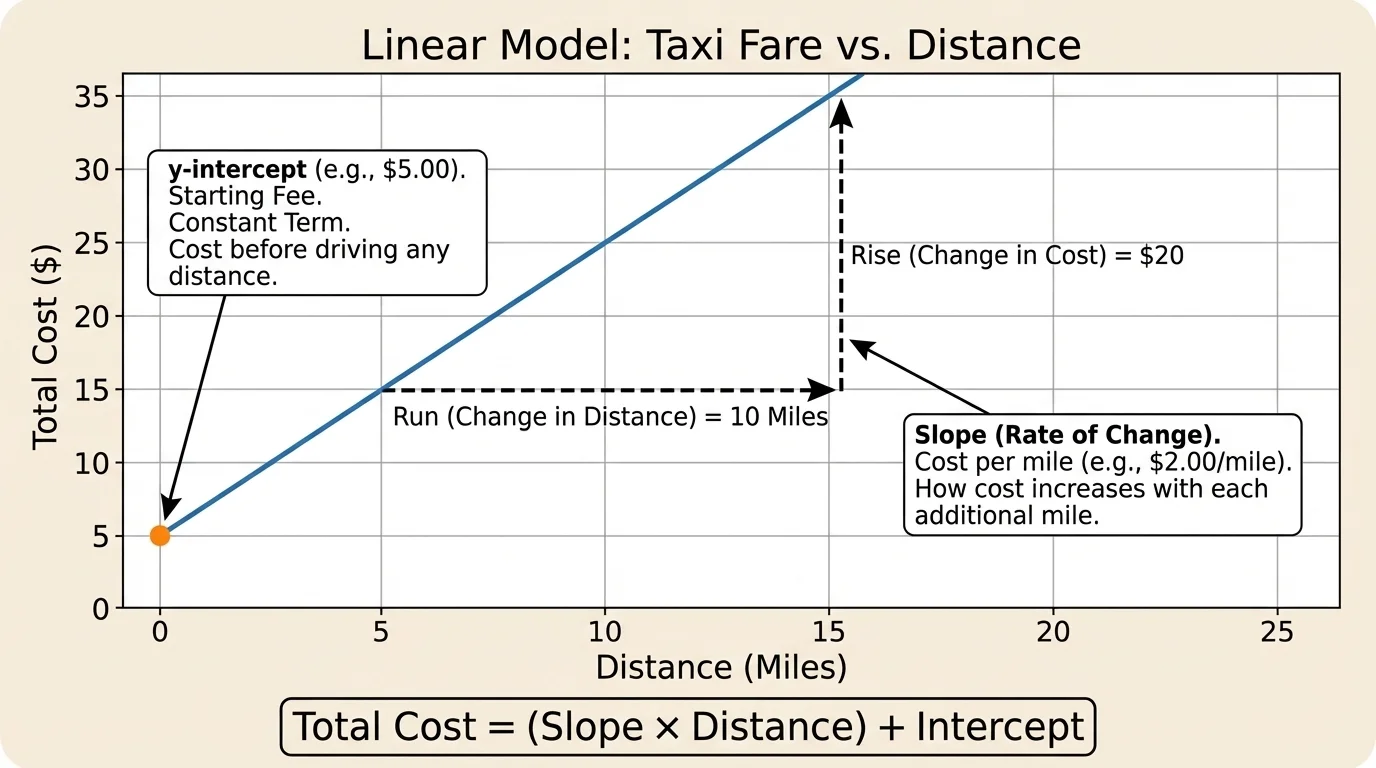
The intercept, often called the y-intercept, is the value of \(y\) when \(x = 0\). In many situations, it represents the initial amount, starting value, or fixed fee. A taxi example makes this especially clear by linking the graph to a real situation.
If a taxi fare is modeled by \(C = 2.75x + 4\), where \(x\) is miles traveled and \(C\) is total cost in dollars, then the intercept is \(4\). This means that even before traveling any miles, the ride already costs $4. That is the starting charge.
In other contexts, the intercept could mean a starting temperature, an initial population, or a fixed amount already in an account. For example, if \(S = 150 + 20w\), where \(S\) is savings in dollars after \(w\) weeks, then \(150\) is the amount already saved at week \(0\).
However, the intercept does not always make practical sense. Suppose a model relates a person's shoe size to height. The intercept would tell the predicted height when shoe size is \(0\). Mathematically, that is part of the line, but in real life it is not meaningful because shoe size \(0\) is outside the useful data range for the people being studied.
When an intercept is meaningful
The intercept is meaningful when \(x = 0\) is a realistic input in the situation. If the model describes cost at \(0\) items, distance at \(0\) time, or amount at the starting moment, the intercept usually has a clear interpretation. If \(x = 0\) is impossible or far outside the observed data, the intercept may exist mathematically but not have useful real-world meaning.
This idea is important because interpreting a model is not just about identifying numbers. It is about deciding whether those numbers say something reasonable about the actual context.
Sometimes the model is given directly as an equation. Other times, you must read it from a graph or from a line of best fit. In data analysis, a scatter plot may not show all points on one exact line, but a trend line can still summarize the relationship.
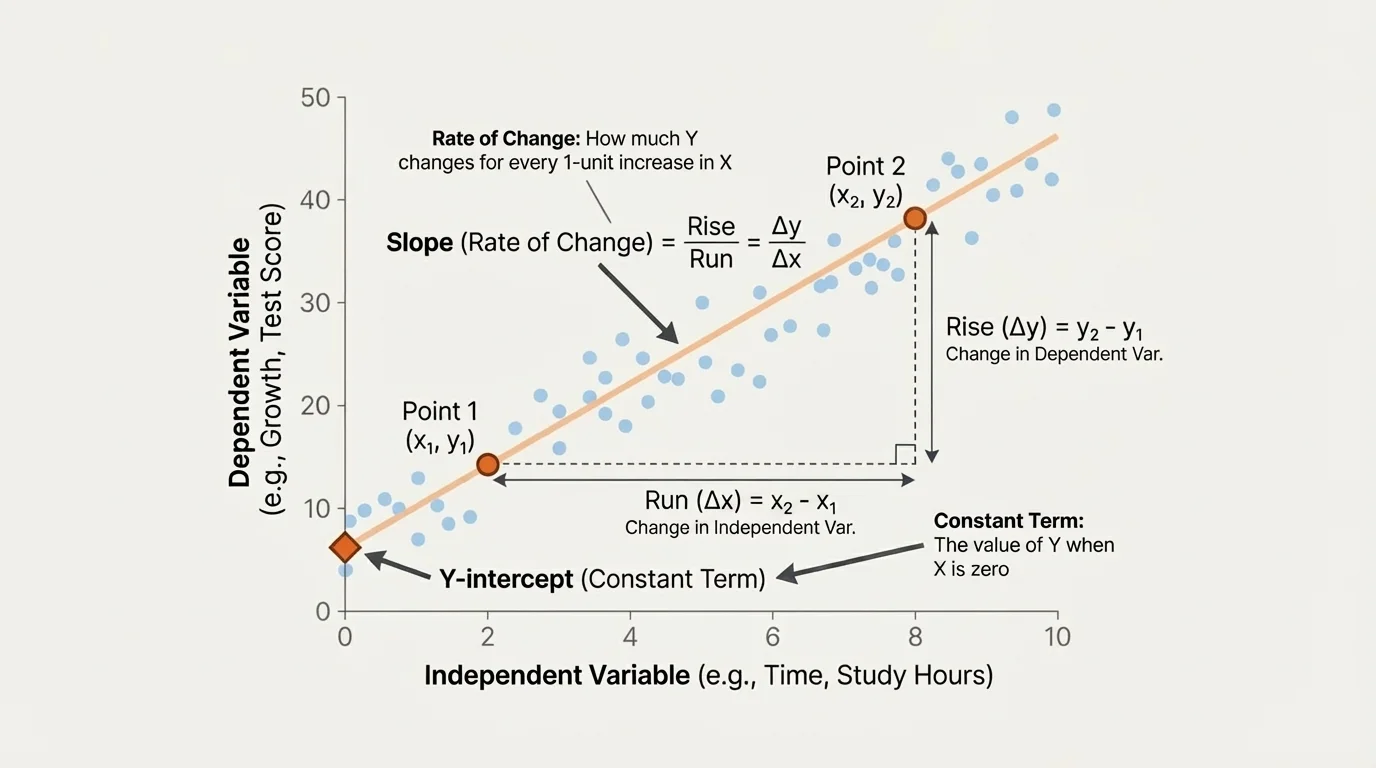
If you know two points on a line, you can find the slope using \[m = \frac{y_2 - y_1}{x_2 - x_1}\] After finding the slope, you can use one point to write the equation and identify the intercept.
For example, suppose a line passes through \((2, 10)\) and \((6, 22)\). The slope is \(\dfrac{22 - 10}{6 - 2} = \dfrac{12}{4} = 3\). That means \(y\) increases by \(3\) units for each increase of \(1\) in \(x\). If you substitute one point into \(y = 3x + b\), then \(10 = 3(2) + b\), so \(10 = 6 + b\), and \(b = 4\). The model is \(y = 3x + 4\).
On a graph, the intercept is the point where the line crosses the y-axis. If that point is \((0, 4)\), then the intercept is \(4\). If the line of best fit is only approximate, the intercept may be estimated from the graph rather than read exactly.
| Model feature | What to look for | Meaning in context |
|---|---|---|
| Slope | Coefficient of \(x\), or rise over run | How much the output changes for each unit of input |
| Intercept | Constant term, or where the line crosses the vertical axis | Output value when input is \(0\) |
| Positive slope | Line rises left to right | Output increases as input increases |
| Negative slope | Line falls left to right | Output decreases as input increases |
| Zero slope | Horizontal line | Output stays constant |
Table 1. Key features used to interpret a linear model from an equation or graph.
These examples show how to move from a model to a verbal interpretation. Each interpretation should mention the quantities involved and the units when possible.
Worked example 1: Taxi fare model
A taxi company models total fare by \(C = 2.5m + 3.75\), where \(m\) is miles and \(C\) is cost in dollars. Interpret the slope and intercept.
Step 1: Identify the slope and intercept.
In \(C = 2.5m + 3.75\), the slope is \(2.5\) and the intercept is \(3.75\).
Step 2: Interpret the slope.
The slope \(2.5\) means the fare increases by $2.50 for each additional mile traveled.
Step 3: Interpret the intercept.
The intercept \(3.75\) means the fare is $3.75 when \(m = 0\). This is the starting fee before any miles are traveled.
The model says the ride begins at $3.75 and then increases by $2.50 per mile.
Notice how the slope describes change and the intercept describes a starting amount. This same structure appears in many business and transportation models.
Worked example 2: Cooling soup
A bowl of soup cools according to the model \(T = -1.8t + 82\), where \(T\) is temperature in degrees Celsius and \(t\) is time in minutes. Interpret the slope and intercept.
Step 1: Identify the model parts.
The slope is \(-1.8\), and the intercept is \(82\).
Step 2: Interpret the slope with units.
The slope \(-1.8\) means the soup's temperature decreases by \(1.8\) degrees Celsius each minute.
Step 3: Interpret the intercept.
The intercept \(82\) means that at time \(0\), the soup starts at \(82\) degrees Celsius.
The negative slope is important: it tells us the quantity is going down over time, not up.
Negative slopes often appear in situations involving cooling, fuel use, depreciation, or anything being used up or reduced.
Worked example 3: Finding and interpreting a model from two points
A school store records that when it sells \(10\) notebooks, revenue is $25, and when it sells \(30\) notebooks, revenue is $65. Assume a linear model. Find the equation and interpret the slope and intercept.
Step 1: Find the slope.
Use the points \((10, 25)\) and \((30, 65)\):
\(m = \dfrac{65 - 25}{30 - 10} = \dfrac{40}{20} = 2\).
Step 2: Write the equation.
Use \(y = mx + b\) with slope \(2\). Substitute \((10, 25)\): \(25 = 2(10) + b\), so \(25 = 20 + b\), and \(b = 5\).
The equation is \(y = 2x + 5\), where \(x\) is notebooks sold and \(y\) is revenue in dollars.
Step 3: Interpret the slope and intercept.
The slope \(2\) means revenue increases by $2 for each notebook sold. The intercept \(5\) means revenue would be $5 when \(0\) notebooks are sold.
That intercept may suggest an initial amount already counted, such as a fee or some fixed revenue source. If the context does not support that, then the intercept may not be meaningful even though it is part of the algebraic model.
When interpreting a model built from data, always ask whether each result makes sense in the situation. Algebra gives the numbers, but context gives them meaning.
One common mistake is giving the slope without units. Saying "the slope is \(4\)" is incomplete. Better interpretations sound like "the cost increases by $4 per ticket" or "the plant grows \(4\) centimeters per week."
Another mistake is confusing slope and intercept. In \(y = 7x + 12\), the slope is \(7\), not \(12\). The intercept is \(12\), meaning the value when \(x = 0\).
A third mistake is interpreting the intercept when \(x = 0\) is outside the data range or unrealistic. As we saw earlier with the taxi example, some intercepts represent real starting values, but others are only mathematical artifacts of the line.
Some of the most useful linear models in science are only valid for a limited interval. A model can fit data very well between certain values of \(x\), but outside that interval its predictions may become unreasonable.
This leads to the idea of extrapolation, which means using a model to predict beyond the range of the observed data. Extrapolation can be useful, but it is risky because the pattern may not continue. A linear trend that works for the first \(10\) days may fail completely by day \(100\).
By contrast, interpolation means predicting within the data range. Interpreting slope and intercept is usually most reliable when the model is used near the data that created it.
Linear models appear everywhere. In economics, a company may model total cost as fixed cost plus cost per item. The slope gives the additional cost for each item produced, and the intercept gives the fixed startup cost. In engineering, a graph of distance versus time may have a slope representing speed. In environmental science, a model of water level versus time may have a slope representing rise or decline per hour.
Sports also use these ideas. If a runner's distance is modeled against time, the slope describes average speed. If a basketball team tracks ticket revenue by tickets sold, the slope estimates revenue per ticket, while the intercept may represent money from advance fees or memberships.
In medical research, a line fitted to dosage and response can estimate how much change in response occurs per unit of medicine. In chemistry and physics, experimental measurements often produce data that are nearly linear over a certain range. The slope then represents a physical constant or rate, while the intercept may represent an initial condition or background amount.
Even when the points do not form a perfect line, a best-fit line can still be useful. The scatter plot and trend in [Figure 4] show how a model can summarize overall behavior without matching every single data point exactly.
The power of a linear model is not just that it predicts values. It helps explain how quantities are connected. Slope tells the speed, growth, decrease, or cost-per-unit. Intercept tells the starting point, fixed fee, or baseline amount. Together they turn a graph or equation into a meaningful description of the world.