If you are told that a randomly chosen student plays basketball with probability \(0.40\) and is in band with probability \(0.25\), you might be tempted to say the probability a student does either one is \(0.65\). But what if some students do both? That single question is the reason the addition rule matters. In probability, the word or often includes overlap, and if you ignore that overlap, you count some outcomes twice.
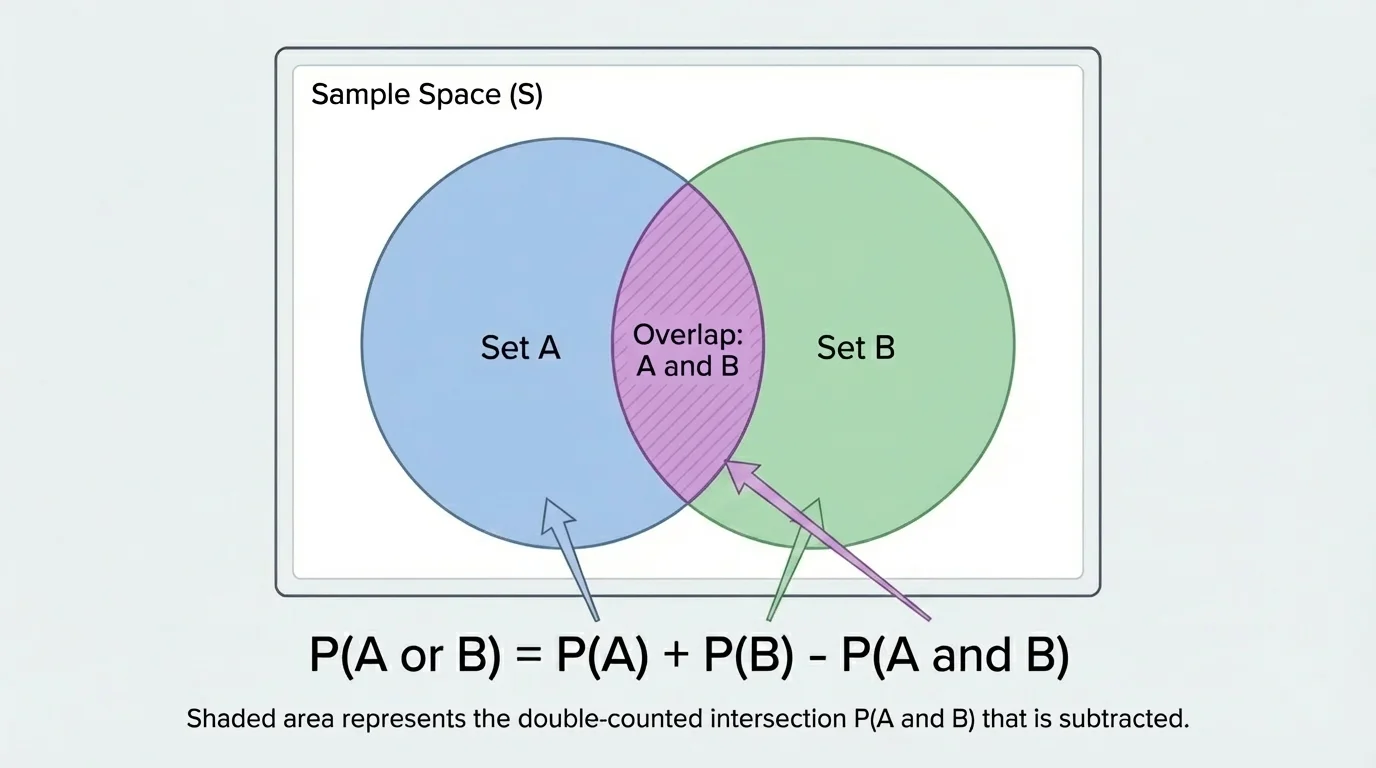
When we want the probability of event \(A\) or event \(B\), we are looking for outcomes that belong to at least one of the two events. That includes outcomes in \(A\) only, outcomes in \(B\) only, and outcomes in both. The overlap matters, as [Figure 1] shows, because adding \(P(A)\) and \(P(B)\) by themselves counts the shared part twice.
For example, if an outcome is in both \(A\) and \(B\), it appears once when counting event \(A\) and again when counting event \(B\). To fix that double-counting, we subtract the probability of the overlap, written as \(P(A \textrm{ and } B)\).
This idea is one of the most important rules of probability because many real situations involve categories that overlap: students can play sports and join clubs, a card can be a heart and a face card, and a patient can show two symptoms at once.
Event is a set of outcomes from a probability experiment.
Union means the event \(A \textrm{ or } B\): outcomes in \(A\), in \(B\), or in both.
Intersection means the event \(A \textrm{ and } B\): outcomes shared by both events.
Mutually exclusive events are events that cannot happen at the same time, so \(P(A \textrm{ and } B) = 0\).
In a uniform probability model, every outcome is equally likely. That makes probability easier to compute because we can count outcomes instead of estimating likelihoods. If there are \(n\) equally likely outcomes and \(k\) favorable ones, then the probability is \(\dfrac{k}{n}\).
The addition rule for any two events \(A\) and \(B\) is
\[P(A \textrm{ or } B) = P(A) + P(B) - P(A \textrm{ and } B)\]
This formula works whether the events overlap a lot, overlap a little, or do not overlap at all. The subtraction is not optional; it is what makes the count accurate.
You may also see the notation \(P(A \cup B)\) for \(P(A \textrm{ or } B)\) and \(P(A \cap B)\) for \(P(A \textrm{ and } B)\). The symbols \(\cup\) and \(\cap\) come from set notation, which is closely connected to probability.
Why the formula works
Suppose you count all outcomes in event \(A\), then count all outcomes in event \(B\). Any outcome that belongs to both sets gets counted twice. Subtracting \(P(A \textrm{ and } B)\) removes that extra count exactly once, leaving every desired outcome counted one time.
Notice that in everyday language, "or" sometimes means one choice or the other, but in probability it usually means inclusive or: event \(A\), event \(B\), or both. That difference is a common source of mistakes.
In a model with equally likely outcomes, you can often see the addition rule directly. Each outcome belongs to one of four groups: in \(A\) only, in \(B\) only, in both, or in neither. That classification, illustrated by [Figure 2], helps you count the union without missing or repeating outcomes.
Suppose a spinner has \(8\) equal sections labeled \(1\) through \(8\). Let event \(A\) be "spin an even number," and let event \(B\) be "spin a number greater than \(4\)." Because all \(8\) outcomes are equally likely, probabilities come from counts out of \(8\).
Event \(A\) has outcomes \(2,4,6,8\), so \(P(A) = \dfrac{4}{8}\). Event \(B\) has outcomes \(5,6,7,8\), so \(P(B) = \dfrac{4}{8}\). The overlap has outcomes \(6,8\), so \(P(A \textrm{ and } B) = \dfrac{2}{8}\). Then \(P(A \textrm{ or } B) = \dfrac{4}{8} + \dfrac{4}{8} - \dfrac{2}{8} = \dfrac{6}{8} = \dfrac{3}{4}\).
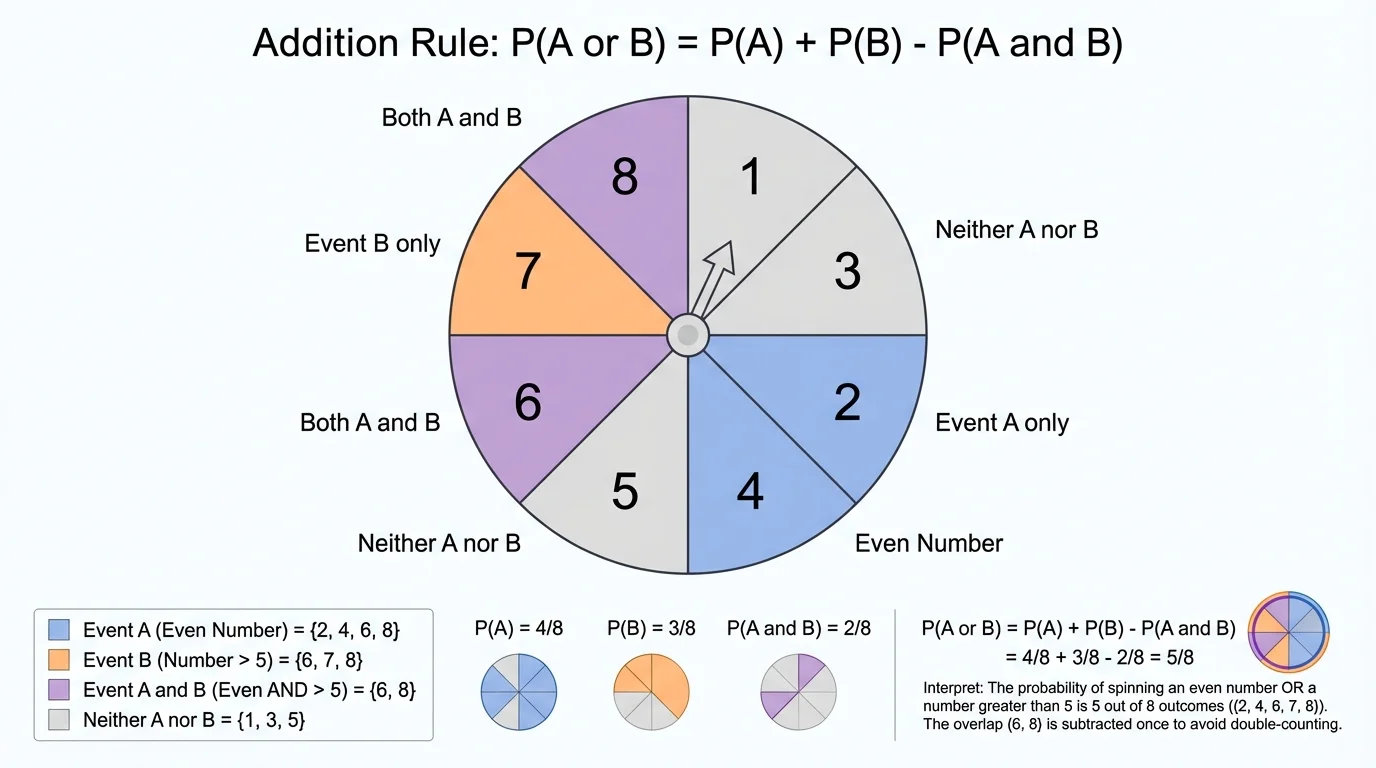
This answer means that in the spinner model, \(6\) of the \(8\) equally likely outcomes satisfy at least one of the two conditions.
When outcomes are equally likely, probability is found by counting: \(P(\textrm{event}) = \dfrac{\textrm{number of favorable outcomes}}{\textrm{total number of outcomes}}\). The addition rule does not replace counting; it helps organize counting when two events overlap.
Whether you work with a list, table, spinner, or deck of cards, the key question is always the same: which outcomes are in event \(A\), which are in event \(B\), and which are in both?
A standard number cube has outcomes \(1,2,3,4,5,6\). Let event \(A\) be "roll a multiple of \(2\)," and let event \(B\) be "roll a number greater than \(3\)." We want \(P(A \textrm{ or } B)\).
Worked example 1
Step 1: List the outcomes in each event.
Event \(A = \{2,4,6\}\) because the multiples of \(2\) are \(2,4,6\).
Event \(B = \{4,5,6\}\) because the numbers greater than \(3\) are \(4,5,6\).
Step 2: Find the overlap.
The outcomes in both events are \(\{4,6\}\), so \(P(A \textrm{ and } B) = \dfrac{2}{6}\).
Step 3: Apply the addition rule.
Since \(P(A) = \dfrac{3}{6}\) and \(P(B) = \dfrac{3}{6}\),
\[P(A \textrm{ or } B) = \frac{3}{6} + \frac{3}{6} - \frac{2}{6} = \frac{4}{6} = \frac{2}{3}\]
The probability is \(\dfrac{2}{3}\).
To interpret the result in terms of the model, \(\dfrac{2}{3}\) means that if the number cube is fair, then two out of every three rolls, on average, should be either a multiple of \(2\), greater than \(3\), or both.
[Figure 3] Cards are a classic probability model because each card in a well-shuffled deck is equally likely. In a standard deck of \(52\) cards, let event \(A\) be "draw a heart," and let event \(B\) be "draw a face card." The overlap between these categories is the heart cards that are also face cards.
A heart is any one of the \(13\) cards in the hearts suit. A face card is a jack, queen, or king, so there are \(12\) face cards in total. The overlap consists of the jack of hearts, queen of hearts, and king of hearts, which gives \(3\) cards in both events.
Worked example 2
Step 1: Write each probability.
\(P(A) = \dfrac{13}{52}\), \(P(B) = \dfrac{12}{52}\), and \(P(A \textrm{ and } B) = \dfrac{3}{52}\).
Step 2: Apply the addition rule.
\[P(A \textrm{ or } B) = \frac{13}{52} + \frac{12}{52} - \frac{3}{52} = \frac{22}{52} = \frac{11}{26}\]
The probability is \(\dfrac{11}{26}\).
This means that if one card is chosen at random, the chance of getting a heart or a face card is \(\dfrac{11}{26}\). In terms of actual outcomes, there are \(22\) favorable cards out of \(52\): all hearts plus all face cards, but counting the three heart face cards only once.
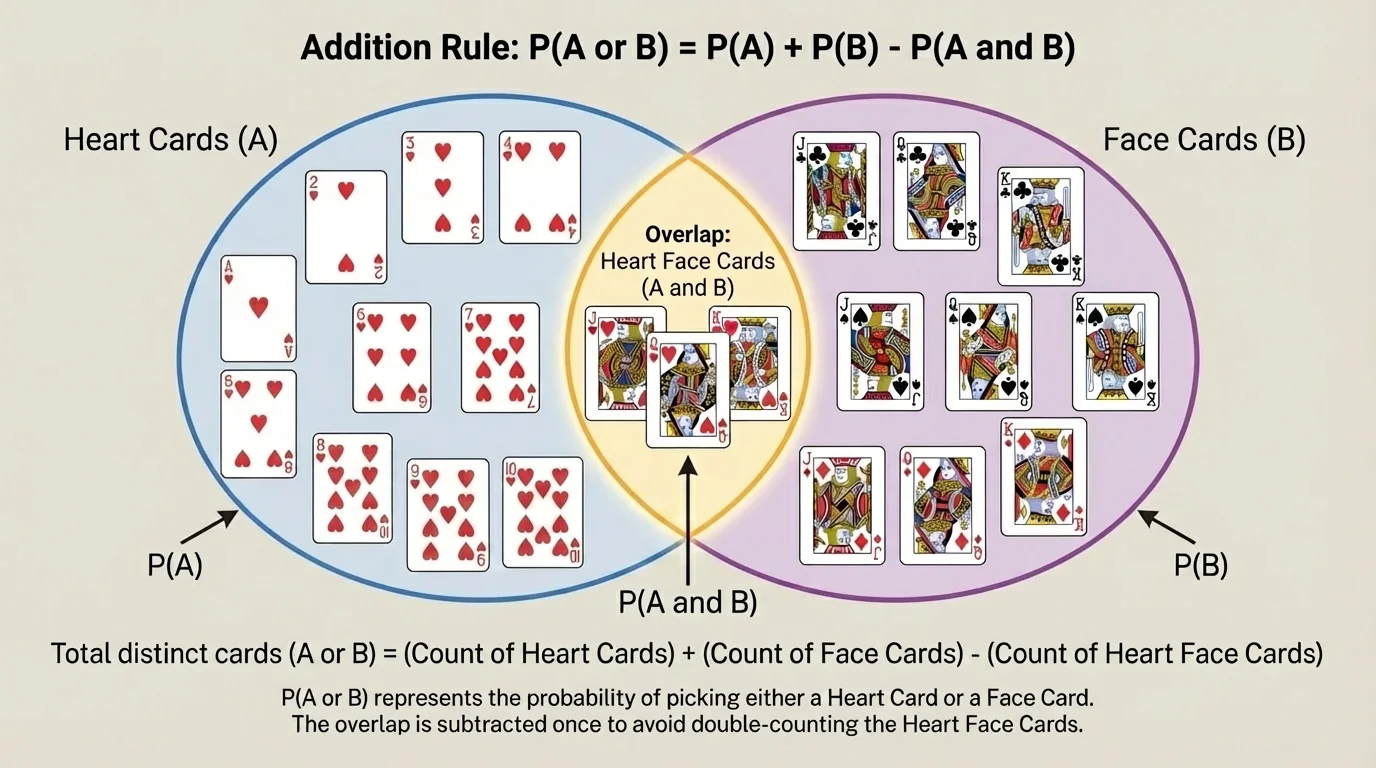
Later, if you compare this to the Venn diagram idea in [Figure 1], you can see exactly why subtracting \(\dfrac{3}{52}\) is necessary. Without that subtraction, the three heart face cards would be counted twice.
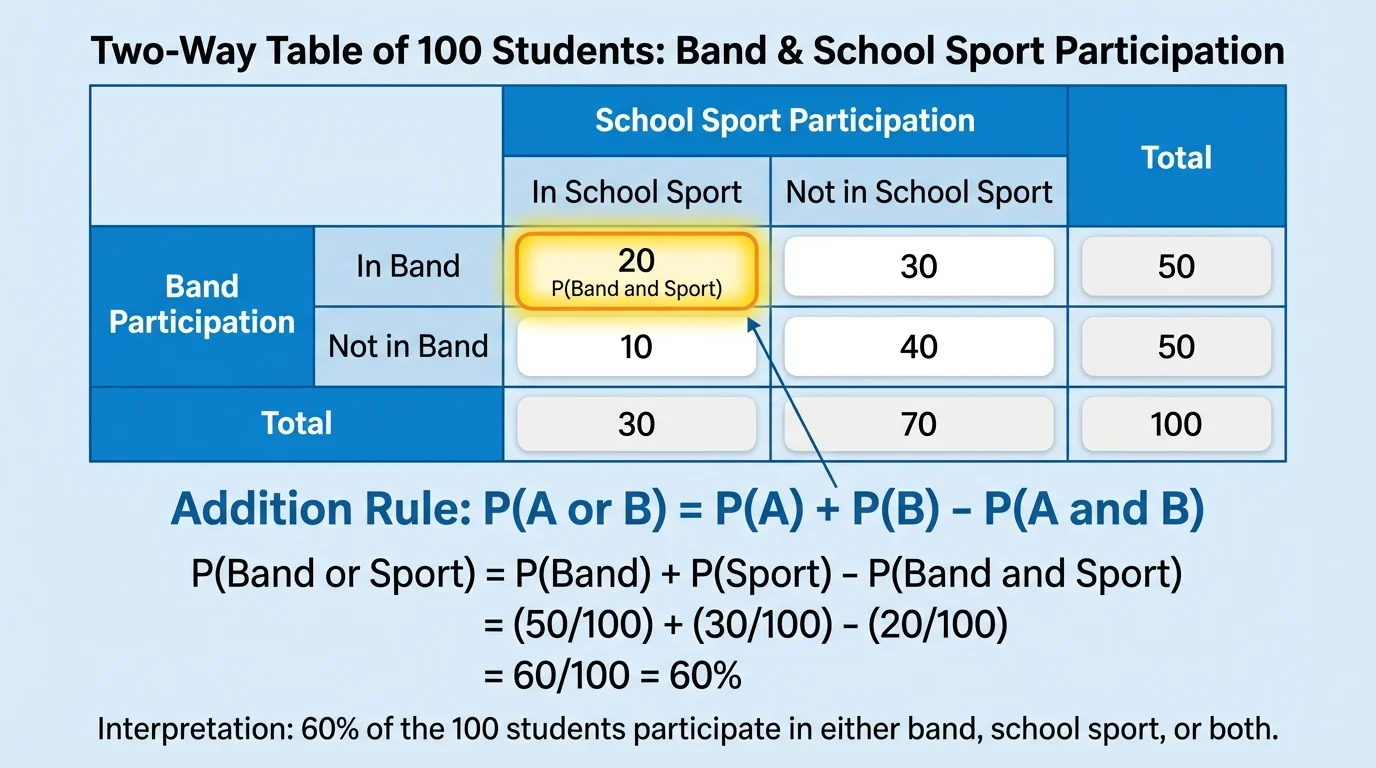
Probability is not limited to dice and cards. It also applies to data models. Suppose a school surveys \(100\) students. Event \(A\) is "student is in band," and event \(B\) is "student plays a school sport." The survey table, summarized in [Figure 4], reveals how many students belong to both groups.
Assume the data show that \(35\) students are in band, \(50\) play a school sport, and \(20\) do both. If one student is chosen at random from the surveyed group, what is the probability that the student is in band or plays a school sport?
Worked example 3
Step 1: Convert the counts to probabilities.
Because there are \(100\) students, \(P(A) = \dfrac{35}{100}\), \(P(B) = \dfrac{50}{100}\), and \(P(A \textrm{ and } B) = \dfrac{20}{100}\).
Step 2: Use the addition rule.
\[P(A \textrm{ or } B) = \frac{35}{100} + \frac{50}{100} - \frac{20}{100} = \frac{65}{100} = 0.65\]
Step 3: Interpret the result.
The probability is \(0.65\), which means there is a \(65\%\) chance that a randomly selected student from this group is in at least one of the two activities.
Another way to understand the same answer is by counting students directly: \(35 + 50 = 85\), but that total counts the \(20\) students who do both twice. So the actual number in band or sports is \(85 - 20 = 65\), giving \(\dfrac{65}{100}\).
This kind of model appears often in surveys, public health data, and school reports. The addition rule helps turn overlapping categories into a correct probability.
Some events cannot happen together. These are called mutually exclusive events. If a fair die is rolled, the events "roll a \(2\)" and "roll a \(5\)" are mutually exclusive because one roll cannot be both numbers.
When events are mutually exclusive, the intersection has probability \(0\). So the addition rule becomes
\[P(A \textrm{ or } B) = P(A) + P(B)\]
For instance, if \(A\) is "roll a \(1\)" and \(B\) is "roll a \(6\)," then \(P(A) = \dfrac{1}{6}\), \(P(B) = \dfrac{1}{6}\), and \(P(A \textrm{ and } B) = 0\). Therefore, \(P(A \textrm{ or } B) = \dfrac{2}{6} = \dfrac{1}{3}\).
Many student errors happen because they assume events are mutually exclusive when they are not. In real data sets, categories often overlap more than people first expect.
A quick test is to ask, "Can both happen at once?" If the answer is yes, then you must consider the overlap. If the answer is no, then the events are mutually exclusive.
One common mistake is adding probabilities without checking whether the events overlap. If they do overlap, then the answer will be too large because the shared outcomes are counted twice.
Another common mistake is confusing "and" with "or." The probability \(P(A \textrm{ and } B)\) refers only to the overlap, while \(P(A \textrm{ or } B)\) includes everything in either event. In the visual model from [Figure 1], the intersection is just the shared region, but the union is the entire area covered by both circles.
A third mistake is giving a numerical answer without interpreting it. In probability, the calculation is only part of the job. You should also explain what the result means in terms of the model: cards, students, spinner sections, or other outcomes.
| Situation | Correct approach |
|---|---|
| Events overlap | Use \(P(A \textrm{ or } B) = P(A) + P(B) - P(A \textrm{ and } B)\) |
| Events are mutually exclusive | Use \(P(A \textrm{ or } B) = P(A) + P(B)\) |
| Uniform model | Count favorable outcomes and divide by total outcomes |
| Need interpretation | State what the probability means in the original context |
Table 1. A comparison of common probability situations and the correct method to use.
The addition rule appears in many fields beyond the classroom. In sports analytics, a team may track the probability that a player gets a hit or draws a walk. In medicine, researchers may study the probability that a patient has a symptom or a risk factor, while recognizing that some patients have both. In manufacturing, quality control teams might calculate the probability that a product has defect \(A\) or defect \(B\), with some items showing both defects.
Even digital platforms use similar thinking. A streaming service may study the probability that a viewer likes action movies or science fiction. Some viewers fit both categories, so the overlap must be accounted for to avoid overstating audience size.
Interpreting the answer in context
A probability answer should connect back to the model. If the probability is \(\dfrac{11}{26}\) for drawing a heart or a face card, that means \(11\) out of every \(26\) equally likely selections would satisfy the condition in the long run. If the probability is \(0.65\) in a school survey, it means \(65\%\) of the surveyed students belong to at least one of the categories.
Interpretation also helps you check whether an answer makes sense. If you get a probability greater than \(1\), something has gone wrong. Very often, the problem is that the overlap was not subtracted.
Suppose a probability model gives \(P(A) = 0.6\), \(P(B) = 0.5\), and \(P(A \textrm{ and } B) = 0.3\). Then \(P(A \textrm{ or } B) = 0.6 + 0.5 - 0.3 = 0.8\). That result does not just mean "the answer is \(0.8\)." It means that in the model, \(80\%\) of all outcomes are in event \(A\), event \(B\), or both.
In a uniform model, you can often translate the same answer into a count. If there are \(40\) equally likely outcomes and \(P(A \textrm{ or } B) = \dfrac{32}{40}\), then \(32\) outcomes satisfy at least one of the conditions. That count-based interpretation is especially helpful in checking your work.
As seen earlier with the survey table in [Figure 4], interpretation is strongest when it names the actual groups involved. Instead of saying "the probability is \(0.65\)," say "a randomly selected student has a \(65\%\) chance of being in band or sports."
"Good probability work is not just correct arithmetic; it is correct counting."
That idea captures the heart of the addition rule. The formula is really a careful way of counting outcomes when categories overlap.