A headline says a new study found a "significant improvement" in student scores. Another says a sports drink had a "statistically significant effect" on performance. Those phrases sound impressive, but they do not automatically mean the effect was big, useful, or even relevant to everyday life. In statistics, the word significant has a precise meaning, and learning to evaluate that meaning is one of the most powerful tools for reading reports carefully instead of just accepting bold claims.
When researchers collect data, they usually want to learn something about a larger group from a smaller sample. They may compare treatments in an experiment, measure opinions in a survey, or look for patterns in an observational study. Good reports use data to justify conclusions. Weak reports often overstate what the data can really prove.
To judge a report well, you need two separate questions. First, is the result unlikely to have happened just by random chance? That is the idea of statistical significance. Second, is the result large enough to matter in real life? That is the idea of practical significance. A strong evaluation always considers both.
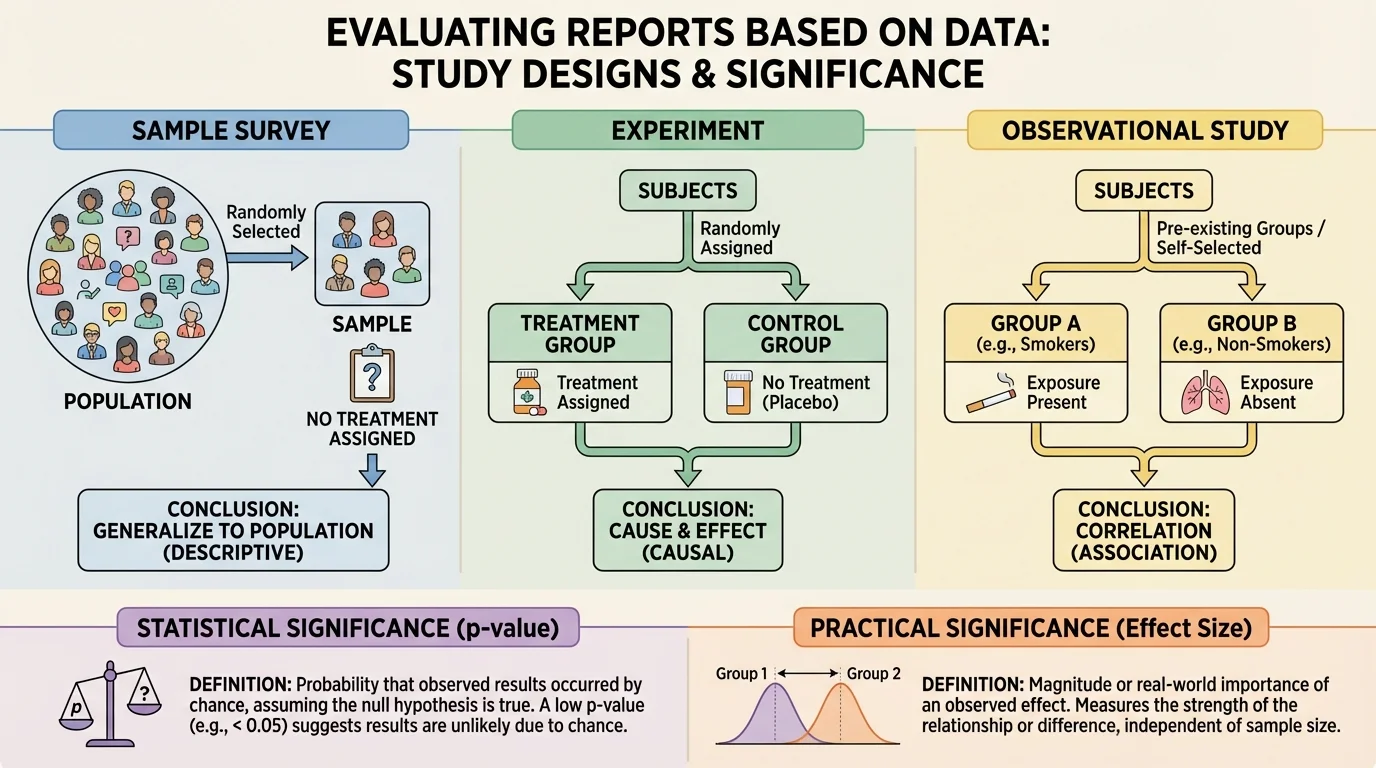
Before interpreting any result, it is important to know how the data were collected. Different study designs support different conclusions, as [Figure 1] illustrates by comparing surveys, experiments, and observational studies. If the design is weak, even a mathematically impressive result may not justify a strong claim.
A sample survey gathers information from part of a population to estimate characteristics of the whole population.
An experiment applies a treatment to some subjects and compares outcomes, often using random assignment.
Observational study records existing conditions or behaviors without assigning treatments.
In a sample survey, researchers might ask 500 students how many hours they sleep each night. If the sample is random and representative, the results can help estimate sleep habits of the larger student population. But a survey does not prove cause and effect. If students who sleep more also get higher grades, the survey shows an association, not proof that extra sleep caused those grades.
In an experiment, researchers actively assign treatments. For example, one group of plants might receive fertilizer while another does not. If subjects are randomly assigned, experiments are the best way to test cause and effect because random assignment helps balance other variables.
In an observational study, researchers only observe. They might compare the health outcomes of people who choose different diets. This can reveal useful patterns, but hidden variables, called confounding variables, may affect the results. For instance, people who choose one diet may also exercise more or have better access to health care.
When you read a report, your first task is to ask what kind of study it describes. That question shapes how strong the conclusion can be.
In everyday language, significant often means important. In statistics, that is only part of the story. A result can be statistically significant without being practically important. This difference is one of the most common sources of confusion in news reports and online articles.
Statistical significance asks whether the data provide strong evidence against a claim of no effect or no difference. This usually begins with a null hypothesis, which says that there is no real difference, no treatment effect, or no association beyond chance.
For example, suppose a company claims its new app increases users' typing speed. The null hypothesis would say that the app makes no difference and any observed improvement is just random variation. Researchers then collect sample data and ask how surprising those data would be if the null hypothesis were true.
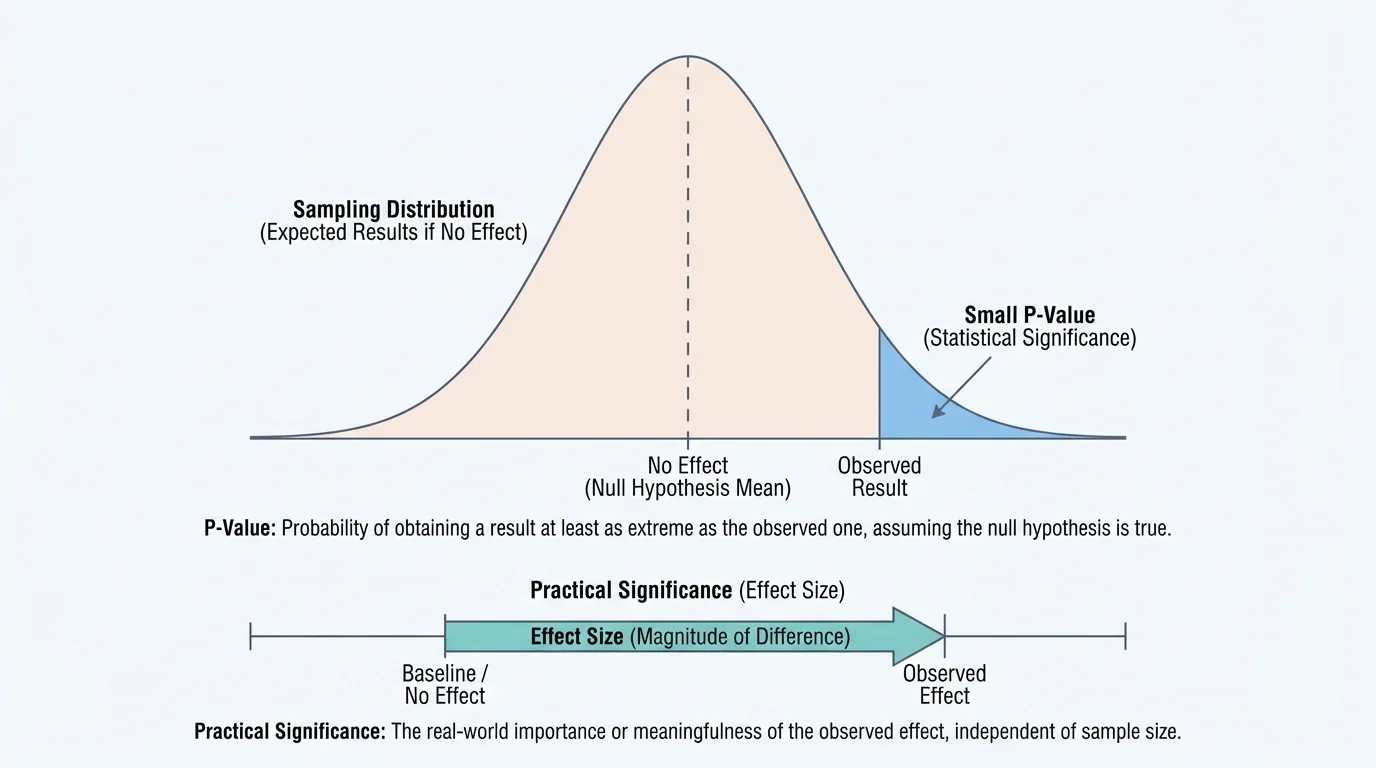
That is where the p-value comes in. The p-value is the probability of obtaining a result at least as extreme as the one observed, assuming the null hypothesis is true. A small p-value means the observed result would be unusual if there were really no effect.
Two meanings of significance
Statistical significance is about evidence. It tells you whether the data are strong enough to make chance alone seem unlikely as an explanation. Practical significance is about impact. It tells you whether the size of the effect is large enough to matter in a real setting. Good decision-making requires both.
[Figure 2] Researchers often use a cutoff such as \(p < 0.05\). If the p-value is less than \(0.05\), they call the result statistically significant. This means the observed result, or one more extreme, would occur less than \(5\%\) of the time under the no-effect assumption. But this threshold is a convention, not a magic line between truth and falsehood.
A useful way to think about a p-value is that it measures surprise under the no-effect model, with an observed result far out in the tail of a distribution. The farther into the tail the result falls, the smaller the p-value and the stronger the evidence against the null hypothesis.
Suppose a school usually has an average test score of \(70\). A class uses a new study program and scores an average of \(74\). Is that improvement real, or could it happen just by random variation? Statistical testing helps answer that question. If the p-value is very small, the observed increase looks too unusual to blame on chance alone.
Small p-values mean the data are less expected if the null hypothesis is true. Large p-values mean the data are fairly consistent with random variation. However, a p-value does not tell you the probability that the null hypothesis is true. It also does not tell you how large or important the effect is.
Students often mix up these ideas. Saying "the p-value is \(0.03\)" does not mean there is a \(3\%\) chance the result is false. It means that if there were actually no effect, a result this extreme or more extreme would happen about \(3\%\) of the time because of random sampling variation.
Another major factor is sample size. With a very large sample, even a tiny difference can produce a small p-value. With a small sample, an effect that really matters may fail to reach statistical significance because there is too much uncertainty. This is why p-values should never be read alone.
Variability matters too. If the data are spread out a lot, it is harder to detect a true effect. If the data are tightly clustered, the same average difference may look more convincing. Reports that mention significance but ignore spread, sample size, or study design leave out important context.
Medical studies sometimes find statistically significant effects so small that doctors do not change treatment recommendations. A drug can beat a placebo by a tiny amount in a large study and still not make much difference for real patients.
Later, when you compare studies, remember this key idea: statistical significance depends on where the observed result falls relative to what random chance would usually produce under the no-effect model, not on whether the effect is automatically important.
Now consider the second question: even if a result is statistically convincing, is it big enough to matter? This is where effect size becomes essential. Effect size describes how large the difference, relationship, or change actually is, and [Figure 3] makes clear that two statistically significant results can have very different magnitudes.
Suppose a reading program increases average test scores from \(78\) to \(78.5\). If the study includes thousands of students, that tiny increase might be statistically significant. But half a point may not be educationally meaningful. On the other hand, a program that raises scores from \(78\) to \(84\) has a much larger effect and is more likely to matter in classrooms.
One simple effect size is the difference between two means. In the examples above, the effect sizes are \(78.5 - 78 = 0.5\) points and \(84 - 78 = 6\) points. Even without advanced formulas, you can compare these magnitudes.
Another useful effect size is the difference in proportions. If \(52\%\) of students pass without tutoring and \(68\%\) pass with tutoring, the effect size in percentage points is \(68\% - 52\% = 16\%\). That is easier to interpret than just hearing that the result was "significant."
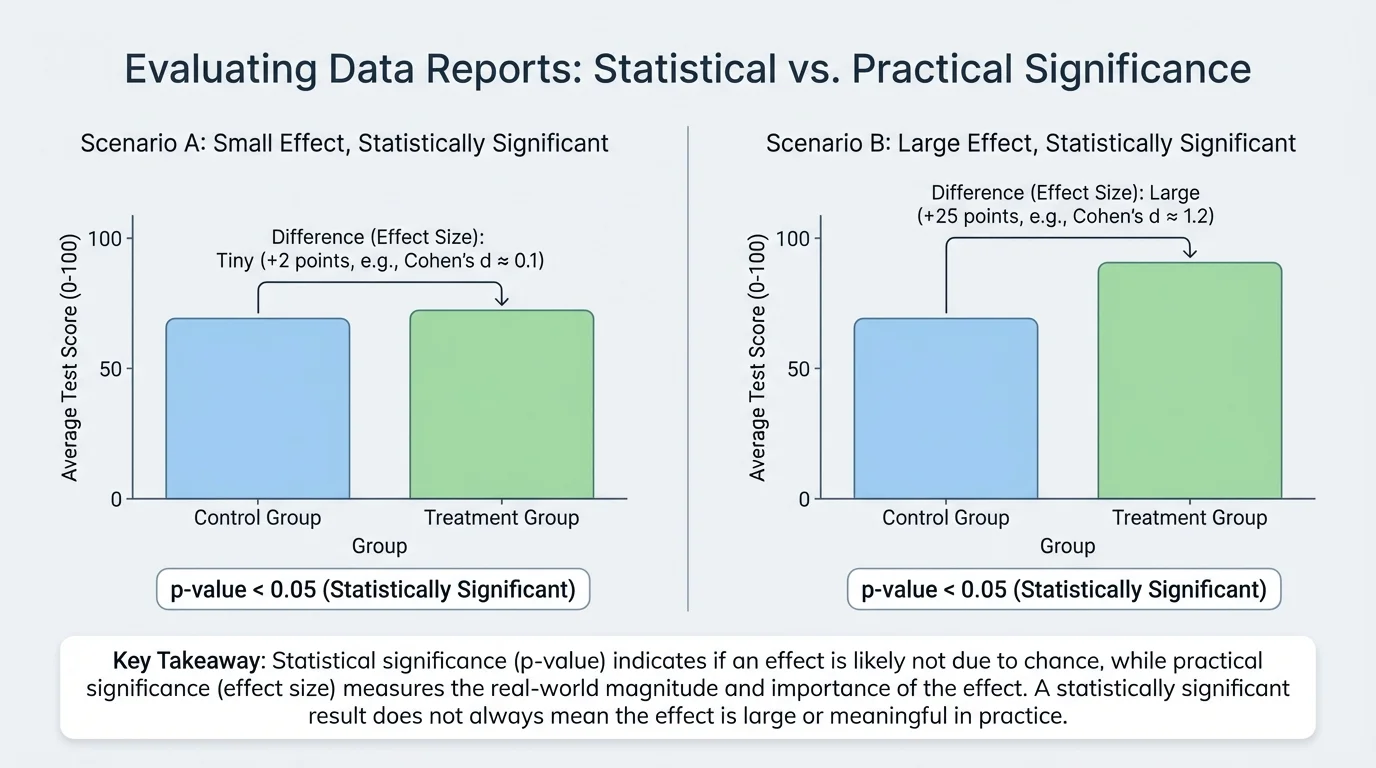
In more advanced statistics, researchers sometimes use standardized effect sizes such as Cohen's \(d\), which compares the difference in means to the amount of variation in the data. At this level, the key idea is enough: practical significance asks whether the magnitude is meaningful in context. A \(2\)-point increase on a \(100\)-point exam may matter little, while a \(2\)-point drop in blood pressure across a whole population could matter a great deal for public health.
[Figure 4] Context always matters. A tiny effect can still be important if it affects millions of people, reduces cost, improves safety, or prevents serious harm. Practical significance is not just about size in isolation. It is about size relative to the situation.
Measures of center, spread, and percent change are important background ideas here. To judge whether a change matters, you need to compare the size of the change with the scale of the data and the variation within the data.
When evaluating a report, a careful reader should move through several questions in order. Start by asking what type of study produced the data. Then ask whether the sample was representative, whether the method could produce bias, and whether the conclusion claims more than the data support.
Bias happens when the method systematically pushes results in one direction. For example, a survey posted only on a gaming website will not represent all teenagers. A biased sample can make even well-calculated statistics misleading.
Next, ask about random assignment and control groups. If a study compares students who chose tutoring with students who did not, the groups may already differ in motivation, time available, or family support. Those differences can act as confounding variables.
Then check whether the report distinguishes correlation from causation. If an observational study finds that students who listen to music while studying earn higher grades, that does not prove the music caused higher grades. It may simply be associated with other habits or conditions.
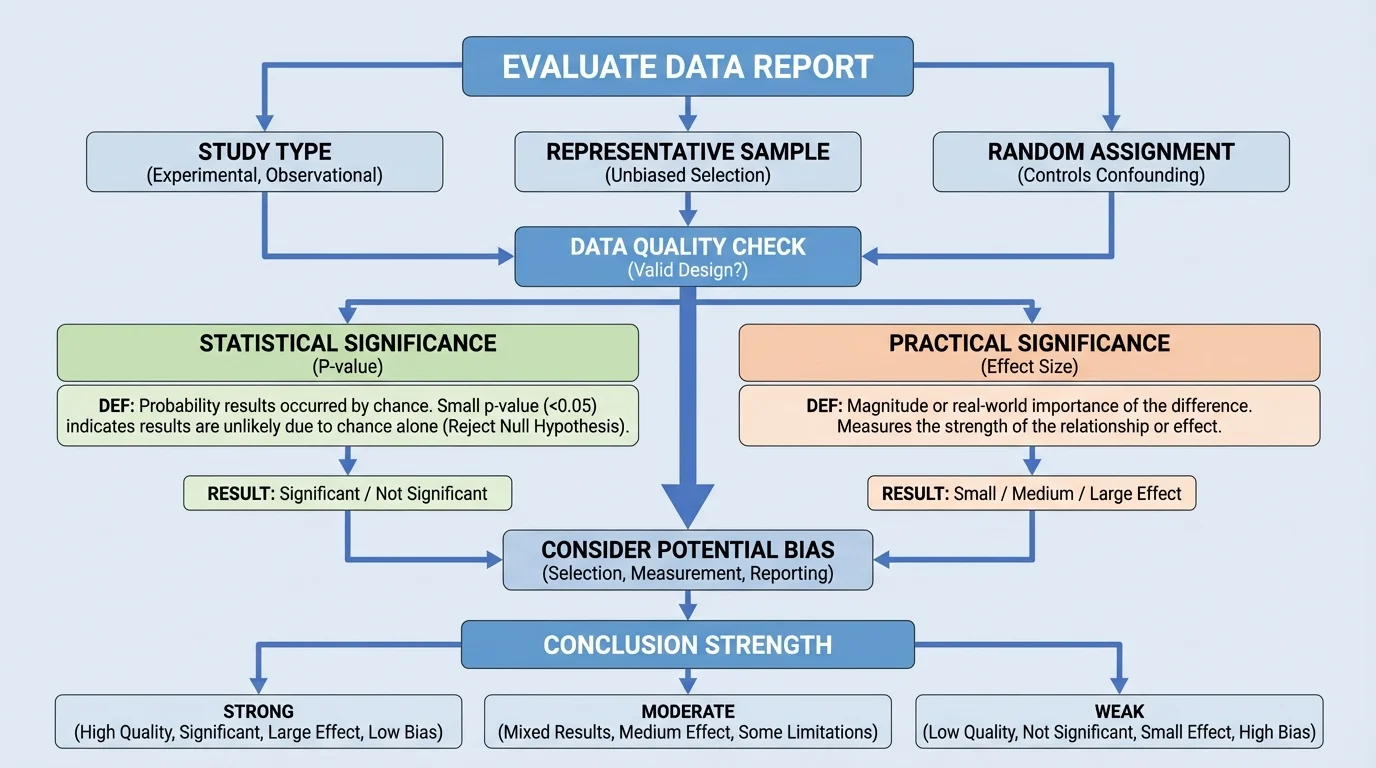
After that, look for both the p-value and the effect size. A report that mentions only one is incomplete. A small p-value without a meaningful effect size may exaggerate importance. A large effect size without enough evidence may be uncertain.
Finally, ask whether the conclusion matches the evidence. If a survey is used, the conclusion should be about describing a population or an association, not proving cause. If a randomized experiment is well designed, a causal claim may be justified. This distinction is central to evaluating scientific and media reports correctly.
| Question | Why it matters |
|---|---|
| What type of study is it? | Determines whether the report can describe, compare, or claim causation. |
| How was the sample chosen? | Shows whether the results may represent the population fairly. |
| Was there random assignment? | Strengthens cause-and-effect conclusions in experiments. |
| What is the p-value? | Shows how unusual the result is under the no-effect assumption. |
| What is the effect size? | Shows how large and meaningful the result is. |
| Could bias or confounding exist? | Reveals alternative explanations for the result. |
Table 1. Questions that help evaluate whether a report's conclusion is justified by its data.
That checklist stays useful throughout the rest of the lesson and remains a good mental model whenever a report uses the word significant too quickly.
The best way to understand these ideas is to use them on specific cases. In each example, notice that the conclusion depends on both evidence against random chance and the real-world size of the effect.
Example 1: Interpreting a p-value
A report says a new classroom app improved quiz scores and gives a p-value of \(0.02\).
Step 1: State what the p-value refers to.
The p-value of \(0.02\) means that if the app really had no effect, a result this extreme or more extreme would happen about \(2\%\) of the time due to random chance.
Step 2: Decide about statistical significance.
Since \(0.02 < 0.05\), the result is statistically significant by the common \(0.05\) cutoff.
Step 3: Check what the p-value does not tell you.
The p-value does not tell you how much scores improved. The app might raise scores by only \(0.3\) points, which may be too small to matter.
Conclusion: the data give evidence of a real effect, but the effect's importance still needs to be evaluated.
This is exactly why news reports can be misleading when they stop at "statistically significant." Without the magnitude of the change, the audience cannot judge whether the result matters.
Example 2: Comparing effect sizes
Two exercise programs are tested.
Program A improves average mile time from \(9.8\) minutes to \(9.7\) minutes. Program B improves average mile time from \(9.8\) minutes to \(9.0\) minutes.
Step 1: Find the improvement for Program A.
The change is \(9.8 - 9.7 = 0.1\) minute.
Step 2: Find the improvement for Program B.
The change is \(9.8 - 9.0 = 0.8\) minute.
Step 3: Compare practical significance.
Program B has the larger effect size because \(0.8 > 0.1\). Even if both are statistically significant, Program B has the more practically significant improvement.
Conclusion: effect size helps compare how meaningful two results really are.
The contrast in this example matches the visual idea in [Figure 3]: statistical significance alone does not tell you whether a difference is tiny or substantial.
Example 3: Evaluating a report
A headline says, "Students who bring water bottles to class score higher on tests." The article cites an observational study of \(300\) students and reports \(p = 0.01\).
Step 1: Identify the study type.
This is an observational study, not an experiment, because students were not randomly assigned to bring water bottles.
Step 2: Interpret statistical significance.
Since \(0.01 < 0.05\), the association is statistically significant.
Step 3: Check for causation issues.
The study does not prove that water bottles caused higher scores. Students who bring water bottles may also have other habits that support learning.
Step 4: Ask about practical significance.
If the score difference is only \(0.5\) points on a \(100\)-point test, the effect may be too small to matter much.
Conclusion: the report shows a statistically significant association, but a causal claim would not be justified.
These ideas matter far beyond math class. In medicine, researchers test whether a treatment lowers symptoms, blood pressure, or recovery time. A medicine might produce a p-value below \(0.05\), but if it shortens illness by only a few hours and causes strong side effects, doctors may decide it is not practically worthwhile.
In education, schools compare programs to see whether they improve attendance, graduation rates, or test scores. A district should not spend large amounts of money on a program just because a study says the effect was significant. Leaders should ask how large the benefit was and whether it justifies the cost.
In sports, teams analyze training methods, equipment, and game strategies. If a change increases shooting accuracy from \(45\%\) to \(45.4\%\), the result may be statistically significant in a huge dataset, but coaches still need to ask whether that difference changes decisions on the court.
In public policy, small effects can matter when many people are involved. If a safety rule reduces injury risk by only a small percentage, the practical significance may still be high if the rule protects millions of workers or drivers.
"Not everything that counts can be counted, and not everything that can be counted counts."
— often attributed to Albert Einstein
That quote fits data reports well. Statistical tools count and compare, but judgment is still needed to decide what those numbers mean in human terms.
One common mistake is treating a statistically significant result as proof of a large effect. Another is assuming a non-significant result proves there is no effect at all. Sometimes the sample is just too small to detect the effect clearly.
A better question is not simply "Is it significant?" but "What kind of study was used, how strong is the evidence, how large is the effect, and what limits the conclusion?" That fuller question leads to better reasoning.
Another mistake is ignoring uncertainty. Good reports often include ranges, margins of error, or discussion of limitations. A careful reader notices when a report sounds more certain than the evidence allows.
Finally, do not let a single p-value decide everything. A strong conclusion grows from multiple parts working together: sound design, fair sampling, appropriate analysis, reasonable interpretation, and attention to practical importance.