What if you had to decide where millions of people should live safely, where farmers should grow food, or where a new bridge should be built, and you could not ever visit those places in person? You could solve it by using powerful geographic tools and information to understand the world, make educated guesses (inferences), and predict what might happen next. You can learn to do this too!
In this lesson, you will learn how to use maps, globes, satellite images, and other geographic sources to study the Western Hemisphere. You will practice thinking like a geographer: reading clues, finding patterns, and using those patterns to make inferences and predictions about people, places, and environments.
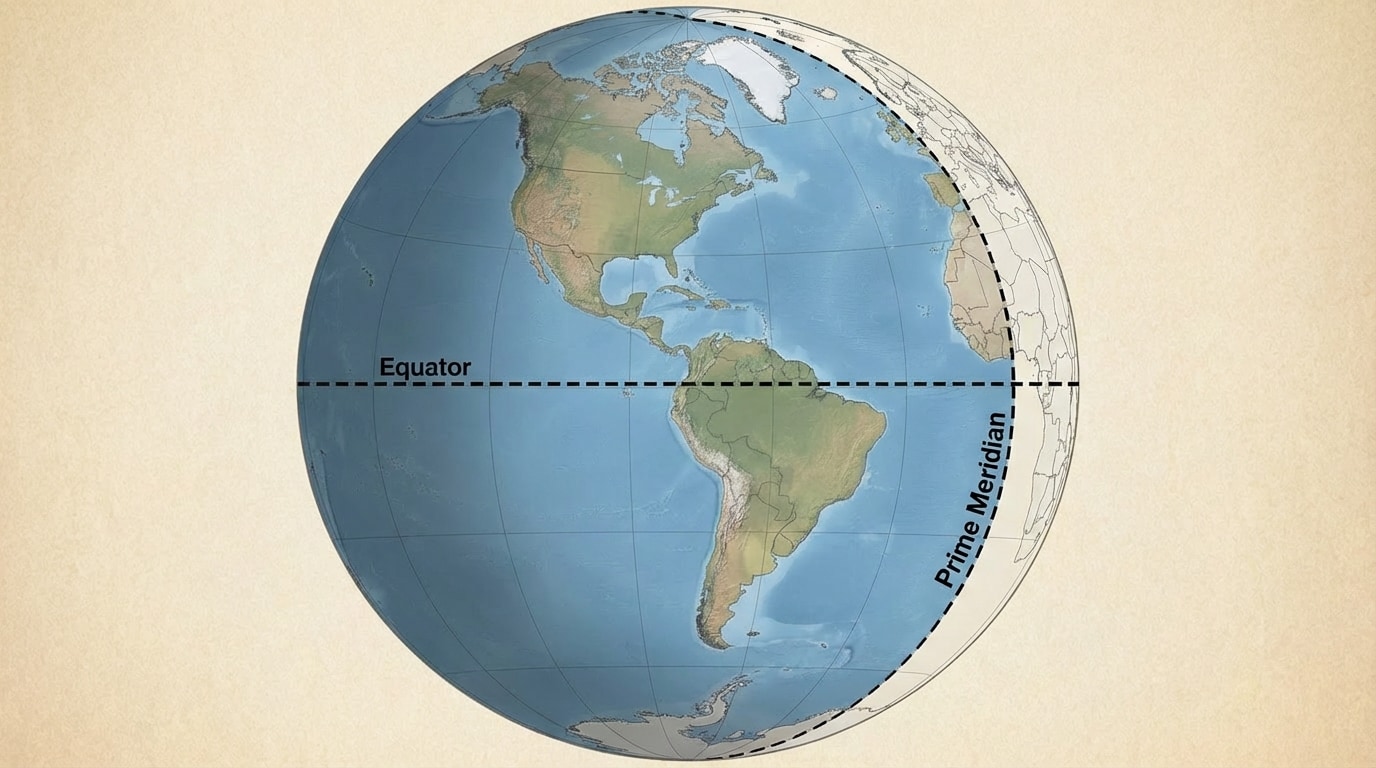
To understand what we are studying, you first need to know what a hemisphere is. The word “hemisphere” means “half of a sphere.” Earth is a sphere, so geographers sometimes divide it into halves to make it easier to study.
There are different ways to divide Earth into hemispheres. When we talk about the Western Hemisphere, we divide Earth based on lines of longitude. Longitude lines run north–south, but they measure how far east or west a place is from a starting line called the prime meridian.
The prime meridian is at longitude \(0^\textrm{\degree}\). The Western Hemisphere includes all places west of the prime meridian to longitude \(180^\textrm{\degree}\), as shown in [Figure 1]. This huge half of the Earth includes:
The equator, at latitude \(0^\textrm{\degree}\), also crosses the Western Hemisphere. Latitude lines run east–west but measure how far north or south something is. Knowing both latitude and longitude helps geographers give an exact “address” for any place in the Western Hemisphere.
When you look again at the shaded area, you can see that the Western Hemisphere contains many different types of environments: icy areas, deserts, rainforests, mountains, plains, and huge cities. Geographic tools help us understand all of these.
Geographers use many tools to study the Western Hemisphere and the rest of the world. Each tool gives different kinds of information.
1. Globes
A globe is a small model of Earth. Because it is a sphere, a globe shows the shapes and sizes of continents and oceans very accurately. Globes are great for seeing big patterns, like how the Americas stretch from the Arctic almost to Antarctica.
2. Maps
Maps are flat drawings of all or part of Earth’s surface. They are easier to carry and use than globes. There are many types of maps:
3. Atlases
An atlas is a book of maps. Atlases often include maps of every continent and world region, including the Western Hemisphere. They may add facts, charts, and photos to help you compare places.
4. Satellite Images
Satellites orbit Earth and take pictures from space. These images show real shapes of rivers, mountains, cities, and forests. By comparing images from different years, geographers can see changes, such as shrinking glaciers or growing cities.
5. GIS (Geographic Information Systems)
GIS is computer software that can store, layer, and analyze many kinds of geographic data. For example, a GIS map of the Western Hemisphere could combine layers that show elevation, population, climate, and roads. This helps geographers see how different factors are related.
6. Other Sources
Geographers also use books, government reports, online databases, climate records, and interviews with people who live in a place. Together, these tools and sources help them build a full picture of what a region is like.
Using maps is one of the most important geographic skills. A good map is full of clues, as you can see in [Figure 2]. To make correct inferences and predictions, you must know how to read those clues.
Key Parts of a Map
When you combine all of these parts, you can answer more complex questions. For instance, on a population map of the Western Hemisphere, darker colors might show areas where more people live. On a physical map, brown might show high mountains and green might show low plains.
Looking carefully at the sample map, you could:
Every time you answer a question like this, you are practicing geographic thinking.
An inference is a conclusion you reach using clues and your own reasoning. In geography, you use data from maps and other sources to make inferences about places and people.
Example 1: Latitude and Climate
Look at a physical map and a climate map of the Western Hemisphere. Near the equator (latitude \(0^\textrm{\degree}\)), you see rainforests in the Amazon Basin. Closer to the poles, like northern Canada, you see cold tundra. From this information, you can make an inference:
Places closer to the equator in the Western Hemisphere usually have warmer, wetter climates, while places farther north or south are usually colder.
Example 2: Population and Landforms
If you compare a population density map and a physical map, you might notice that many large cities in South America are on or near the coast or along major rivers, not deep in the high Andes Mountains. You can infer that it is easier for big populations to live and trade near coasts and rivers than on steep, high mountains.
Example 3: Resources and Economic Activities
A thematic map of natural resources might show large oil reserves in Venezuela and the Gulf of Mexico. An economic activity map might show many jobs in oil drilling and shipping in the same areas. You can infer that:
Natural resources in the Western Hemisphere, such as oil, influence where certain industries and jobs are located.
Good geographers do not stop at just one map. They compare several sources and look for patterns that repeat. If many different maps point to the same conclusion, their inference is stronger.
A prediction is a reasonable guess about what might happen in the future based on information you already have. Geographers make predictions to help communities prepare for change.
Example 1: Predicting Climate Patterns
By looking at past climate data and latitude, geographers can predict that the Amazon Basin will likely stay hot and wet, while central Canada will stay cold with long winters. However, they might also use new data about climate change to predict that certain places will become warmer or drier than before.
Example 2: Predicting City Growth
If a population map shows that cities like São Paulo and Mexico City have grown rapidly in recent decades, and an economic map shows that many jobs and industries are located there, geographers can predict that these cities will probably keep growing. They may warn leaders to plan for more housing, transportation, and schools.
Example 3: Predicting Natural Hazards
Maps of earthquake zones, volcanoes, and hurricane paths help geographers predict which areas of the Western Hemisphere are most at risk from natural disasters. This helps leaders prepare emergency plans and building codes.
Predictions are not magic. They are based on careful study of patterns in past and present data.
The Amazon Basin in northern South America is one of the most important regions in the Western Hemisphere. It includes the Amazon River and the world’s largest tropical rainforest.
Using different geographic tools and sources, you might collect the following information:
From this information, you can make several inferences:
You can also make predictions. For example, if you see more and more areas of deforestation on satellite images over several years, you might predict that:
Geographers share these predictions with governments and environmental groups, who can use them to create plans to protect the rainforest.
Many powerful hurricanes form in the Atlantic Ocean and move into the Caribbean Sea and Gulf of Mexico, affecting islands and coastal areas of North and Central America. Meteorologists (scientists who study weather) and geographers use maps and satellite data to track these storms, as shown in [Figure 3].
They might look at:
On a hurricane track map, curved lines with symbols may show the predicted path of the storm over several days. Shaded areas near coastlines show where the highest risk of strong winds and heavy rain is. People living in those shaded zones can use this information to prepare or evacuate.
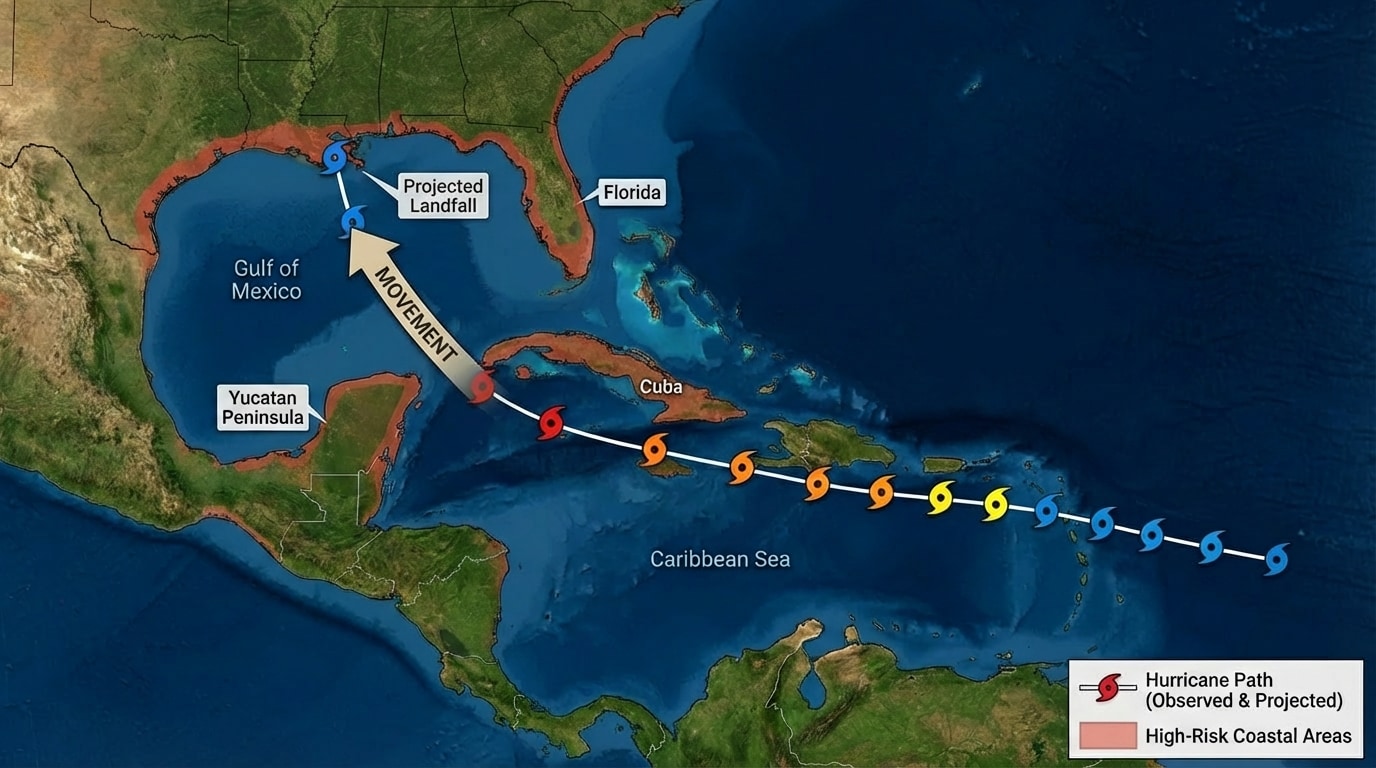
Looking at the hurricane example, you could:
Government leaders, rescue teams, and everyday families in the Western Hemisphere all depend on these geographic predictions to stay safe.
Another major part of geographic thinking is human-environment interaction: how people affect the environment and how the environment affects people.
Using geographic tools and sources, you can study many examples in the Western Hemisphere:
By studying these patterns, you can also predict future challenges and opportunities, such as where new dams, roads, or protected parks might be needed.
To effectively use geographic tools and sources for the Western Hemisphere, keep these tips in mind:
The Western Hemisphere is the half of Earth west of the prime meridian to longitude \(180^\textrm{\degree}\), including most of the Americas, parts of Europe and Africa, and parts of Antarctica, as illustrated in [Figure 1]. Geographers study this vast region using tools such as globes, many kinds of maps, atlases, satellite images, GIS, and written data sources.
Understanding the basic parts of a map—the title, compass rose, legend, scale, and grid—allows you to interpret information accurately, like on the map example in [Figure 2]. By comparing different maps and sources, you can make geographic inferences, such as how latitude affects climate or how natural resources shape economic activities.
Using patterns from past and present data, you can also make predictions about the future. Case studies from the Amazon Basin and hurricane zones in the Caribbean and Gulf of Mexico, including the hurricane track in [Figure 3], show how these predictions help protect environments and people’s lives.
Throughout the Western Hemisphere, human-environment interaction is visible in farming choices, city locations, building designs, and tourism. By using geographic tools carefully, questioning what you see, and connecting information from many sources, you can think like a geographer and better understand how people and places are connected across this half of our planet.