Why do so many people live on the coasts, even though those areas are hit by hurricanes and sea-level rise? 🌊 Questions like this are at the heart of geography. To answer them, geographers don't just "look at maps" — they use powerful geographic tools to research and analyze patterns in both nature and human life across the United States.
Geography is more than memorizing state capitals. It studies how Earth's natural features and human activities are arranged in space, and how they affect each other. When we focus on the United States, we look at:
Across the U.S., these systems form spatial patterns. For example, there is a dense cluster of large cities along the Northeast coast, and a band of dry climates in the Southwest. Geographic tools help us see, measure, and explain these patterns.
Physical systems are the natural parts of Earth, such as landforms, climates, water, and ecosystems. Human systems are the ways people organize themselves and use space, such as settlements, transportation networks, and economic activities.
To understand where people live, how they move, and how they use land and resources, we rely on maps, geospatial data, and digital technologies.
Geographers in middle school, college, government, and business all rely on a similar set of tools. Some are traditional, some are high-tech, but they work together to answer questions about the United States.
Here are some of the most important tools:
Paper maps and atlases. These include road maps, political maps, and topographic maps that show elevation with lines or color shading. An atlas is a book of maps; a U.S. atlas might include maps of each state, landforms, climate, and population.
Globes. A globe is a model of Earth. It shows accurate shapes and relative sizes of continents and oceans. For U.S. geography, a globe helps you see where the country sits in relation to other nations and oceans.
GIS (Geographic Information Systems). A GIS is computer software that stores, analyzes, and displays geographic data in layers. For example, a city planner can combine roads, flood zones, and population in one GIS project to decide where to build new housing.
Remote sensing. Remote sensing uses satellites or aircraft to collect images and data from a distance. With it, scientists can measure snowpack in the Rockies, monitor forest fires in California, or track coastal erosion along the Gulf of Mexico.
Online maps and data. Websites like government map portals, mapping apps, and data dashboards allow anyone to zoom, pan, and explore U.S. geographic data: weather maps, traffic congestion, COVID-19 spread, and more.
To use geographic tools, you must be able to read and interpret maps. A standard U.S. map, as shown in [Figure 1], usually includes a title, a compass rose, a scale bar, and a legend of symbols.
Key parts of almost any map include:
Different kinds of maps highlight different patterns in the United States:
By comparing several map types of the same area of the U.S., you can spot relationships. For instance, a physical map plus a population map can show that many major cities lie along rivers or coasts.
The United States covers a huge area with very different physical systems. You can see these differences clearly on physical and climate maps of the country, as in [Figure 2].
Major landform regions. From east to west, the U.S. contains:
Climate regions. Climate maps show patterns like:
Water systems. Large river systems shape physical and human patterns. The Mississippi River system drains much of the central U.S., supporting agriculture and transportation. The Colorado River carves the Grand Canyon and supplies water to multiple states.
Natural hazards. Physical systems also include hazards. The U.S. has:
Geographic tools help scientists map where these hazards strike most often. For example, by plotting earthquake locations on a U.S. map, geologists identify high-risk zones along the San Andreas Fault.
Remote sensing images of the United States allow scientists to track the size of glaciers, the health of forests, and even changes in nighttime lights from cities growing brighter.
When you compare maps of landforms, climate, and water with maps of population or agriculture, you start to see how physical systems shape where and how people live.
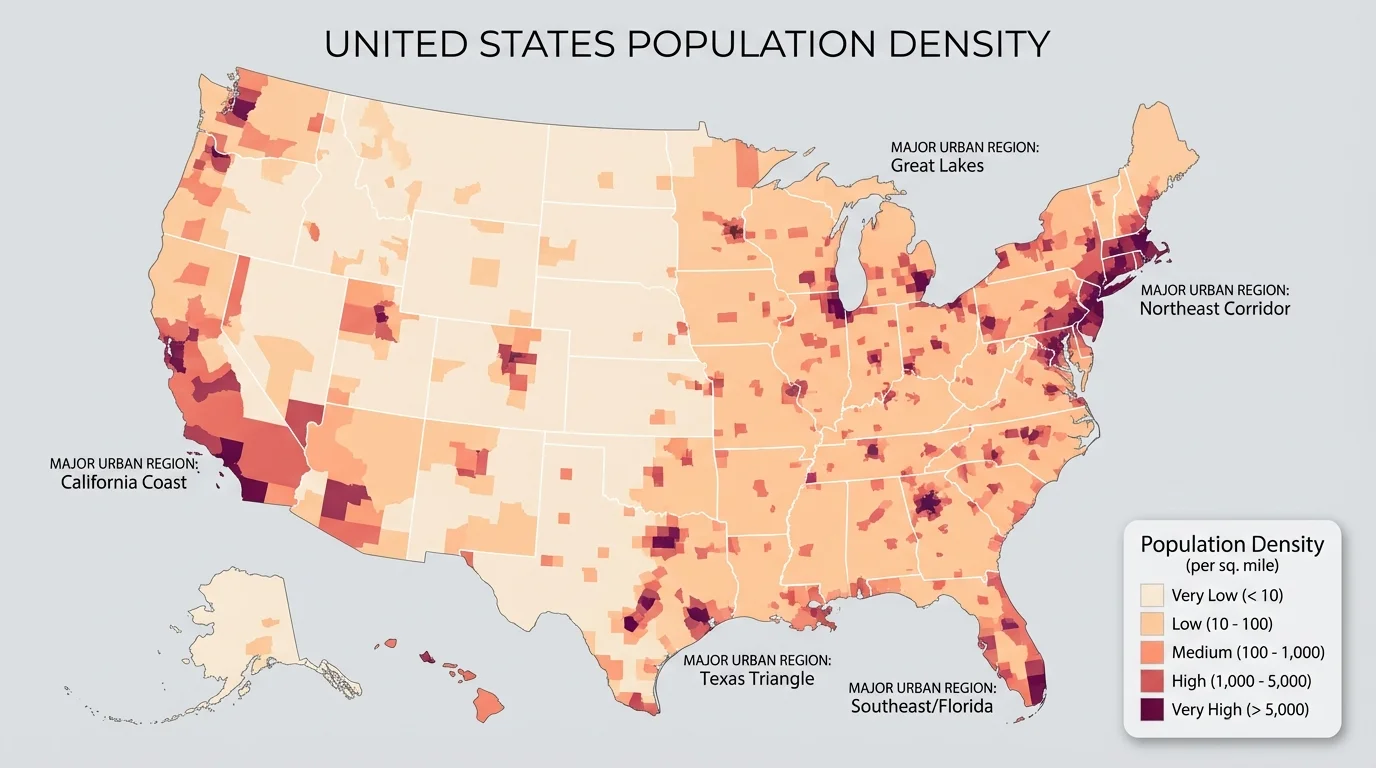
Human systems describe how people are organized and how they use space. A U.S. population density map, like the one in [Figure 3], reveals where people cluster and where land is more open.
Population distribution and density. In the U.S., people are not spread out evenly. Patterns include:
Urban and rural patterns. Geographic tools help us compare:
Migration and movement. Maps and GIS track how people move within the U.S. For example, many people have moved from the "Rust Belt" (older industrial cities in the Midwest and Northeast) to the "Sun Belt" (South and Southwest) in recent decades. Flow maps can show arrows and line thickness to represent the number of people moving between regions.
Economic activities. The U.S. economy has spatial patterns too:
A thematic map of, for example, corn production by county clearly shows which regions are the main producers.
Transportation networks. Highway maps, airline route maps, and shipping maps show human systems connecting places. Interstates like I‑95 on the East Coast or I‑10 across the South link major cities and affect trade, commuting, and even where businesses choose to locate.
Now let's see how these tools work together in a real-world U.S. example. Hurricanes often strike the Atlantic and Gulf coasts, but millions of people still live there. 🌪️ Why?
Case study: Hurricane risk and U.S. coastal cities
Suppose you want to analyze hurricane risk for cities along the Gulf Coast.
Step 1: Define the question.
For example: "Which coastal counties in Texas and Louisiana have both high population density and high hurricane risk?"
Step 2: Gather geographic tools and data.
You might use:
Step 3: Overlay and compare layers (using GIS if available).
You could add:
Step 4: Identify patterns and draw conclusions.
Looking at all layers at once, you might notice that many heavily populated counties lie in low-lying areas where multiple hurricanes have made landfall. You might conclude that these counties face serious risk for storm surge and flooding.
By combining population maps like the one in [Figure 3] with hazard and elevation maps, decision-makers can plan evacuations, building codes, and flood defenses more effectively.
This case study shows how physical systems (storms, sea level, coastal landforms) and human systems (cities, housing, evacuation routes) interact, and how geographic tools reveal their relationships.
The Ogallala Aquifer is a huge underground water source beneath parts of eight states in the central United States, including Texas, Kansas, and Nebraska. It is critical for irrigation in the Great Plains, one of the nation's main farming regions.
Case study: Water, farming, and sustainability in the Great Plains
Suppose you want to understand how human systems depend on this physical system, and what might happen as the aquifer is used up.
Step 1: Define the question.
For example: "How does irrigation from the Ogallala Aquifer support crop production, and where is water use highest?"
Step 2: Choose geographic tools.
You might gather:
Step 3: Analyze spatial patterns.
You compare the aquifer map with the crop map. Many of the most productive farming areas lie directly above the aquifer. Remote sensing data may show areas where fields have become less green over time, possibly because wells are running dry or farmers are switching crops.
Step 4: Interpret the relationship between physical and human systems.
Your analysis shows that the human system of large-scale irrigated agriculture strongly depends on the physical system of groundwater stored in the aquifer. If water levels fall too low, farming patterns may have to change, affecting food production, local economies, and rural communities.
This example highlights how tools like GIS and remote sensing help scientists, farmers, and policymakers plan for a more sustainable future.
Comparing this example with the hurricane case study, you can see that geographic tools help with both sudden hazards (storms) and slow changes (groundwater decline).
Geographic research is not just for experts; you can use the same tools and thinking to answer questions about the United States. 🧭 Here is a simple process:
When you follow these steps, you are thinking like a geographer, using tools similar to those used by city planners, environmental scientists, and emergency managers across the United States.
"The study of geography is more than just memorizing places on a map. It's about understanding the complexity of our world."
— Barack Obama
Every time you see a weather radar map, a traffic map on your phone, or an election results map on the news, you are looking at geographic tools in action, helping people understand patterns in human and physical systems.