When a river floods a city, when a pandemic spreads across continents, or when wildfires shut down power in a region, none of it is random. These events follow patterns in space and time that geographers can see, measure, and explain. Those patterns affect where people live, how economies grow, and who is most vulnerable. Geographic tools let us move beyond “this is happening” to “why here, why now, and what can we do about it?”.
Modern geography is not just about memorizing capitals. It is about investigating issues such as climate change, water scarcity, food security, migration, and urban sprawl. By combining data on Earth’s physical features with data on human systems, we can design smarter, more just responses to real-world problems. That is the core of using geographic tools and resources to investigate and address geographic issues. 💡
To use geographic tools well, you need a mental toolkit of core concepts. These ideas guide how you ask questions and interpret data.
Location answers the question “Where is it?”. There are two main types:
Place includes both physical characteristics (landforms, climate, vegetation) and human characteristics (language, architecture, economic activities, cultural meanings) that make one location different from another.
Region groups places that share common features, such as climate zones (like the Sahel), economic regions (like the European Union), or cultural regions (like the Arab world). Regions help us generalize patterns over larger areas.
Scale is about the level of analysis. The same problem can look different at multiple scales:
Effective geographic analysis often moves between scales, connecting local experiences to regional and global processes.
Human and physical systems are the two major sides of geography:
The most powerful insights come from studying interactions between human and physical systems. For example, a megacity’s growth on a low-lying delta directly shapes its flood risk and the impact of sea-level rise.
Geographers rely on a wide range of tools to collect, visualize, and analyze spatial data. Many of these tools are now digital and widely used in government, business, and science.
Maps and map types
Maps are the basic language of geography. They are selective, simplified representations of reality designed for specific purposes.
Geographic Information Systems (GIS)
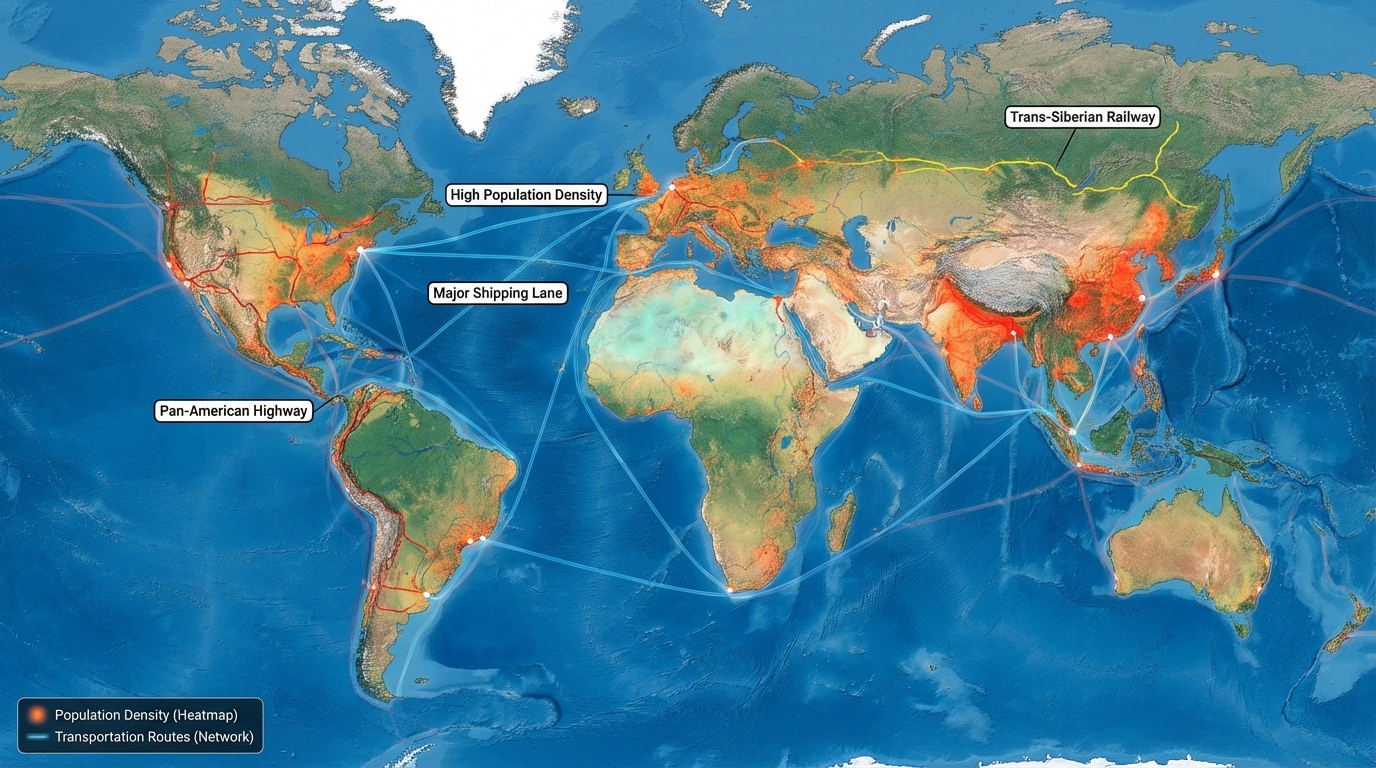
GIS is a computer-based system for storing, analyzing, and visualizing geographic data. A key idea in GIS is layering different kinds of data over the same base map, such as shown in [Figure 1], combining physical features with human data.
By turning layers on and off, or analyzing their overlaps, GIS helps answer questions like: Where do high population density, low elevation, and weak infrastructure overlap, creating high disaster risk?
Remote sensing and satellite imagery
Remote sensing gathers data about Earth’s surface from a distance, usually via satellites or aircraft. Satellite images can reveal:
Because many satellites collect repeated images of the same area, geographers can build time-series analyses to track change.
Global Positioning System (GPS)
GPS uses a network of satellites to determine precise positions on Earth’s surface. Smartphones, car navigation systems, and shipping companies all use GPS to collect location data. When these data points are mapped, they reveal patterns in human movement, such as commuting flows or delivery routes.
Fieldwork and ground truthing
Even with high-tech tools, geographers still go into the field to collect data:
Field data are often used to confirm (“ground truth”) what remote sensing and GIS suggest, improving accuracy and interpretation.
Statistical and documentary sources
Geographic issues are also investigated with:
These sources, when linked to locations in GIS, become powerful tools for seeing how social and economic patterns vary across space.
Physical geography focuses on the natural environment — but always with an eye on how it shapes, and is shaped by, human life.
Landforms and elevation
Mountains, plains, plateaus, valleys, and coasts influence everything from transportation routes to settlement patterns. Using topographic maps and digital elevation models, geographers can:
Hydrology: rivers, lakes, and groundwater
Water systems are central to agriculture, industry, and daily life.
Combining stream gauge data, rainfall records, and population maps allows geographers to identify communities most exposed to flood or drought risk.
Climate and biomes
Climate maps summarize long-term patterns of temperature and precipitation. Biome maps show major ecological regions, like tropical rainforest, savanna, or tundra. These maps help answer questions such as:
Natural hazards
Geographers use hazard maps to represent the probability and potential impact of earthquakes, volcanoes, hurricanes, tsunamis, and more. By overlaying hazard zones with population and infrastructure data, they can:
Human geography examines how people are distributed across space, how they move, and how they organize societies, economies, and cultures.
Population distribution and density
Population maps reveal where people are clustered and where they are sparse.
By connecting population data to physical geography, we can ask: Are dense settlements located in floodplains? On coasts vulnerable to hurricanes? Near active volcanoes?
Migration and mobility
Flow maps show the movement of people between places:
When combined with policy maps and economic data, migration maps help identify pressures on housing, infrastructure, and services.
Urbanization and land use
Land-use maps classify areas as residential, commercial, industrial, agricultural, forest, or open space. These maps help explain:
Economic and cultural landscapes
Economic maps show patterns of employment, income, and industrial location. Cultural maps might show language use, religion, or ethnic distribution. Together they reveal:
Political geography
Maps of borders, electoral districts, and control of territory help analyze:
By linking political maps with demographic and economic data, geographers can study which groups gain or lose power from specific decisions.
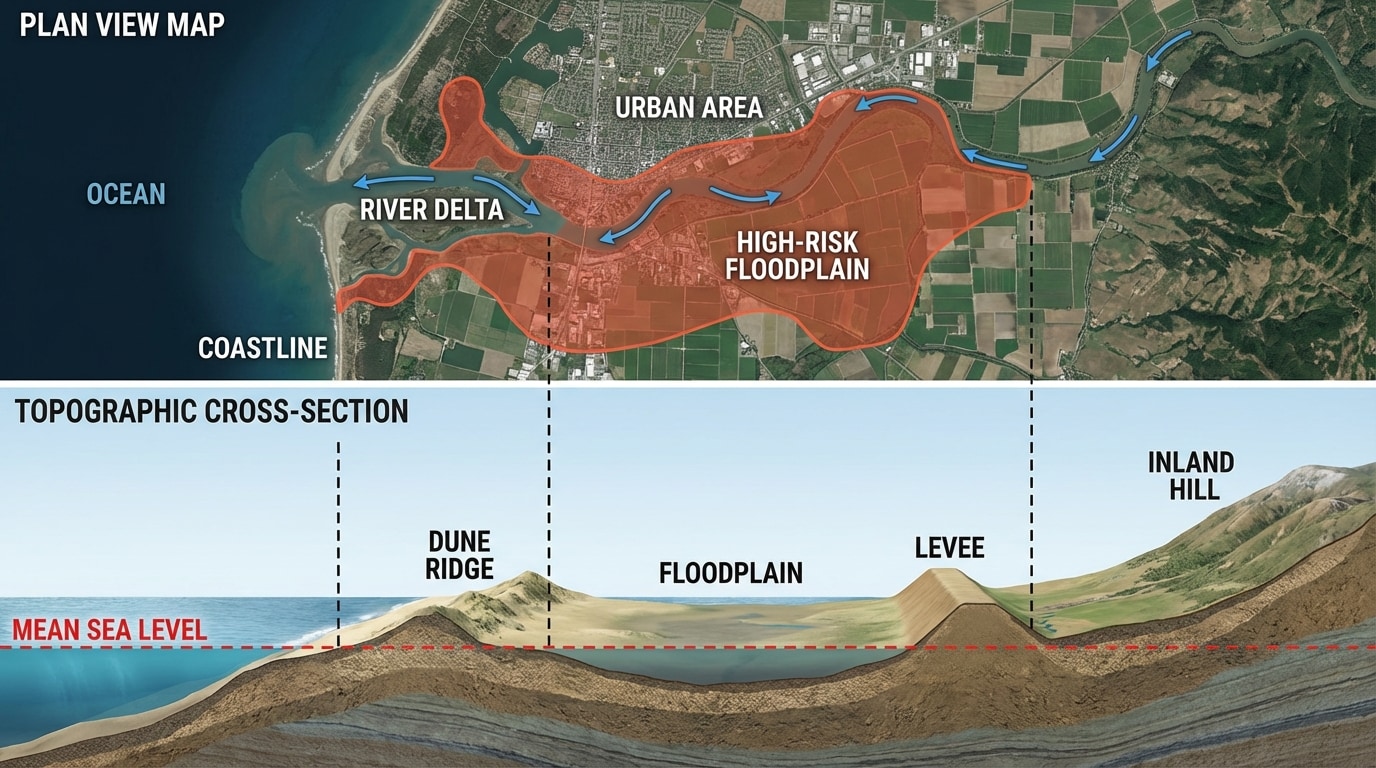
Consider a low-lying coastal city facing more frequent flooding due to sea-level rise and stronger storms. How can geographic tools help investigate and address this issue?
Step 1: Describe and map the physical risk
Step 2: Map human exposure and vulnerability
Step 3: Analyze impacts and inequalities
By comparing layers, geographers can ask:
Step 4: Support solutions and planning
Geographic analysis does not stop at describing problems. It also guides responses:
City planners, emergency managers, and community organizations rely on these geographic products to make decisions that can literally save lives.
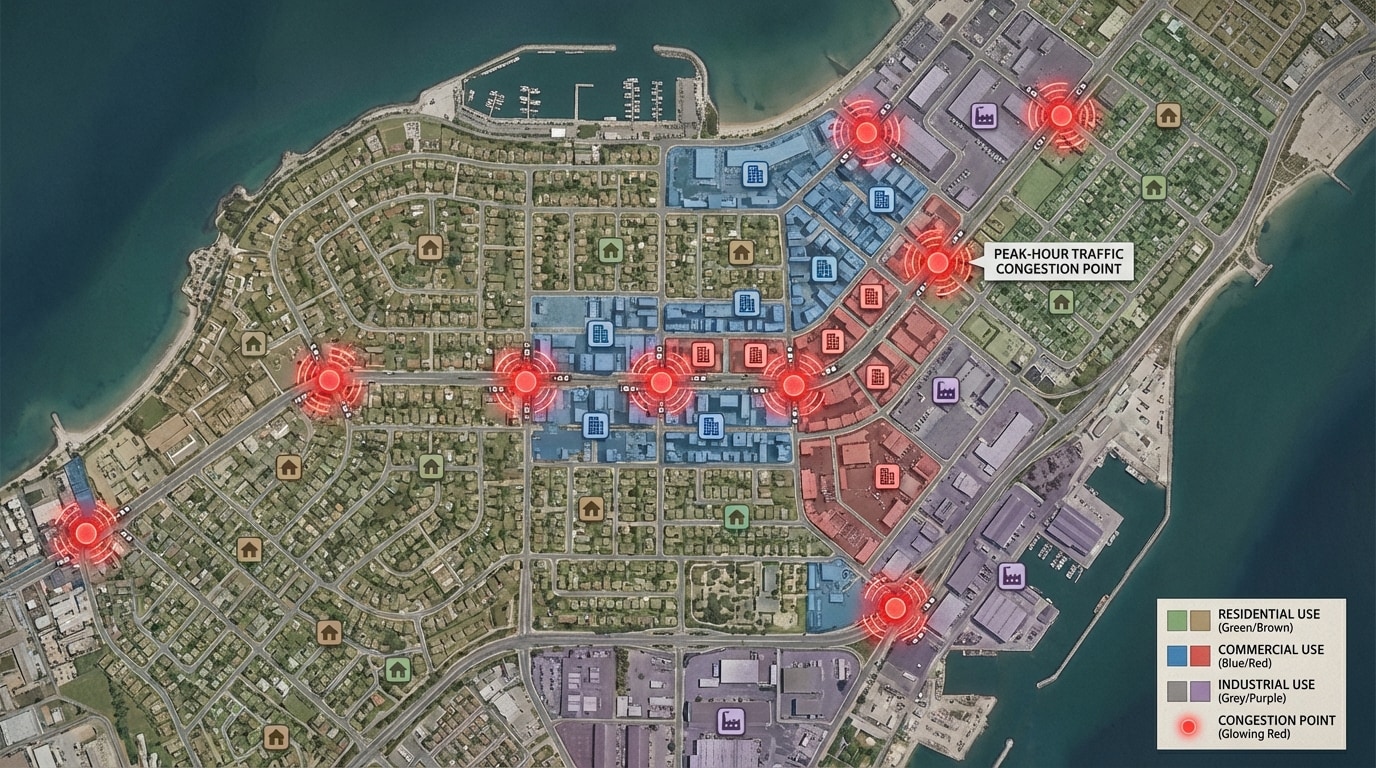
Now consider a fast-growing metropolitan area where traffic congestion is worsening, public transit is limited, and air pollution is rising.
Step 1: Collect and map transportation and land-use data
Step 2: Add demographic and socioeconomic layers
Step 3: Analyze patterns and problems
Using GIS, geographers overlay these layers to see:
Step 4: Evaluate potential solutions
Geographic tools help test and compare strategies before they are built:
Maps and spatial analysis make it easier to communicate these ideas to the public and decision-makers, showing who benefits and where trade-offs occur.
Geographic investigation is most powerful when it leads to informed action. Whether the issue is water scarcity, environmental injustice, habitat loss, or disaster risk, the basic process is similar.
1. Identify the issue and define the question
Start by clearly stating the problem in geographic terms: What is happening, where, and to whom? For example, “Which neighborhoods in this city face the greatest combined risk from heat waves and lack of green space?”
2. Choose appropriate tools and data
Use your understanding of tools, like those demonstrated in [Figure 1] and [Figure 3], to select:
3. Analyze patterns and relationships
Look for spatial patterns, clusters, and overlaps:
4. Communicate findings
Clear, well-designed maps, graphs, and written explanations help others understand complex geographic issues. Effective communication can influence public opinion, policy debates, and community organizing.
5. Inform decisions and evaluate outcomes
Finally, geographic analysis feeds into concrete actions:
After policies or projects are implemented, geographers can use the same tools to evaluate their impacts: Did flood risk actually decrease? Did transit investments reduce commuting times and emissions?
Geographic tools and resources allow us to analyze Earth’s physical features and human systems in an integrated way. Core concepts such as location, place, region, scale, and systems provide the framework for asking spatial questions. Tools like maps, GIS, remote sensing, GPS, fieldwork, and statistical datasets supply the evidence needed to investigate geographic issues.
By mapping and analyzing landforms, water systems, climate, and hazards, geographers can identify where the physical environment creates risks or opportunities. By mapping population, migration, land use, economic activity, culture, and politics, they can see how human systems are organized and unequal across space.
Case studies of coastal flooding and urban transportation show how combining multiple data layers reveals who is most exposed to danger or burdened by problems, and what strategies might reduce harm. Throughout this process, geographic thinking connects local experiences to regional and global forces, helping societies design more effective, equitable, and sustainable responses to the challenges they face. 🎯