Why do some of the world's biggest cities sit on coasts threatened by rising seas, while others grow in deserts that barely get any rain? 🤔 These patterns are not random. They are the result of powerful connections among geographic variables—factors like climate, landforms, population, technology, and political borders—that interact to shape how people live, move, and use the Earth.
When geographers talk about geographic variables, they mean key factors that help explain patterns on Earth's surface. These variables include both the natural world and human activities, and the most important thing is how they interact.
Geographic variables are measurable or describable factors—such as climate, landforms, population density, economic activity, or transportation networks—that help explain differences and patterns between places on Earth.
Interactions in geography are the cause-and-effect relationships among these variables, such as how climate influences agriculture, which in turn shapes settlement patterns and trade.
Some major categories of geographic variables are:
Geographers also think in terms of:
To understand geography at a high-school level, you are really learning to think like a systems analyst for planet Earth: changing one variable often leads to changes in many others.
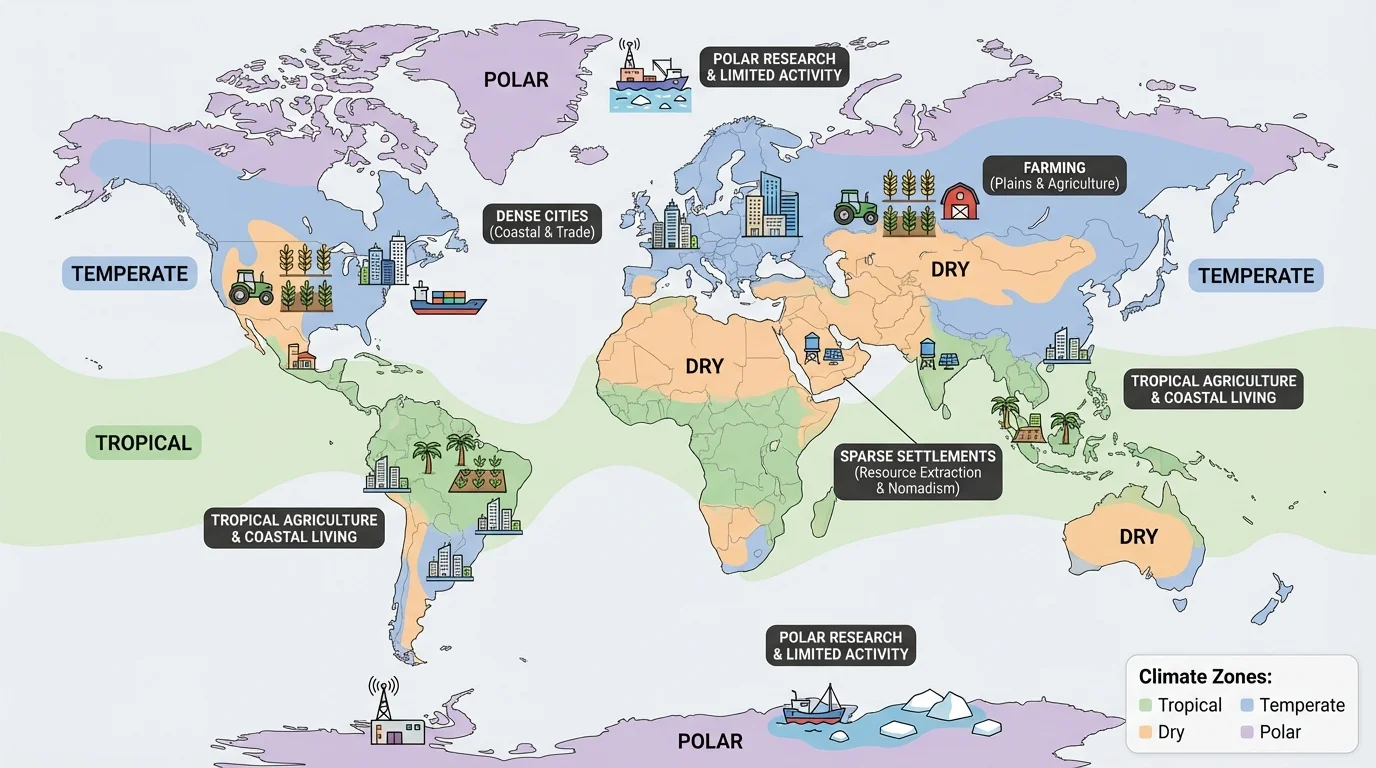
Physical geography sets many of the starting conditions within which human societies develop. As shown in [Figure 1], broad patterns of climate and landforms align with different kinds of human activities and settlement densities.
Key physical variables include:
These variables influence fundamental questions such as:
For example, Mediterranean climates with hot, dry summers and mild, wet winters are associated with crops like olives and grapes, dense coastal cities, and long histories of maritime trade. Tropical wet climates support rainforests but also face challenges such as soil leaching and diseases like malaria, which influence population patterns and land use.
Mountains block or redirect air masses, creating rain shadows where one side of a range is lush and the other is dry. This single physical variable—mountain location—can divide agricultural zones, transportation corridors, and even cultural regions for centuries.
Different combinations of climate, landforms, and resources lead to very different paths of development. Yet humans are not just passive victims of nature; they modify these physical settings through irrigation, dams, deforestation, and urbanization, which leads us into human geography.
Human geographic variables describe how people are distributed, how they organize society, and how they transform environments. The concept of a human–environment interaction emphasizes that people both depend on and reshape their surroundings.
Important human variables include:
For example, a mountainous region with poor soils might remain sparsely populated and rely on herding—unless technological and political changes introduce new transportation routes, tourism, or mining. In that case, roads, capital investment, and policy decisions become variables just as significant as the mountains themselves.
The built environment—the human-made surroundings such as cities, dams, farms, and factories—feeds back on physical variables. Urban areas with lots of concrete and asphalt absorb and release heat differently than forests or fields, changing local temperature and rainfall patterns.
Transportation networks link distant places into systems of spatial interaction. A major port can transform a small coastal town into a global trade hub if it connects efficiently to inland rail and road networks. Here, location, infrastructure, and economic policy interact to produce a new regional pattern of jobs, migration, and land use.
The idea of geographic scale helps you see how the same set of variables plays out differently at different levels.
Consider the global spread of a smartphone brand. At the global scale, this is shaped by technology, trade agreements, and global supply chains. At the regional scale, it depends on shipping routes, import taxes, and regional distribution centers. At the local scale, it depends on income levels, retail locations, and cultural preferences. The same product is embedded in multiple, overlapping geographic systems.
Similarly, climate change is a global physical process, but its impacts are highly uneven and depend on local and regional variables such as elevation, infrastructure quality, and political capacity to adapt. A coastal megacity with extensive flood protections faces different risks than a low-income coastal village with limited resources.
River systems provide a powerful example of how geographic variables connect. The river basin of the Nile in northeastern Africa links climate, soils, transportation, agriculture, and political history, as seen in [Figure 2].
Key physical variables in the Nile region include:
These combined to make narrow strips of land along the river highly productive for agriculture, surrounded by desert where intensive farming was difficult. Human variables then layered on top of this setting:
Modern dams and irrigation projects, like the Aswan High Dam, further modify these relationships. They regulate flooding (a physical variable) to increase agricultural output and generate hydroelectric power, but they also trap silt, alter ecosystems, and change downstream water availability, which affects fisheries and farming.
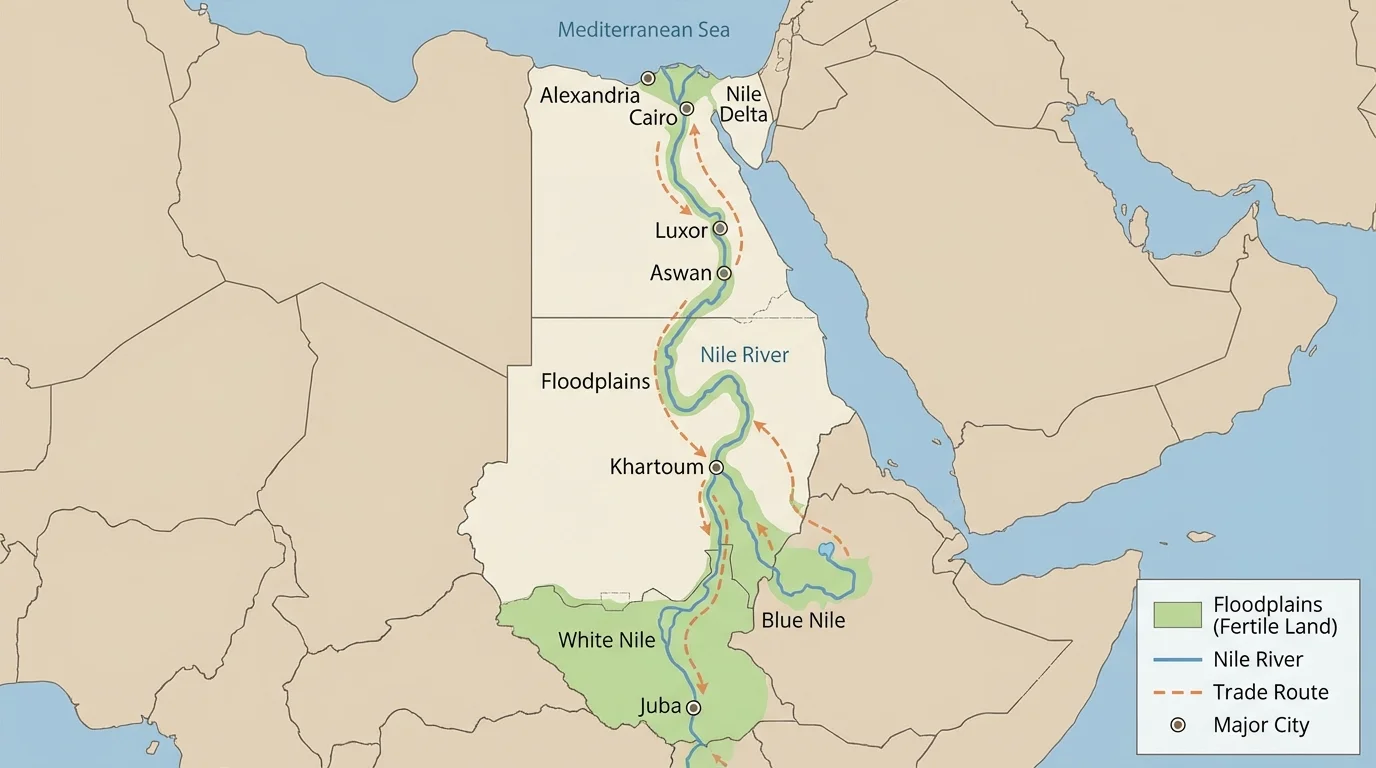
Through this case, you can trace chains of interaction: regional climate influences river flow; river flow shapes soils and agriculture; agriculture supports dense populations and cities; cities and states build dams and canals, which then reshape the river and ecosystems. These connections show geography as a set of feedback loops rather than one-way causes.
Another strong example is the monsoon climate of South and Southeast Asia, which connects atmospheric patterns, agriculture, and social vulnerability.
Physical variables include:
Human variables interacting with these conditions include:
When the monsoon arrives on time and with typical intensity, it supports food production for hundreds of millions of people. When it fails or becomes extreme, droughts and floods can occur, creating serious risks from local to national scales. Climate change is now altering these rainfall patterns, making them more unpredictable.
This leads to complex feedbacks: farmers may change crop types or migration patterns; governments may invest in dams, levees, or early warning systems; international trade becomes more important for food security. Across all of this, geography provides the tools to analyze how atmospheric variables, hydrology, land use, and social systems fit together.
Monsoon winds were not only crucial for agriculture but also for historical Indian Ocean trade, allowing sailing ships to travel across vast distances on predictable seasonal wind schedules.
That historical trade connection links climate patterns to cultural and economic exchange, including the spread of religions, languages, and technologies across the Indian Ocean basin.
Modern cities reveal how tightly human and physical variables are intertwined. The phenomenon of the urban heat island, visible in many large cities, is a direct result of land cover, building materials, and energy use, with serious social consequences, as demonstrated in [Figure 3].
Key variables at work include:
Human and social variables then interact with these physical factors:
On satellite thermal images, some cities show temperature differences of several degrees between wealthy, tree-lined neighborhoods and dense, low-income neighborhoods with more pavement and fewer green spaces. This means that environmental risk is unevenly distributed across the urban landscape.
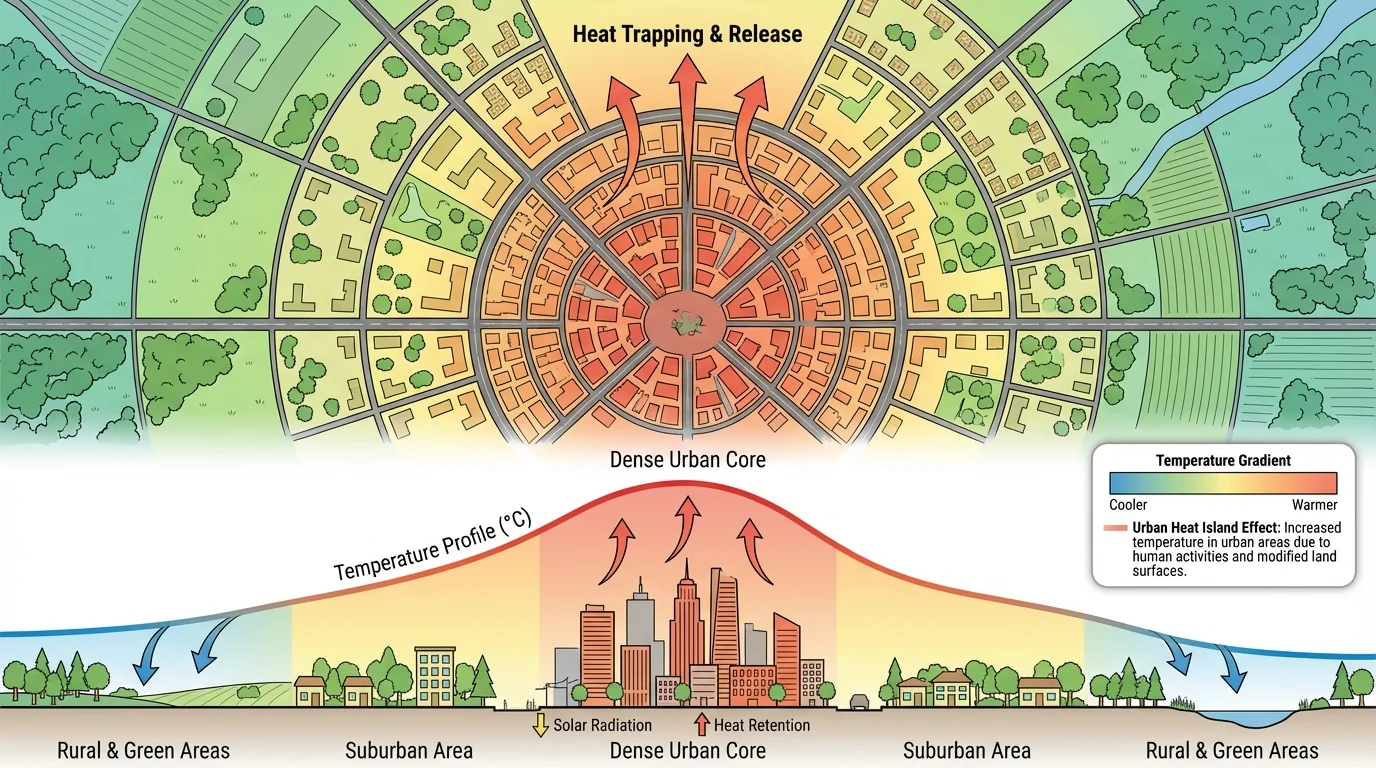
This case study highlights how variables like housing policy, zoning laws, transportation planning, and public investment interact with local climate and land cover. Solutions—such as planting trees, using reflective roofing materials, or redesigning streets—also involve coordinated geographic thinking, because they must be targeted to specific high-risk areas of the city.
To understand how variables interact, geographers rely on tools like maps, satellite imagery, and Geographic Information Systems (GIS). GIS makes it possible to layer different types of data—like population density, land use, elevation, and flood risk—on top of each other to see patterns of overlap.
For example, analysts studying flood risk might combine:
By overlaying these layers in GIS, they can identify neighborhoods where many risk factors converge and where targeted investments could save the most lives.
| Map Type | Main Variable | Typical Use |
|---|---|---|
| Physical map | Landforms, rivers, elevation | Understanding terrain, hazards, and natural boundaries |
| Climate map | Temperature, rainfall patterns | Planning agriculture, water resources, disaster preparedness |
| Population density map | People per square kilometer | Locating markets, services, and political representation |
| Land use map | Urban, agricultural, forest, etc. | Managing cities, zoning, conservation |
| Transportation map | Roads, railways, ports, airports | Analyzing connectivity, trade, and accessibility |
Table 1. Examples of thematic maps and their uses in analyzing geographic variables.
Patterns that are invisible in a single map often become clear when different variables are viewed together. For instance, combining a population density map with a climate risk map can reveal which regions face the greatest threat from heat waves, storms, or sea-level rise.
Across all these examples, several big ideas about geographic connections emerge. Systems of people, places, and environments often show patterns (such as coastal urbanization or farming in river valleys), but they also show feedback loops where a change in one variable alters others, sometimes in unexpected ways.
Some important feedback relationships include:
Climate change adds another layer of complexity. Rising temperatures, shifting rainfall patterns, and sea-level rise are changing the physical baseline conditions that shaped past human settlements. Cities built on low-lying coasts for their trade advantages now face increasing flood risk. Agricultural zones may shift poleward or to higher elevations. These changes force societies to adapt by moving infrastructure, changing crops, or developing new technologies and policies.
Understanding these interactions is not just an academic exercise. It is essential for decisions about where to build new housing, how to design transportation systems, which ecosystems to protect, and how to respond to global challenges like climate migration and resource conflicts. Geography gives you the conceptual tools to see these problems as interconnected, multi-scale systems, rather than isolated issues. 🌍