If Earth is called the "water planet," you might think clean, fresh water is everywhere. The surprising truth is that most of Earth's water is salty ocean water, and much of the fresh water is locked away in ice or hidden underground. That means the water people can easily reach in lakes and rivers is only a very small part of all the water on Earth.
Scientists study reservoirs, or places where water is stored, to understand this pattern. By comparing reservoirs with graphs, we can use evidence instead of guessing. A graph helps us see that some reservoirs hold enormous amounts of water while others hold only tiny amounts.
Water distribution matters because living things depend on water every day. People drink it, farmers use it to grow crops, and animals need it to survive. But it is not enough to know that Earth has lots of water. We also need to know where that water is.
For example, ocean water covers a huge part of Earth's surface, but it contains salt. Humans cannot safely drink salt water without special treatment. Fresh water is more useful for drinking and farming, but much of it is stored in places that are hard to reach, such as frozen ice or deep underground.
Salt water is water that contains a large amount of dissolved salts. Fresh water is water with very little dissolved salt, making it suitable for many uses by plants, animals, and people. A reservoir is a place where water is stored, such as an ocean, glacier, lake, river, or underground layer of rock and soil.
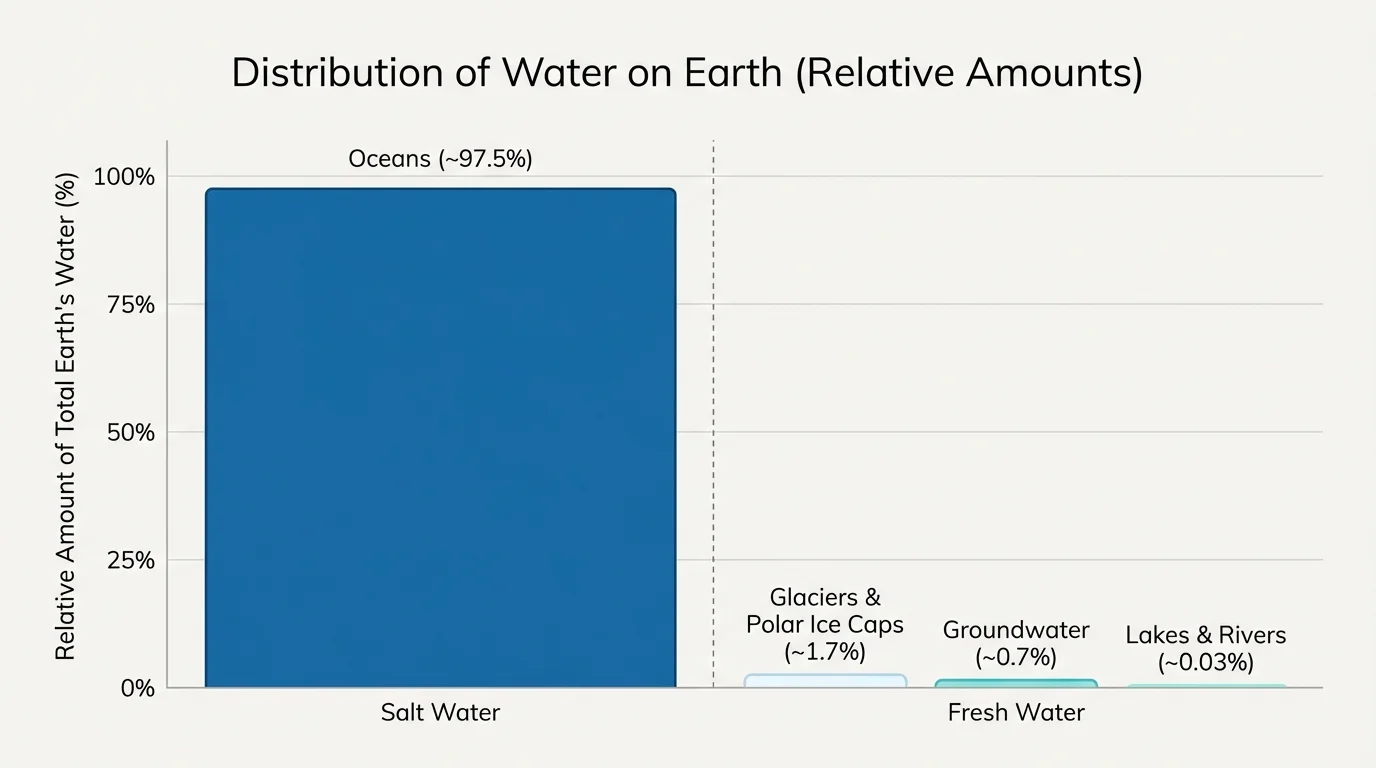
[Figure 1] When we look at Earth's water this way, we learn an important scientific idea: the total amount of water can be very large, while the amount that is easy for humans to use can still be very small.
Earth's main water reservoirs include oceans, glaciers, polar ice caps, groundwater, lakes, and rivers. In a comparison graph, the ocean bar towers over the others because the oceans contain by far the greatest amount of water on Earth. The freshwater reservoirs are much smaller by comparison, even though they are extremely important.
The ocean is the largest water reservoir on Earth. Oceans contain salt water, not fresh water. This is why having a planet full of water does not mean all that water is ready to drink.
Glaciers and polar ice caps store large amounts of fresh water in frozen form. A glacier is a large, moving mass of ice on land. Polar ice caps are huge areas of ice around Earth's poles. This water is fresh, but because it is frozen, it is not as easy to use as liquid water in a river or lake.
Groundwater is fresh water stored beneath Earth's surface in spaces between soil and rock. People often get groundwater by drilling wells. Even though we cannot usually see it, groundwater holds much more fresh water than lakes and rivers do.
Lakes and rivers are the freshwater reservoirs people notice most easily because they are on the surface. They are important for ecosystems and human use, but they contain far less water than oceans, glaciers, polar ice caps, or groundwater.
This uneven distribution is one of the biggest ideas in Earth science. Earth's water is not spread out evenly among reservoirs. Instead, most is concentrated in the oceans, and most fresh water is concentrated in ice and underground storage.
Some communities depend almost completely on groundwater from wells, even though many people rarely think about underground water when they picture Earth's water supply.
The pattern in [Figure 1] helps us make a strong claim supported by evidence: the reservoirs people see every day, such as rivers and lakes, are not the places where most of Earth's water is stored.
Salt water and fresh water are not distributed equally on Earth. The oceans hold salt water, and because oceans are the largest reservoir, most of Earth's water is salt water.
Fresh water is found in glaciers, polar ice caps, groundwater, lakes, and rivers. However, the freshwater reservoirs are not all the same size. Much of the fresh water is stored as ice or underground, while only a small amount is found in lakes and rivers.
Think of a grocery store with many shelves. One shelf is packed full, while several others have only a few items. Earth's water works in a similar way. The ocean "shelf" is packed with water, and some freshwater "shelves," especially lakes and rivers, hold much less.
Why fresh water can still be hard to use
Even when water is fresh, people may not be able to use it easily. Frozen water in glaciers and polar ice caps is difficult to reach and transport. Groundwater may be deep underground and require wells and pumps. Surface water in lakes and rivers is easier to reach, but there is much less of it.
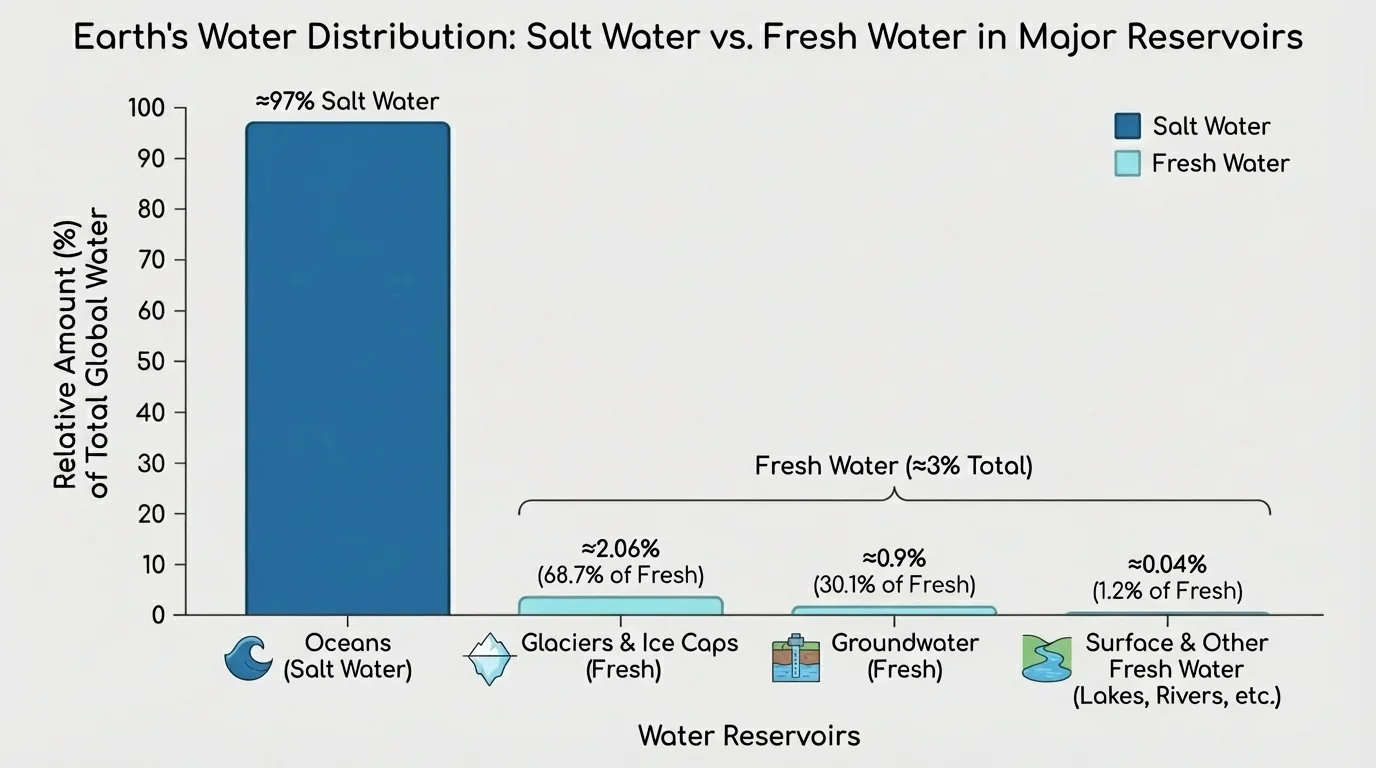
[Figure 2] That is why scientists do not only ask whether water is salty or fresh. They also ask where it is stored and how available it is to living things and human communities.
A bar graph is one of the best ways to compare Earth's water reservoirs, and it shows how the graph is organized with reservoir names on one axis and relative amount on the other. A graph lets us compare categories side by side. Instead of using a pie chart, which we are not using here, a bar graph makes it easier to see which reservoirs are much larger or much smaller than others.
When reading a graph about water reservoirs, start by looking at the labels. Each bar stands for one reservoir, such as oceans or lakes. Then compare the heights or lengths of the bars. A taller bar means a greater amount of water in that reservoir.
You do not need to calculate percentages to learn from the graph. You can use comparison words such as most, more, less, much more, and tiny amount. These words help describe the evidence clearly.
For example, if the ocean bar is far taller than every other bar, you can say, "The oceans contain most of Earth's water." If the lake and river bars are very short, you can say, "Lakes and rivers contain only a small amount of Earth's water."
Graphs are useful because they turn numbers or observations into a visual pattern. The pattern helps us make scientific claims based on evidence. When students explain a graph correctly, they are doing the work of scientists: observing, comparing, and communicating clearly.
Using evidence from a graph
A student looks at a bar graph of oceans, glaciers, polar ice caps, and groundwater, lakes, and rivers.
Step 1: Identify the tallest bar.
The tallest bar is the oceans.
Step 2: Compare freshwater bars.
The bars for glaciers, polar ice caps, and groundwater are much taller than the bars for lakes and rivers.
Step 3: Make a claim using evidence.
The student can say: most of Earth's water is in the oceans, and much of Earth's freshwater is in glaciers, polar ice caps, or underground.
As [Figure 2] makes clear, a graph does more than decorate information. It organizes evidence so we can compare reservoirs quickly and accurately.
Suppose you compare six bars: oceans, glaciers, polar ice caps, groundwater, lakes, and rivers. The graph shows one huge category and several much smaller ones. That pattern gives evidence that Earth's water distribution is very uneven.
From the graph, we can make several evidence-based statements. First, the oceans contain the greatest amount of water. Second, among freshwater reservoirs, glaciers, polar ice caps, and groundwater hold much more water than lakes and rivers. Third, lakes and rivers are important but contain only a small share of Earth's water.
This is a good example of how scientists use observations. We do not just say, "I think there is a lot of ocean water." We point to the graph and say, "The graph shows the ocean reservoir is much larger than the others."
When you use evidence, your explanation should match what you can observe. In science, a strong answer includes a claim and the data or pattern that supports it.
Scientists often compare reservoirs because comparison reveals hidden facts. Without a graph, a student may assume lakes and rivers hold a lot of fresh water because they are visible. But the graph shows that visible surface water is only a small part of the total freshwater supply.
The distribution of water affects where people live and how they get water. A town near a large lake may use surface water. Another town in a dry area may depend mostly on groundwater from wells.
In cold regions, huge amounts of fresh water may be stored in glaciers or ice caps. Even though that water exists, it is frozen and not always easy to collect. In some places, melting glaciers can feed rivers, but the glacier itself is a frozen reservoir.
Farmers also care about water distribution. Crops need fresh water, not salt water from the ocean. If a community has little rainfall and few rivers, it may need to pump groundwater for farming.
Case study: two different communities
Community A is near the ocean. Community B is far inland and uses wells.
Step 1: Compare the nearby reservoirs.
Community A has a huge amount of nearby ocean water, but it is salt water. Community B may have less visible water, but it can still have useful groundwater underground.
Step 2: Decide which water is easier to use for drinking.
Fresh groundwater is usually more useful for drinking than ocean water unless special treatment is used.
Step 3: Connect to Earth's distribution.
This example shows that the largest reservoir is not always the most useful for daily human needs.
These examples help explain why people protect lakes, rivers, and groundwater carefully. Even though these freshwater reservoirs are smaller than the oceans, they are essential for life.
A classroom model can help make the idea more concrete, and [Figure 3] shows one way to represent the same pattern seen in water-reservoir graphs. Use one large clear container to stand for the oceans. Then use much smaller containers for glaciers, polar ice caps, and groundwater, lakes, and rivers. When students place the containers side by side, the uneven pattern becomes easy to see.
In this model, the ocean container is the largest by far. The glacier and groundwater containers are much smaller than the ocean container but still clearly larger than the lake and river containers. The smallest containers represent lakes and rivers.
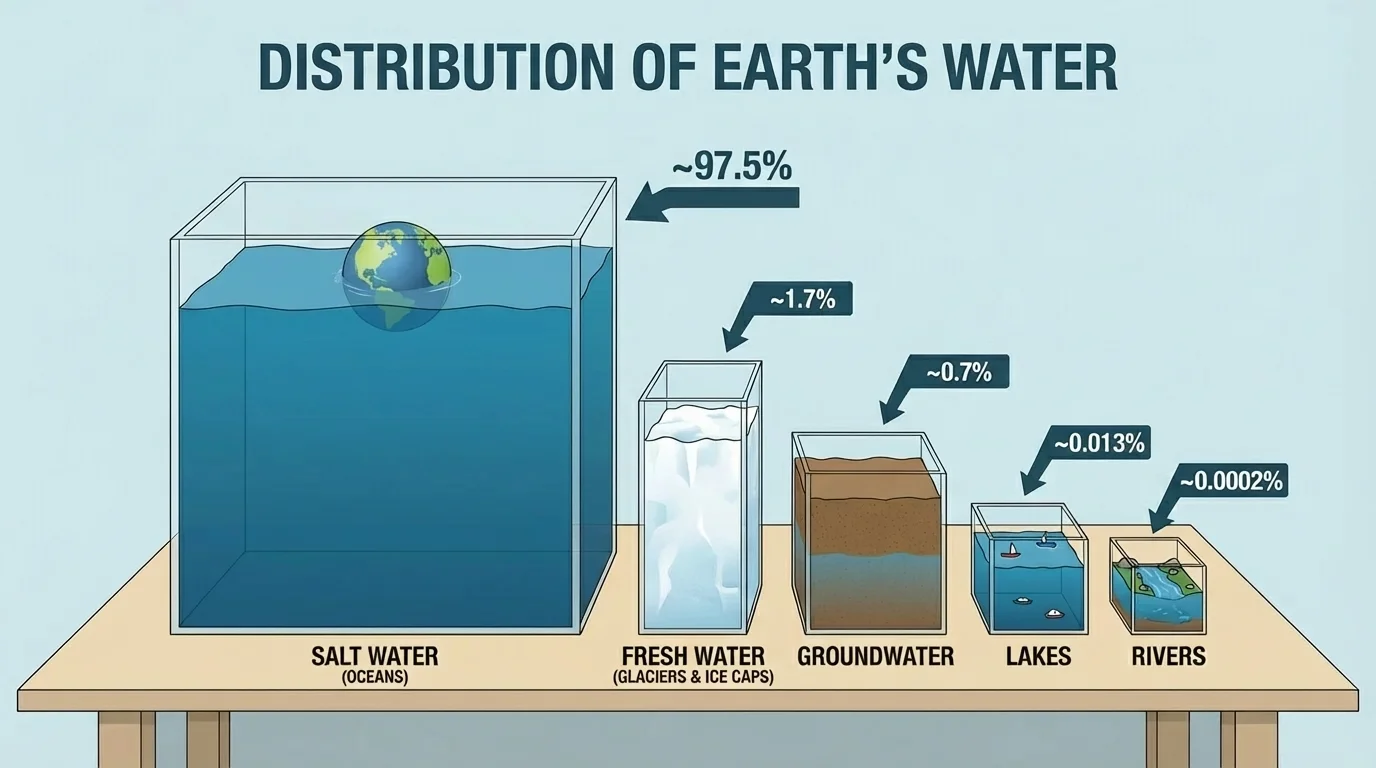
This kind of model does not need exact percentage calculations to be useful. Its purpose is to show relative amounts. Students can observe that one reservoir dominates and that some visible freshwater sources are actually quite small.
Later, when you look back at [Figure 3], the size differences among the containers match the main idea from the graphs: most water is in the oceans, and much of the fresh water is frozen or underground.
Fresh water is not gathered in one place. It is spread among glaciers, polar ice caps, groundwater, lakes, and rivers. These reservoirs differ in location, state, and availability.
| Reservoir | Type of Water | Where It Is Found | Relative Amount |
|---|---|---|---|
| Oceans | Salt water | Earth's surface | Greatest amount |
| Glaciers | Fresh water | On land, frozen | Large freshwater reservoir |
| Polar ice caps | Fresh water | Near the poles, frozen | Large freshwater reservoir |
| Groundwater | Fresh water | Underground | Large freshwater reservoir |
| Lakes | Fresh water | Surface water | Small amount |
| Rivers | Fresh water | Flowing surface water | Very small amount |
Table 1. Comparison of major water reservoirs by type, location, and relative amount.
Glaciers and polar ice caps hold fresh water as solid ice. Groundwater holds fresh water as liquid underground. Lakes and rivers hold fresh water at Earth's surface, where it is easier to see and often easier to use.
Because lakes and rivers are so visible, they can seem bigger in importance than in amount. But the evidence in [Figure 1] and the comparison in Table 1 both show that they hold much less water than glaciers, polar ice caps, and groundwater.
River water is always moving, which makes rivers very important for ecosystems and people even though rivers store only a very small amount of Earth's total water.
This is why careful reading of data matters. What we notice most easily is not always what exists in the greatest amount.
Scientists make claims based on evidence. In this topic, the evidence comes from comparing reservoirs and interpreting graphs or tables. A claim such as "Most of Earth's freshwater is in rivers" would not match the evidence. A better claim is "Much of Earth's freshwater is stored in glaciers, polar ice caps, and groundwater."
To support a claim, point to the pattern in the data. You might say, "The graph shows very short bars for lakes and rivers, but much taller bars for glaciers, polar ice caps, and groundwater." That statement uses evidence correctly.
This skill matters far beyond Earth science. In many subjects, students must read information, notice patterns, and explain what the evidence shows. Learning to interpret water-distribution graphs helps build that important habit of mind.
"The good thing about science is that it's true whether or not you believe in it."
— Neil deGrasse Tyson
When you describe and graph the amounts of salt water and fresh water in Earth's reservoirs, you are not just memorizing facts. You are learning how scientists use observations and visual evidence to explain the natural world.