A plastic bottle dropped on a sidewalk may seem unimportant, but if rain carries many bottles, wrappers, and chemicals into a storm drain, that small action becomes part of a much larger environmental problem. Scientists and engineers study these changes carefully because the environment is not just scenery—it is a connected system of water, air, soil, plants, animals, and people. To protect it, we need more than good intentions. We need evidence.
Human activities can change the Earth's surface and the biosphere in powerful ways. Building roads, using fertilizers, burning fuels, cutting forests, and throwing away waste can all alter habitats and natural cycles. Some changes happen quickly, like a fish kill after a chemical spill. Others happen slowly, like soil erosion or the buildup of carbon dioxide in the atmosphere. A scientific approach helps us monitor these changes and then design ways to reduce the damage.
Environmental problems are often hard to judge by sight alone. A stream may look clear but still contain harmful nitrates or low oxygen levels. A park may seem healthy, yet trampling from thousands of shoes can compact soil so tightly that roots cannot grow well. That is why a monitoring method is so important. Monitoring means collecting information over time to detect change.
Good monitoring answers questions such as: What is changing? How much is it changing? Is the change linked to human activity? Is the impact getting worse, staying the same, or improving? These questions help scientists separate guesses from conclusions. They also help communities decide what action to take.
Human impact means a change in the environment caused by human actions. Environmental indicator means a measurable sign of environmental condition, such as water clarity, number of insects, amount of trash, or air particle levels. A variable is something in an investigation that can change or be measured.
Not every environmental change affects living things in the same way. Extra nutrients in water from fertilizer may cause algae to grow fast. That might seem harmless at first, but when the algae die and decompose, oxygen in the water can drop. Fish may suffer, while some bacteria increase. In other words, one change can help some organisms and harm others.
A ecosystem includes living things and the nonliving parts of their environment interacting together. Human impacts on ecosystems come in many forms. Some of the most common are pollution, habitat destruction, overuse of resources, and the introduction of invasive species.
Pollution includes harmful substances or energy added to the environment. Water pollution may include fertilizers, oil, soap, or heavy metals. Air pollution can include smoke, dust, and gases such as particulate matter and nitrogen dioxide. Soil pollution can come from spills, litter, or pesticides.
Habitat loss happens when natural areas are cleared, paved, drained, or fragmented. A forest split by roads may still look green from above, but animals that need large connected habitats may no longer survive there. Resource overuse happens when people remove water, fish, trees, or minerals faster than natural systems can replace them. Erosion can speed up when plants are removed and soil is left exposed to wind or running water.
Some impacts are local, such as trash around a schoolyard. Others are regional or global, such as increased greenhouse gases. Burning fuels add \(\textrm{CO}_2\) to the atmosphere. Because \(\textrm{CO}_2\) absorbs heat energy, an increase in its concentration can contribute to climate change. Chemical formulas matter in environmental science because they help identify the substances involved, such as \(\textrm{H}_2\textrm{O}\) for water and \(\textrm{CO}_2\) for carbon dioxide.
One muddy footprint on a stream bank may not matter much, but repeated trampling by many visitors can destroy plants that normally hold soil in place. Then rain washes more sediment into the stream, and the water can become cloudy enough to block sunlight from aquatic plants.
Because impacts vary, scientists do not use just one type of evidence. They measure the part of the environment that is most closely connected to the question they are studying.
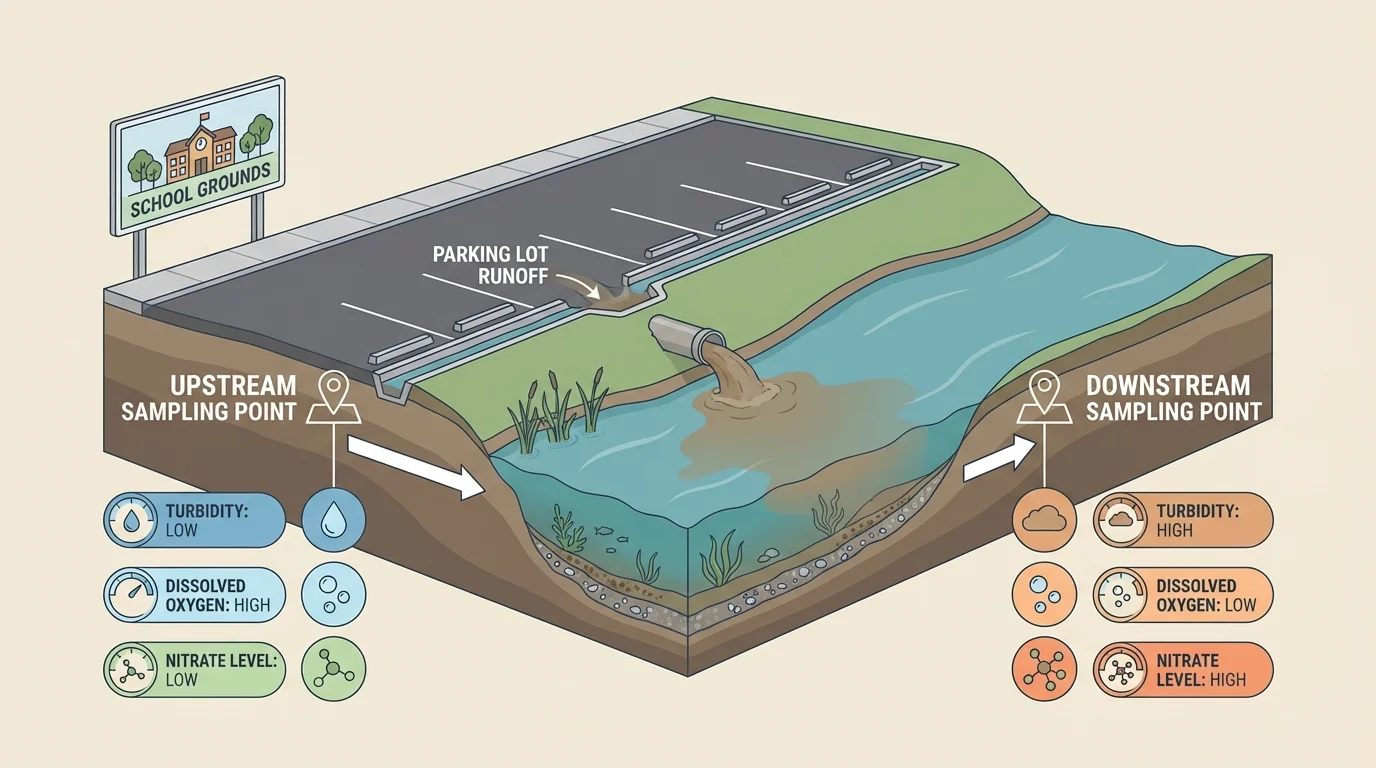
Scientists compare conditions across time and place, as [Figure 1] shows for a stream study with more than one sampling point. If students want to know whether runoff from a parking lot affects a stream, they should not measure only one cup of water one time. They need a plan that includes where, when, and how often to collect data.
A strong monitoring method begins with a clear question. For example: "How does litter from lunch areas affect the amount of trash entering the storm drain?" or "Does traffic near the school increase air pollution during arrival and dismissal times?" Next comes choosing indicators. For water, indicators might include temperature, pH, dissolved oxygen, turbidity, or nitrate level. For land, indicators might include plant cover, soil compaction, and number of species observed. For air, indicators might include particle count or gas concentration.
Scientists also collect baseline data. Baseline data are measurements taken before a change happens, or from a comparison site that is less affected. Without baseline data, it is hard to tell whether current conditions are unusual. If a school starts a recycling program, measuring waste only after the program begins does not reveal how much changed. Measurements from before the program are needed too.
Reliable monitoring uses repeated measurements. One unusually windy day can raise dust levels. One heavy rainstorm can make water more turbid. Repeating observations helps reduce the chance that a single unusual event will mislead us. Scientists often calculate an average to represent a typical result. The average is found by adding the measurements and dividing by the number of measurements.
For example, suppose turbidity readings from a stream on three days are \(2\), \(4\), and \(6\) units. The average turbidity is \(2 + 4 + 6 = 12\), and \(12 \div 3 = 4\). Written in one expression, \(\dfrac{2 + 4 + 6}{3} = 4\). This average gives a clearer picture than using only one day's reading.
Scientists also try to keep tests fair. If one group measures water at 8 a.m. and another measures at 4 p.m., temperature differences might affect the results. If different tools are used in different ways, the comparison becomes weaker. Fair tests keep as many conditions the same as possible except for the factor being studied.
Evidence is stronger when it is systematic. A single observation can start an investigation, but patterns across multiple places and times create stronger evidence. Scientists trust methods that are repeatable, use clear variables, and produce data others can check.
Another useful idea is sampling. It is usually impossible to measure every square meter of a field or every drop of water in a pond. Instead, scientists choose a sample that represents the larger area. If the sample is chosen carefully, the data can still be useful.
A good environmental investigation follows an organized sequence, as [Figure 2] illustrates. The goal is not just to collect data, but to collect the right data in a way that answers the question clearly.
Step 1: Identify the human activity and the possible environmental effect. For example, cafeteria waste may increase landfill trash. Heavy foot traffic may reduce plant cover. Vehicle idling may increase air pollution.
Step 2: Write a testable question. A strong question is specific. "How can we help the environment?" is too broad. "How does vehicle idling near the school entrance affect particle levels during morning drop-off?" is much better.
Step 3: Choose the indicator or measurement. If the impact is water pollution, useful indicators may include turbidity or nitrate concentration. If the impact is habitat damage, useful indicators may include number of plant species, bare soil area, or the presence of an indicator species. An indicator species is an organism whose presence or absence gives clues about environmental conditions.
Step 4: Identify variables. The independent variable is the factor you change or compare, such as location near traffic versus farther away. The dependent variable is what you measure, such as particle count. Controlled variables are conditions you try to keep the same, such as sampling time or tool type.
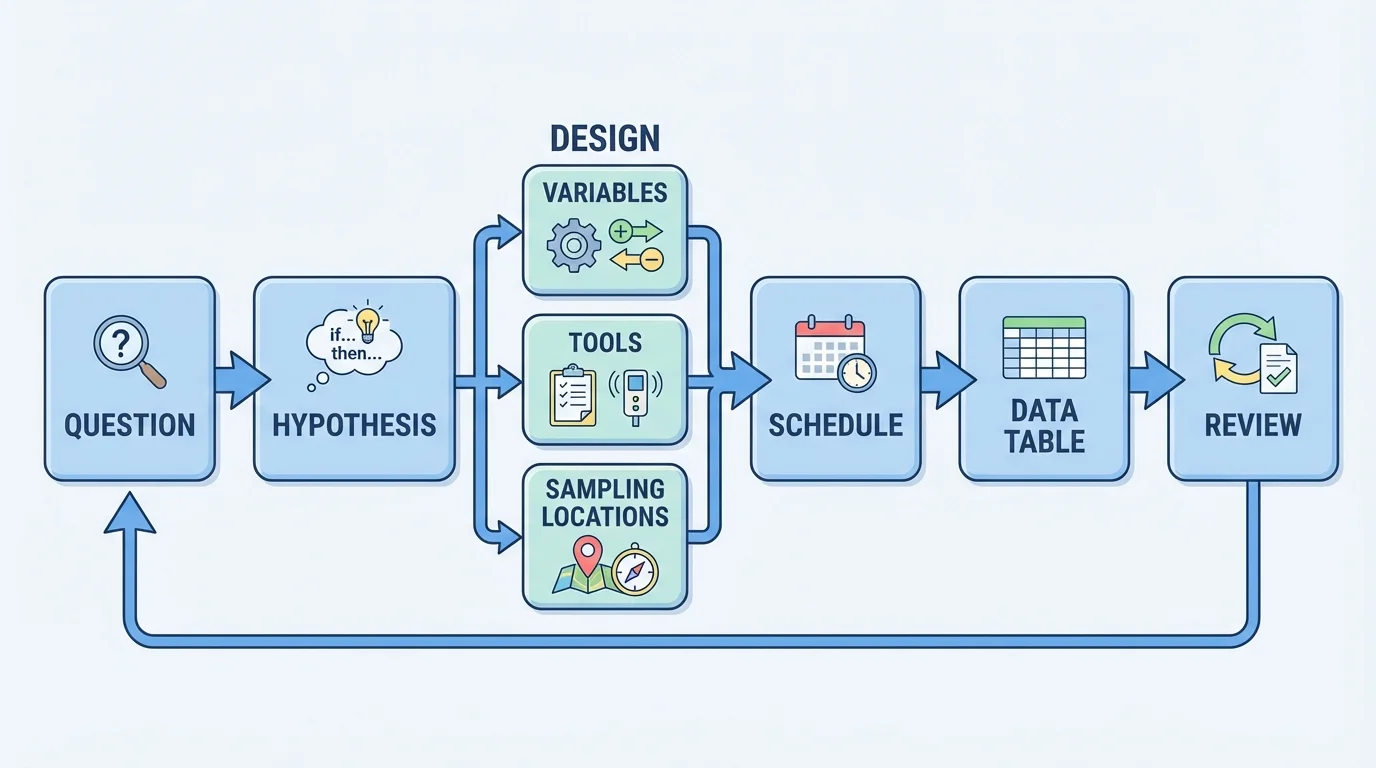
Step 5: Decide how and when to sample. Will you measure daily, weekly, or after rainstorms? Will you compare upstream and downstream locations? Will you count trash in the same area each time? A schedule matters because environmental conditions change.
Step 6: Choose tools and units. A thermometer measures temperature in degrees Celsius. A balance measures mass. Test strips may estimate pH or nitrate level. A quadrat, which is a square frame placed on the ground, can help estimate plant cover in a small area. If one trash bag has a mass of \(3\ \textrm{kg}\) and another has a mass of \(5\ \textrm{kg}\), the total mass is \(3 + 5 = 8\ \textrm{kg}\).
Step 7: Plan for safety and accuracy. Students should wear gloves when handling litter, avoid fast-moving water, and follow school rules during outdoor investigations. Accuracy improves when instruments are used correctly and data tables are prepared before collecting samples.
Case study: Monitoring school litter near storm drains
A class wants to know whether lunch-area litter is washing into a storm drain after rain.
Step 1: Define the question
The class asks, "How does the amount of litter near the lunch area change before and after rainy days?"
Step 2: Choose measurements
Students count litter pieces in the same \(10\ \textrm{m} \times 10\ \textrm{m}\) area and record the mass of collected litter.
Step 3: Set a schedule
They collect data every Friday for four weeks and also on the day after each rainfall.
Step 4: Compare results
If the count rises from \(12\) pieces before rain to \(27\) pieces after rain, the increase is \(27 - 12 = 15\) pieces.
The class can then decide whether better bins, signs, or cleanup routines reduce the problem.
When this type of plan is repeated over time, students can tell whether the litter problem is random or part of a clear pattern.
Collecting numbers is only the beginning. Data become evidence when they are organized and interpreted. Tables, graphs, and simple calculations help reveal patterns. If dissolved oxygen falls whenever water temperature rises, that pattern suggests a relationship worth investigating.
Suppose a class measures the mass of cafeteria trash for five days: \(18\), \(20\), \(17\), \(19\), and \(16\ \textrm{kg}\). The average daily trash mass is \(\dfrac{18 + 20 + 17 + 19 + 16}{5} = \dfrac{90}{5} = 18\ \textrm{kg}\). If a new sorting system later reduces the average to \(11\ \textrm{kg}\), then the change is \(18 - 11 = 7\ \textrm{kg}\) less trash per day.
Scientists often calculate a percent decrease to compare improvement.
\(\textrm{Percent decrease} = \dfrac{\textrm{original} - \textrm{new}}{\textrm{original}} \times 100\)
Using the trash example, \(\dfrac{18 - 11}{18} \times 100 = \dfrac{7}{18} \times 100 \approx 38.9\). So the trash decreased by about \(38.9\%\).
| Measurement goal | Possible data | Why it helps |
|---|---|---|
| Water quality | Turbidity, pH, nitrate level, dissolved oxygen | Shows whether runoff or waste may be affecting aquatic life |
| Air quality | Particle count, nitrogen dioxide level, visibility | Shows possible effects of traffic or smoke |
| Land condition | Plant cover, soil compaction, litter mass | Shows habitat damage or recovery |
| Biodiversity | Number of species, presence of indicator species | Shows how living things respond to change |
Table 1. Examples of environmental monitoring goals, the data collected, and the reason those data are useful.
Patterns matter more than isolated numbers. Returning to the stream study in [Figure 1], if upstream water stays clear while downstream water becomes more turbid after storms, that comparison strengthens the claim that runoff is contributing to the problem.
You already know that matter and energy move through Earth systems. Environmental monitoring applies that same idea: changes in land, water, or air often spread through connected systems rather than staying in one place.
Scientists must also think about error. A reading may be inaccurate because of a faulty tool, poor timing, or inconsistent methods. That does not make science useless. It means conclusions should be based on multiple pieces of evidence, not one number.
Environmental problem solving is a cycle, not a one-time fix. After monitoring identifies a problem, students and engineers can design a way to reduce the impact, test whether it works, and then improve the solution if needed.
A useful solution should match the evidence. If litter enters drains during rain, adding educational posters alone may not be enough. Covered bins, more frequent cleanup, and drain screens might work better. If a trail is causing erosion, managers might build a boardwalk, add barriers, or reroute visitors. If idling cars raise air pollution, a no-idling zone and pickup redesign may help.
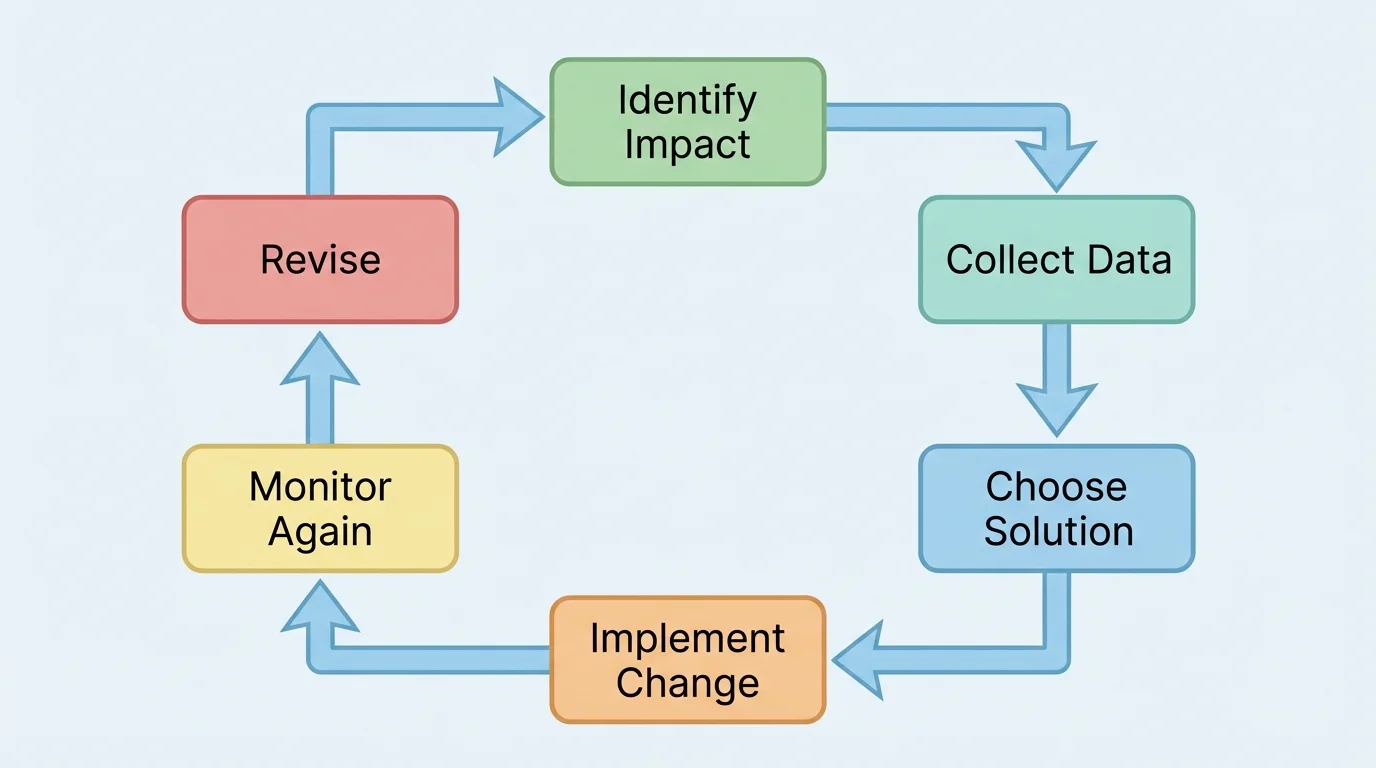
[Figure 3] Scientists and engineers also evaluate trade-offs. A trade-off is a compromise in which solving one problem may create a different cost or limitation. For example, installing bright lights may improve safety on a path but disturb nocturnal animals. Building a wall to reduce traffic noise may require removing vegetation. Good design tries to reduce harm overall, not just shift it elsewhere.
When choosing a solution, it helps to ask: Is it effective? Is it safe? Is it affordable? Is it realistic for this location? Can it be maintained? Will it help most organisms involved, or only some? These questions connect science with engineering and decision-making.
Minimizing impact requires feedback. A design is not proven successful just because it sounds reasonable. It must be followed by more monitoring. If the measured indicator improves, the design may be working. If not, the plan should be revised.
For example, suppose a school installs refill stations to reduce plastic bottle waste. Before the change, students collect \(150\) plastic bottles per week. After the change, they collect \(90\) bottles per week. The reduction is \(150 - 90 = 60\) bottles per week. That evidence suggests the stations are helping, although the school may still need education campaigns to reduce waste further.
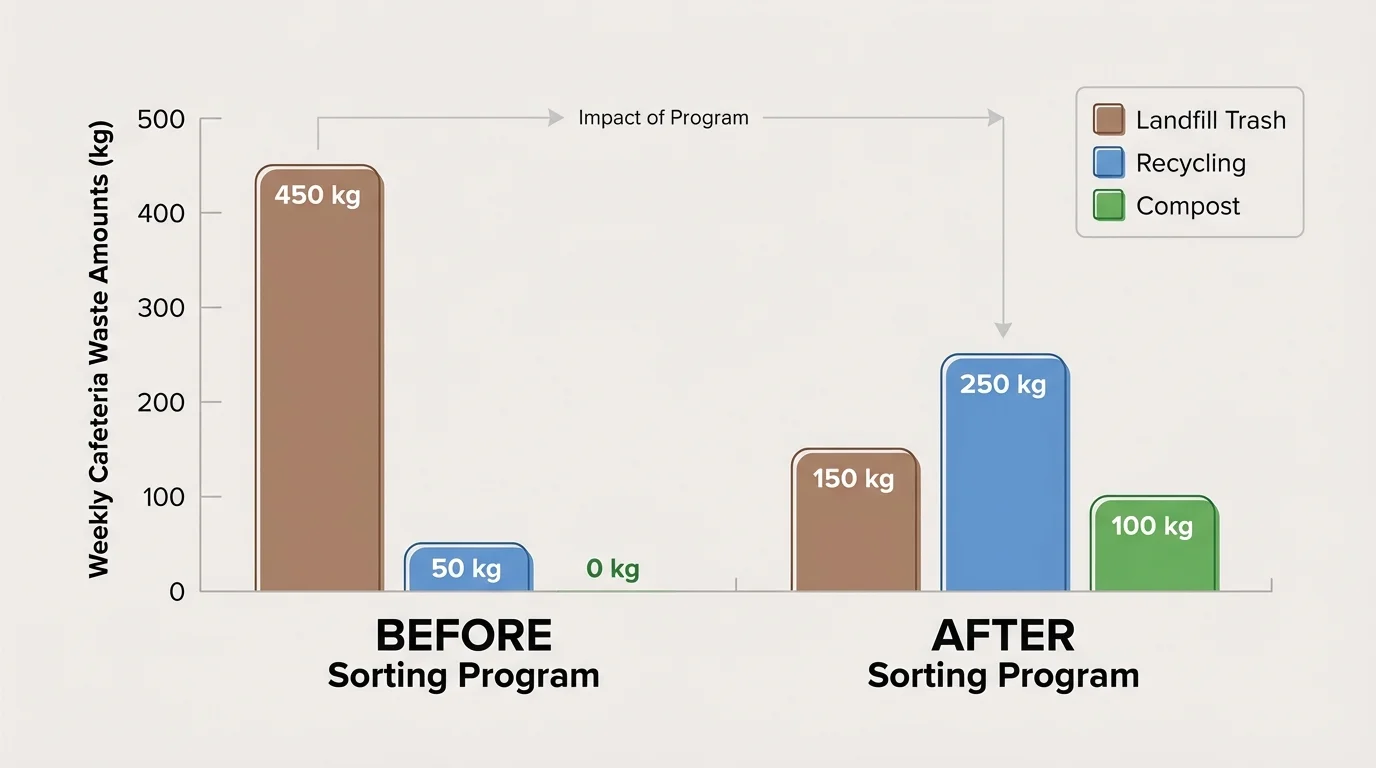
One of the easiest human impacts for students to study is waste. Data can reveal whether a solution truly reduces impact, as [Figure 4] demonstrates in a before-and-after graph. A cafeteria often produces trash, recyclable material, and food scraps. If everything goes into one bin, much of it ends up in a landfill.
A school can monitor this by measuring the mass of landfill trash, recycling, and compost each week. Then it can introduce labeled bins, student helpers, and clearer signs. If landfill trash decreases while compost and recycling increase, the system is likely reducing environmental impact.
Another case study involves stream pollution. Students may compare water quality upstream and downstream from a storm drain. If turbidity and nitrate levels are consistently higher downstream after rain, the likely cause is runoff from paved surfaces or nearby lawns. A minimization plan might include planting buffer vegetation, reducing fertilizer use, or redirecting runoff into rain gardens.
Air quality near traffic is another strong example. Students can compare particle levels at the school entrance during pickup time and at a field farther away. If levels near traffic are regularly higher, a school might reduce idling and redesign traffic flow. Later measurements can show whether the change works.
Parks also provide useful evidence. If a popular shortcut path has more bare soil and fewer plants than nearby protected areas, then foot traffic is likely causing habitat damage. Managers may install signs, fences, or stepping paths to guide movement. Some plants may recover quickly, while others may not. This reminds us that environmental recovery can take time.
Later, when comparing the success of a waste-reduction plan, students can return to [Figure 4] to see how before-and-after data make the change visible. A graph does not replace evidence collection, but it makes patterns much easier to recognize.
Case study: Testing a no-idling zone
A class investigates whether asking drivers to turn off engines lowers particle levels near the school entrance.
Step 1: Collect baseline data
Students measure particle counts for five mornings before the change. The average is \(45\) units.
Step 2: Apply the solution
The school posts signs and staff remind drivers not to idle.
Step 3: Monitor again
After one week, the new average is \(30\) units.
Step 4: Interpret the result
The decrease is \(45 - 30 = 15\) units. The percent decrease is \(\dfrac{15}{45} \times 100 = 33.3\%\).
The class now has evidence that the no-idling zone may be reducing air pollution.
These examples show that science is not only about noticing problems. It is also about designing practical, testable responses.
Even well-designed investigations have limits. Weather changes, seasonal differences, and natural variation can affect results. A pond may be warmer in late spring than in early winter even without human impact. That is why scientists compare similar times, use repeated measurements, and state uncertainty honestly.
Different living things also respond differently. A wetland restoration may increase frog populations but reduce open muddy areas used by some birds. A new shade tree may cool a playground but compete with nearby grass for water. Environmental decisions often involve balancing needs across species and people.
Scientific principles help us make those decisions more carefully. Evidence, controlled comparisons, repeated measurement, and revision are the tools that turn environmental concern into meaningful action. The same approach can be used for a schoolyard, a neighborhood stream, a city park, or much larger environmental issues.
"What gets measured gets managed."
— Common principle in science and engineering
When people monitor human impacts and adjust their solutions based on evidence, they become problem-solvers rather than bystanders. That is one of the most powerful uses of science.