When two skateboards collide, why does the heavier, faster one usually keep going while the lighter, slower one bounces back? ⚡ The answer is in a kind of energy called kinetic energy, and one of the best ways to understand it is by looking at graphs that show how it changes.
Energy shows up all around you: in moving cars, stretched rubber bands, batteries, food, and even in the position of a book on a shelf. Scientists often split energy into two big groups: energy of motion and energy of position or condition.
Kinetic energy is the energy an object has because it is moving.
Potential energy is stored energy that an object has because of its position or condition.
When a soccer ball is lying still on the ground, it has almost no kinetic energy, because its speed is basically zero. When you kick it and it flies across the field, it now has kinetic energy because it is moving.
A roller coaster at the top of a hill has a lot of gravitational potential energy because of its height. As it goes down the hill, that stored energy is transferred into kinetic energy: the coaster speeds up. At the bottom of the hill, most of that potential energy has turned into kinetic energy.
To follow this lesson, it helps to remember that energy can be transferred or transformed but is conserved in a closed system. That means the total amount of energy stays the same, but it can move from one object to another or change forms (for example, from potential to kinetic).
In this lesson, we focus on how the kinetic energy of an object relates to two things: its mass and its speed. Instead of doing algebra, we will use tables and graphs to see these relationships clearly.
Two basic ideas help us describe motion in science: mass and speed.
Kinetic energy depends on both mass and speed working together. If either one changes, the kinetic energy changes too.
Mass is the amount of matter in an object. A bowling ball has more mass than a tennis ball. If both are moving at the same speed, the bowling ball is harder to stop because it has more mass and, therefore, more kinetic energy.
Speed is how fast an object is moving, usually described as "distance per unit of time," such as meters per second or miles per hour. If you ride your bike faster, your speed increases. At higher speed, the bike and you together have more kinetic energy.
To see patterns in how kinetic energy changes with mass and speed, scientists often collect data and represent it using graphical displays such as bar graphs and line graphs. These make relationships much easier to see at a glance. 📈
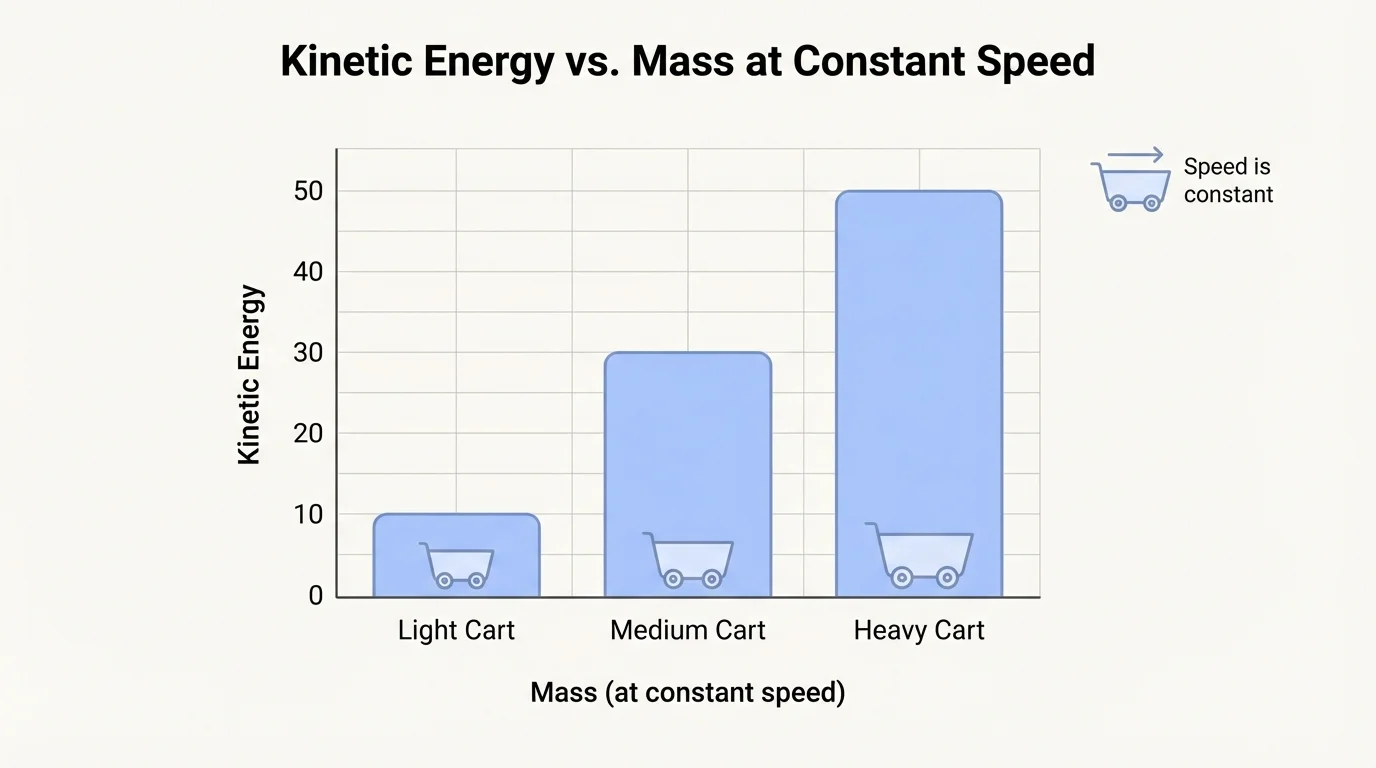
First, we look at how kinetic energy changes when mass changes but speed stays the same. Imagine three toy cars rolling at the same speed along a track. One is light, one is medium, and one is heavy. The heavier the car, the more it "hits" the block at the end of the track.
Scientists can measure how far the block moves to estimate the kinetic energy, as shown in [Figure 1]. Then they can graph kinetic energy against mass to look for patterns. In this kind of situation, we expect the graph to show that as mass increases, kinetic energy also increases.
Suppose an experiment with toy carts at the same speed gives data like this:
| Cart | Mass (relative units) | Kinetic Energy (relative units) |
|---|---|---|
| Light | 1 | 10 |
| Medium | 2 | 20 |
| Heavy | 3 | 30 |
Table 1. Sample data for kinetic energy vs. mass at constant speed.
This table shows a simple pattern: when mass doubles (from 1 to 2), kinetic energy also doubles (from 10 to 20). When mass triples (from 1 to 3), kinetic energy triples (from 10 to 30). In words, there is a direct relationship between mass and kinetic energy when speed is fixed: more mass means more kinetic energy in equal steps.
Example: Interpreting a bar graph of kinetic energy vs. mass
A student makes a bar graph of the data in Table 1. The x-axis has the three carts (Light, Medium, Heavy). The y-axis shows kinetic energy in relative units. The heights of the bars are 10, 20, and 30.
Step 1: Describe the trend you see.
The bars get taller as we move from Light to Medium to Heavy. This means kinetic energy increases as mass increases.
Step 2: Compare specific points.
The Medium cart's bar is twice as tall as the Light cart's bar. The Heavy cart's bar is three times as tall as the Light cart's bar.
Step 3: Explain what this means physically.
If all three carts roll at the same speed, the heavier carts have more kinetic energy and can push things harder when they collide.
From this graph, we conclude that, at a fixed speed, doubling the mass doubles the kinetic energy.
Later, when you look back at the bar graph in [Figure 1], you can read it quickly by remembering: taller bar = more kinetic energy; moving right (toward heavier mass) means increasing kinetic energy in equal steps.
Now we ask a different question: what happens to kinetic energy when we change the speed but keep the mass the same? This is where things get especially interesting. 🚴
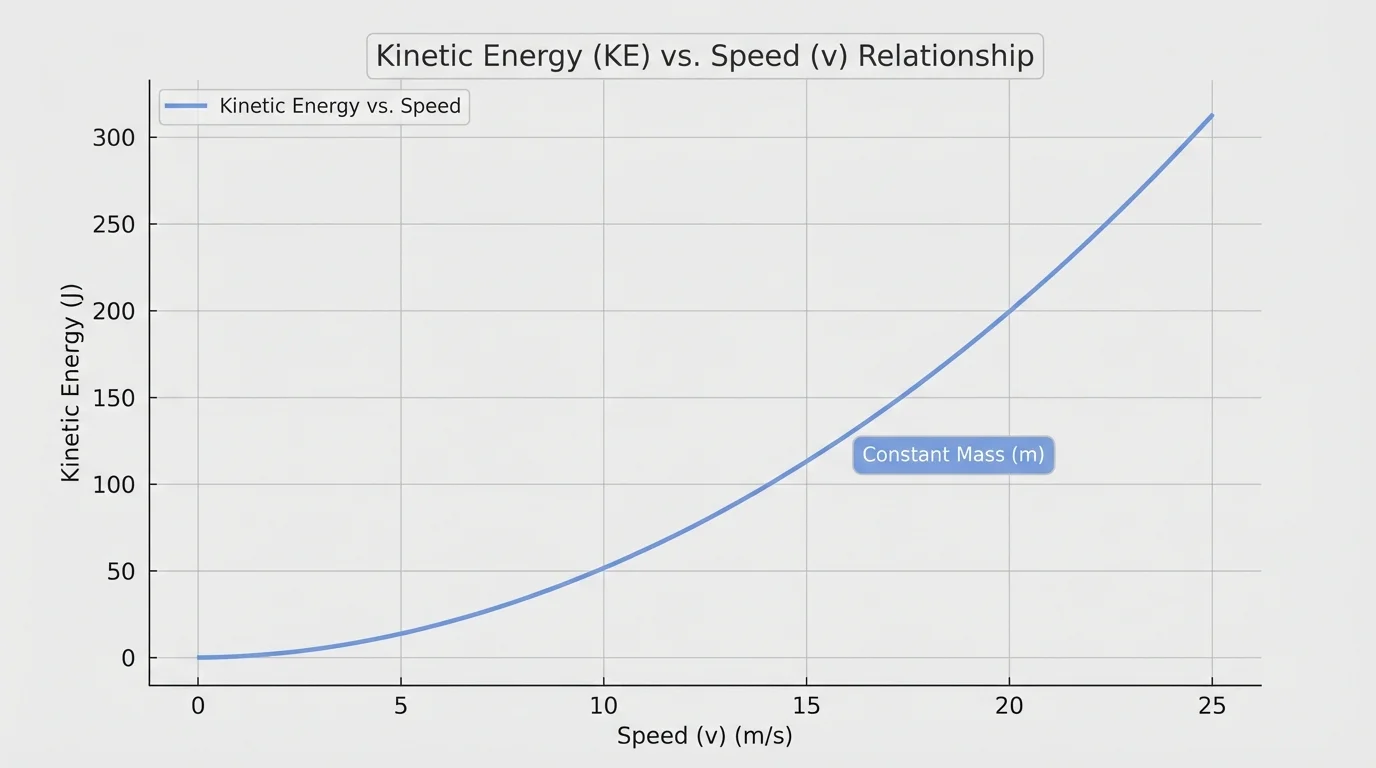
Imagine one bicycle ridden by the same person (so the total mass is constant). They ride at three speeds: slow, medium, and fast, on level ground. Sensors measure the kinetic energy each time, and the results are plotted as a line graph of kinetic energy vs. speed, like the one shown in [Figure 2].
A typical set of data (in simple relative units) could look like this:
| Speed (relative units) | Kinetic Energy (relative units) |
|---|---|
| 1 (slow) | 5 |
| 2 (medium) | 20 |
| 3 (fast) | 45 |
Table 2. Sample data for kinetic energy vs. speed at constant mass.
Notice that when speed goes from 1 to 2, kinetic energy jumps from 5 to 20, an increase of 15. When speed goes from 2 to 3, kinetic energy jumps from 20 to 45, an increase of 25. The increases get bigger as speed gets higher.
This tells us that kinetic energy does not increase in equal steps when speed increases. Instead, kinetic energy grows faster and faster as speed increases. In other words, changes in speed have a stronger effect on kinetic energy than equal changes in mass.
Example: Interpreting a line graph of kinetic energy vs. speed
For a 1 kg cart (same mass the whole time), a line graph shows three points: at speed 1, kinetic energy 5; at speed 2, kinetic energy 20; at speed 3, kinetic energy 45. A smooth curve connects them.
Step 1: Describe what happens as speed increases.
The points rise higher and higher. The line gets steeper. This means kinetic energy increases more quickly as speed increases.
Step 2: Compare the changes between points.
From speed 1 to 2, kinetic energy increases by 15. From speed 2 to 3, it increases by 25. The second jump is larger, even though the change in speed is the same (1 unit).
Step 3: Explain this in words.
Increasing speed a little when you are already moving fast adds much more kinetic energy than increasing speed the same amount when you are moving slowly.
From this graph, we conclude that, for the same mass, speed changes kinetic energy very strongly, and the relationship is more than just "double the speed, double the energy."
When you look again at the curve in [Figure 2], remember: the curve bending upward means the effect of speed on kinetic energy keeps getting bigger.
Scientists use different kinds of graphs for different purposes. In this topic, we mainly see bar graphs and line graphs, and we compare them, as in [Figure 3].
| Graph Type | What It Shows Well | Example in This Topic |
|---|---|---|
| Bar graph | Comparing separate categories or objects | Kinetic energy of light, medium, and heavy carts at the same speed |
| Line graph | How a quantity changes continuously | Kinetic energy of one cart as speed increases smoothly |
Table 3. Comparing bar graphs and line graphs for kinetic energy relationships.
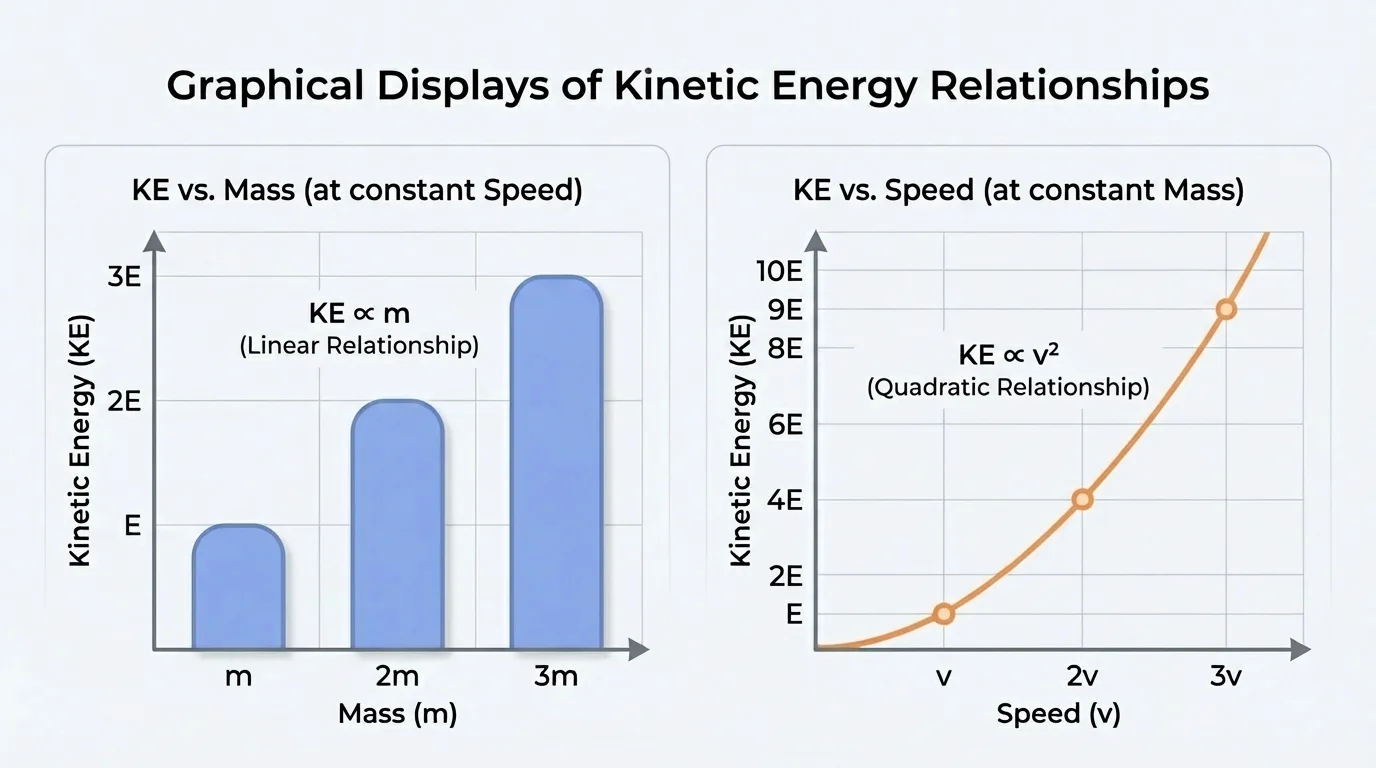
In the bar graph in [Figure 3], each bar stands for one cart with a specific mass. You compare heights to see which has more kinetic energy. In the line graph beside it, the curve shows how kinetic energy changes smoothly as speed changes.
When you interpret any graph about kinetic energy, mass, and speed, ask yourself:
Being able to read these graphs helps you explain real events: why car crashes at higher speeds are so dangerous, or why a fast baseball is harder to catch than a slow one, even if they have the same mass.
Even without doing formal calculations, you can investigate these ideas at school or at home (with adult supervision) and connect them to the real world. 🌍
One simple setup uses a ramp, a cart, and a stack of books as a bumper.
The distance the books move is related to how much kinetic energy the cart has. You can record the mass of the cart and how far the books move, then draw a bar graph similar to the one in [Figure 1]. You should see that more mass means the books move farther: more mass → more kinetic energy → more effect in a collision.
You can also explore speed:
When the cart starts higher (so it moves faster), the books move much farther. This is the strong effect of speed on kinetic energy, like in the curved line of [Figure 2].
Car safety engineers design crumple zones and airbags especially because kinetic energy increases so strongly with speed. Reducing speed even a little before a crash can remove a large amount of kinetic energy, making collisions less dangerous.
You see the same physics in sports: a slowly tossed basketball may bounce gently off your hands, but a fast, powerful pass can sting or even injure you. The ball's mass is the same, but its kinetic energy is much greater at higher speed.
Although state assessments do not require you to calculate kinetic energy using formulas, it is important to understand the relationships shown by graphs and data.
"Slowing down just a little can remove a lot of kinetic energy."
— Principle used in road safety campaigns
By carefully reading graphs and connecting them to motion, you can explain and predict how kinetic energy behaves without having to plug numbers into formulas. That skill is a big part of how scientists and engineers think about energy and design safer, more efficient systems. 💡