A city can seem safe and ordinary for years, and then suddenly an earthquake shakes the streets, a river spills over its banks, or a volcano sends ash into the sky. That may feel random, but it usually is not. Earth leaves clues. When scientists map where hazards happened in the past and connect those patterns to the forces shaping the land, they can make informed forecasts about where similar events may happen again.
A natural hazard is a natural event or process that can harm people, property, or ecosystems. Earthquakes, floods, landslides, volcanic eruptions, hurricanes, droughts, and wildfires are all hazards. A hazard becomes especially serious when people live, travel, farm, or build in places where that event can happen.
Scientists do not study only one storm, one eruption, or one earthquake. They study patterns. If many earthquakes have happened along the same fault, that fault remains important. If a town has flooded again and again because it sits on a river floodplain, that location remains at risk. Looking backward helps us look forward.
Hazard is a possible natural event that can cause harm. Risk is the chance that people or property will be harmed by that hazard. Vulnerability means how easily a place or population can be damaged. A disaster happens when a hazard causes major damage and people cannot easily cope with it.
For example, a strong earthquake in an empty desert is a hazard, but it may not become a major disaster because few people are affected. The same size earthquake under a crowded city can be far more damaging. This is why Earth science and human activity must be studied together.
Some hazards happen very quickly. Earthquakes may last seconds. Landslides can race downhill in minutes. Tsunamis can cross oceans in hours. Other hazards build slowly. Drought may grow over months, and coastal erosion may reshape shorelines over years. Fast or slow, each hazard leaves evidence in the landscape and in records kept by people.
Natural hazards can also be connected. A large earthquake under the seafloor can trigger a tsunami. Heavy rain can loosen soil and trigger landslides. A volcanic eruption can melt ice or snow and create dangerous mudflows. Earth systems interact, so scientists often map several hazards together instead of studying each one alone.
Some communities have stories, songs, or oral histories about past disasters that go back much farther than written records. Scientists sometimes compare these stories with rock layers and coastlines to learn about ancient tsunamis, eruptions, or floods.
That is one reason hazard maps matter so much. They can show not only where one kind of event occurred, but where several dangers overlap. A steep mountain valley near an active fault and a river channel may face earthquake, landslide, and flood hazards at the same time.
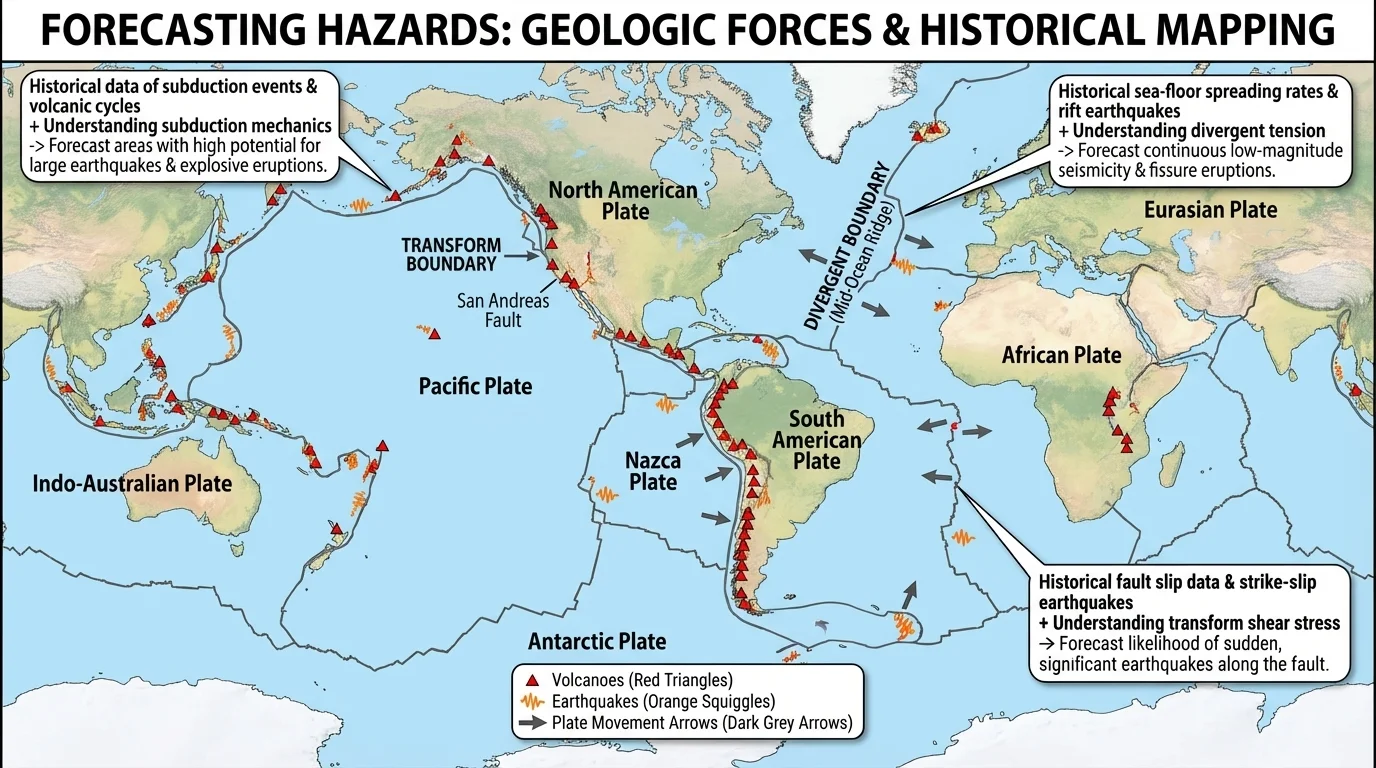
The deepest causes of many hazards come from the movement of Earth itself. plate tectonics is the idea that Earth's outer shell is broken into large plates that move slowly. Where plates meet, stress builds up, rocks crack, mountains rise, and magma can reach the surface. As [Figure 1] shows, many earthquakes and volcanoes cluster along these boundaries rather than being spread evenly across Earth.
At convergent boundaries, plates move toward each other. One plate may sink beneath another, a process called subduction. This can create deep ocean trenches, powerful earthquakes, and volcanic arcs. At divergent boundaries, plates move apart, allowing magma to rise and form new crust. At transform boundaries, plates slide past each other, often causing earthquakes along faults.
A fault is a crack in Earth's crust where rocks move. Faults do not always break the surface in obvious ways, but over time they shape valleys, ridges, and offsets in the land. Mapping faults helps scientists identify where future earthquakes are more likely, even if the last big quake happened long ago.
Volcanoes form where magma rises through the crust. Some volcanoes erupt often with smaller events. Others stay quiet for centuries before erupting. By mapping old lava flows, ash layers, and volcanic cones, geologists can identify which volcanoes are active and what areas were affected before. Those older deposits are clues to possible future danger zones.
Not all hazards come directly from plate boundaries. Weathering, erosion, and gravity also shape the land. In steep places, loose rock and wet soil can fail and slide downhill. On riverbanks and coastlines, running water and waves remove material. Over time, these processes create areas that are more likely to collapse, flood, or erode.
Later, when communities decide where to build, they still return to the same big pattern shown in [Figure 1]: hazards often gather where Earth's crust is active or where landforms are unstable.
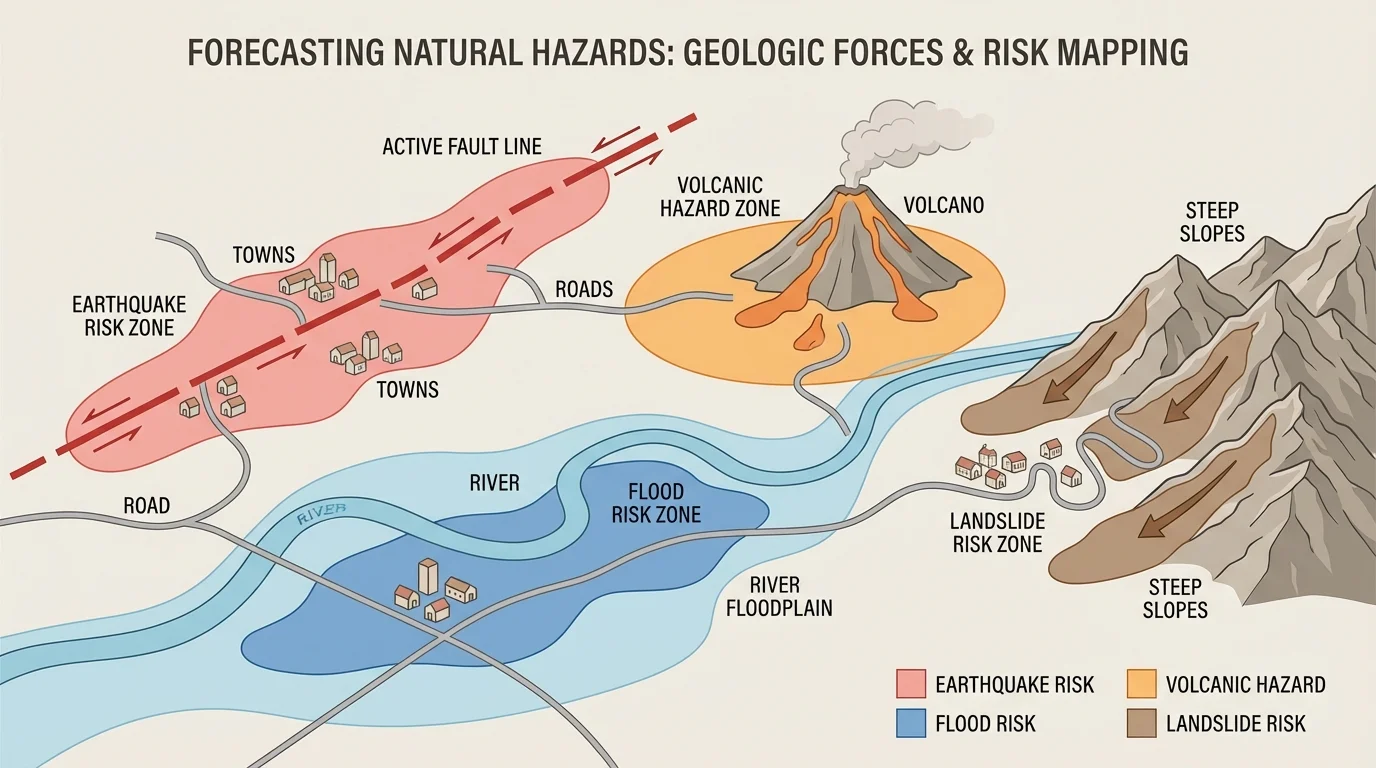
A hazard map shows where a natural hazard is likely to happen or where its effects may spread. As [Figure 2] illustrates, one map can combine several kinds of evidence: fault lines, river channels, steep slopes, coastlines, and towns. When these layers are compared, hidden patterns become much easier to see.
Suppose a region has an active fault running along a valley, a river that floods every few years, and steep hillsides above homes. Scientists can map the fault for earthquake risk, the floodplain for high water risk, and the slopes for landslide risk. The result is not just a picture. It is a tool for making decisions.
Maps can also show floodplain areas, which are flat lands beside rivers that flood naturally. These places are often good for farming because floods leave rich soil, but they can be dangerous places for homes and roads. Historical flood maps help people see how far water reached in past events.
On volcanoes, maps may show lava-flow paths, ashfall zones, and valleys where mudflows might travel. On coasts, maps may show low land vulnerable to storm surge or tsunami waves. In mountain regions, maps may mark unstable slopes where intense rain or shaking could trigger landslides.
Scientists use both natural clues and technology to make these maps. They study rock layers, river sediments, tilted ground, old shoreline marks, and landslide scars. They also use aerial photos, satellites, GPS measurements, and seismometers. A seismometer records ground shaking from earthquakes, helping scientists locate quakes and understand active areas.
Patterns in location matter. A single event can be surprising, but many events plotted on a map often form lines, clusters, or zones. A line of earthquake epicenters may mark a fault. A chain of volcanoes may reveal subduction. Repeated floods along the same river bends may show where water naturally spreads out during heavy rain.
When students look at maps carefully, they start to think like geologists: Why here? That question leads from the visible land to the hidden forces underneath it.
A forecast is a reasoned estimate about what may happen in the future, based on evidence. In hazard science, forecasting usually means estimating where an event is most likely and how likely it is over a certain time. It does not usually mean naming the exact day and hour.
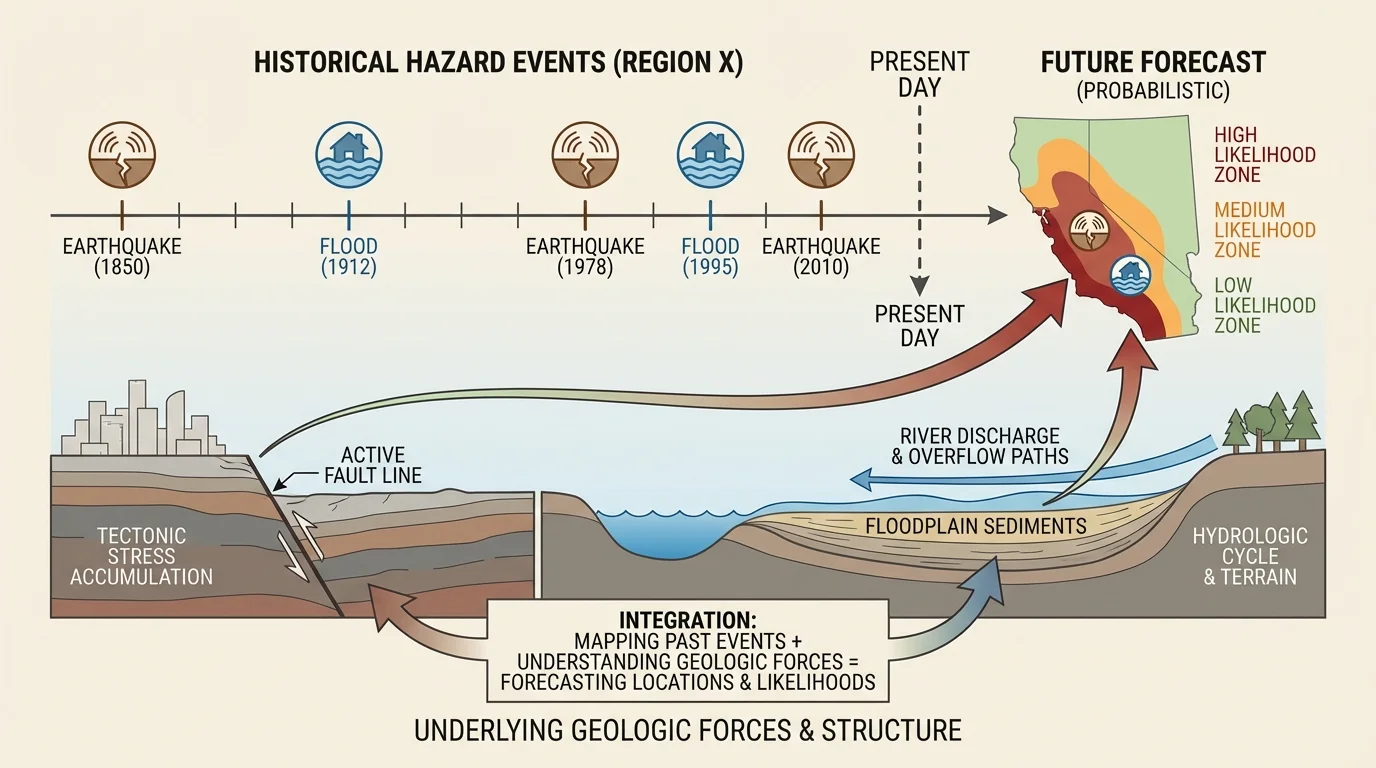
Scientists compare dates of past events to look for recurrence interval, the average time between similar events in one place. As [Figure 3] shows, these intervals are often uneven. A river may flood badly after two years, then after seven years, then after four years. The average can still help identify risk, even though nature does not run on a perfect schedule.
If a certain fault had large earthquakes about every 150 years on average, and the last one was 140 years ago, scientists do not say, "The earthquake will happen next Tuesday." Instead, they may say the chance is increasing. If a coast has been hit by strong hurricanes many times in the past, that coast remains more likely to be hit again than an inland region.
Scientists sometimes use simple probability ideas. If a town had 12 major floods in 60 years, the average rate is \(\dfrac{12}{60} = \dfrac{1}{5}\), or about one major flood every 5 years. That does not promise a flood exactly every fifth year, but it tells us flooding is common enough that planning is necessary.
To learn about hazards from before written history, geologists use natural records. Layers of sand left by tsunamis, buried soils from landslides, ash from eruptions, and broken tree rings from droughts all tell stories. In some regions, trenching across a fault exposes old layers that were offset by earlier earthquakes. This helps scientists estimate how often large quakes happened there.
Forecasting also improves when many kinds of evidence agree. For example, GPS may show plates still moving, earthquake records may show frequent small quakes, and maps may reveal an active fault crossing a city. Together, those clues strengthen the forecast. The timeline pattern in [Figure 3] matters most when it matches the landforms and measurements scientists see today.
Case study: estimating risk from repeated flooding
A river town kept records of 8 damaging floods in 40 years.
Step 1: Find the average rate.
The rate is \(\dfrac{8}{40} = \dfrac{1}{5}\), so the town has about 1 damaging flood every 5 years on average.
Step 2: Interpret the result.
This does not mean the river waits exactly 5 years between floods. It means flooding is frequent enough that homes, bridges, and evacuation plans should be designed with that risk in mind.
Step 3: Add map evidence.
If most floods reached the same low-lying neighborhoods, those places should be marked as high-risk zones on the hazard map.
The history and the map together give a stronger forecast than either one alone.
Even with excellent evidence, hazard forecasts always include uncertainty. Earth systems are complex, and small changes can alter timing and severity.
The west coast of North America experiences many earthquakes because it lies near active plate boundaries and faults. In California, the San Andreas Fault is a famous transform fault. Scientists map past earthquakes, fault traces, and ground movement to identify cities and infrastructure at risk. That is why earthquake drills and building codes are especially important there.
Japan and Indonesia provide strong examples of hazards linked to subduction zones. In these regions, one plate sinks beneath another, producing frequent earthquakes, volcanoes, and tsunamis. Hazard history in these places includes written records, tsunami stones, coastal deposits, and modern instrument data. These records help officials decide where sea walls, shelters, and warning systems are needed.
Large river systems such as the Mississippi, the Ganges-Brahmaputra, and the Yangtze flood naturally because rivers spread out across broad lowlands. Past flood maps show where water tends to move, collect, and linger. Even if a flood does not happen every year, repeated patterns reveal the danger of building in the lowest areas.
Mountain regions such as the Himalayas, the Andes, and parts of the Pacific Northwest face landslide hazards. Steep slopes, earthquakes, and heavy rain can combine to trigger slope failure. In such places, the same road or village may be threatened over and over because the land itself is unstable.
These regions differ in climate and geography, but they follow the same idea: when hazard history matches the geologic setting, forecasts become more reliable.
Students sometimes ask, "Why can't scientists predict the exact time of every earthquake or eruption?" The short answer is that the systems are too complicated. Stress builds underground where we cannot directly observe everything. Magma moves in hidden pathways. Weather patterns shift. Rocks and soils respond differently depending on water, temperature, and structure.
So scientists usually forecast in terms such as high probability, low probability, likely location, or return period. This is still extremely useful. A weather forecast does not need to tell the exact raindrop that will land on your sleeve in order to help you carry an umbrella. Hazard forecasts work in a similar way.
Earlier Earth science ideas still matter here: weathering breaks rock apart, erosion moves sediment, gravity pulls material downhill, and plate movement reshapes the crust. Natural hazards often happen where these processes interact.
Understanding uncertainty also helps people make smarter choices. If a map shows a slope has a high landslide risk, waiting for an exact date would be unsafe. It is better to stabilize the slope, change building plans, or monitor it closely.
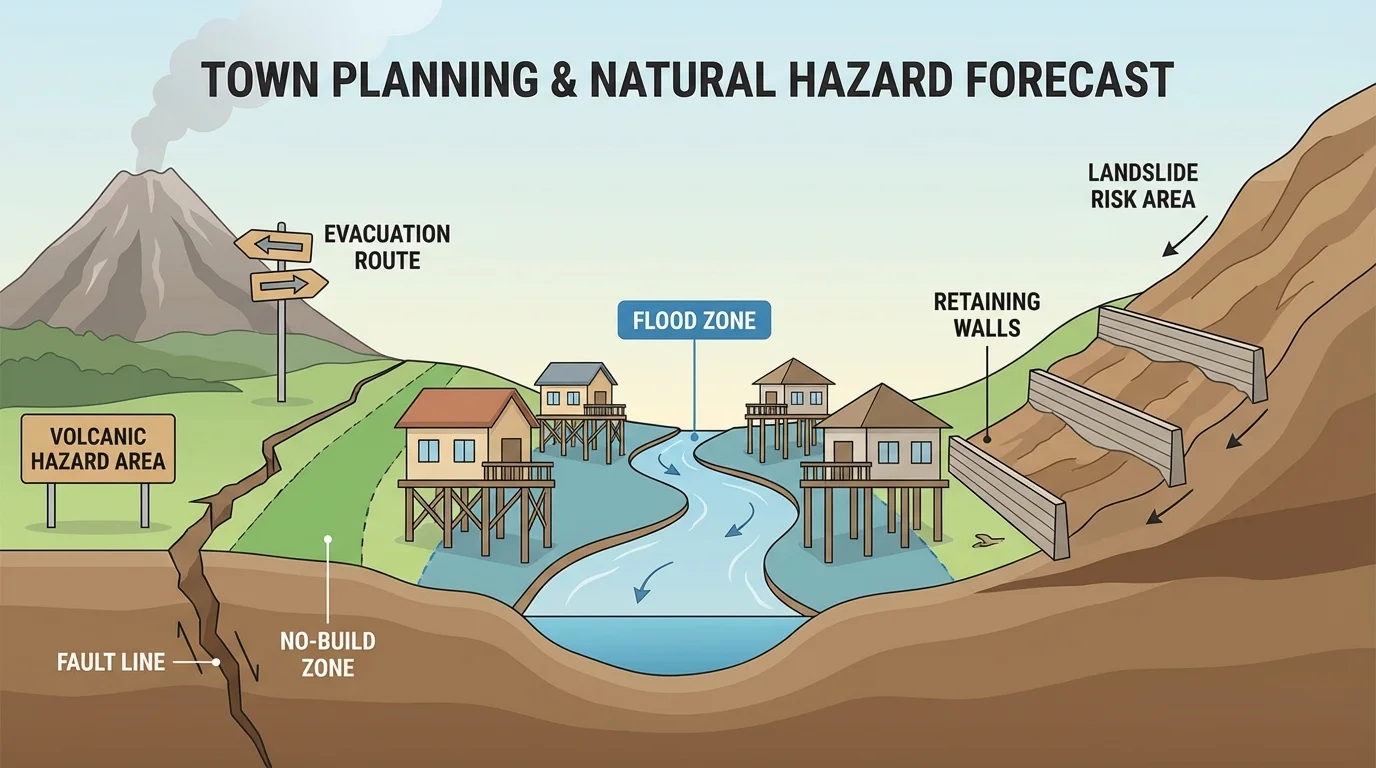
Forecasts are valuable because they guide action. As [Figure 4] shows, towns can use hazard maps to choose safer building sites, stronger designs, and better evacuation routes. The goal is not to stop natural processes. The goal is to reduce damage when those processes occur.
One major tool is land-use planning. This means deciding what kinds of activities happen in different places. A floodplain might be used for parks or farming instead of dense housing. A steep unstable slope might be left undeveloped. Buildings near earthquake faults may need stricter engineering rules.
Building codes are another important response. In earthquake-prone areas, buildings can be designed to sway without collapsing. In hurricane-prone regions, roofs and windows can be strengthened. In flood zones, homes may be raised above expected water levels. These choices come directly from learning where hazards happen and how severe they may be.
Monitoring and warning systems also depend on mapping and history. Seismometers detect earthquakes, stream gauges measure river height, satellites watch volcanic swelling, and weather satellites track storms. A warning system works best when scientists already know which locations are most at risk.
Emergency planning matters too. Schools practice earthquake drills. Coastal towns plan tsunami evacuation routes. Communities near volcanoes identify shelters and roadways. The safer town design in [Figure 4] reflects the basic idea that knowledge of past hazards changes how people prepare for future ones.
Real-world application: safer choices after mapping hazards
Step 1: Scientists map a valley and find an active fault, repeated floods, and a steep landslide-prone slope.
Step 2: Community leaders compare the map with where people live, where roads cross rivers, and where schools are located.
Step 3: They move a planned school away from the floodplain, reinforce bridges, and limit building on the unstable slope.
This does not remove the hazard, but it lowers the risk to people.
These decisions show the connection between Earth science and human activity. People cannot control plate motion or heavy rain, but they can control where they build, how they design structures, and how they prepare.
Human actions can increase or decrease hazard risk. Cutting down forests on steep slopes may increase erosion and landslides. Paving large areas can increase runoff and worsen flooding. Building on barrier islands or in floodplains places more people directly in harm's way.
On the other hand, people can reduce danger by restoring wetlands that absorb floodwater, planting vegetation that helps hold soil, enforcing safe building standards, and using maps to avoid the most hazardous zones. Scientific knowledge becomes most powerful when it leads to wise choices.
One of the biggest ideas in Earth science is that Earth is dynamic. Mountains rise, rivers shift, coasts change, and plates move continuously. Hazard mapping helps us see this motion through time. The map is really a history of Earth processes written across the land.
When scientists combine that history with an understanding of geologic forces, they do something very powerful: they turn evidence from the past into guidance for the future. They cannot remove uncertainty, but they can identify patterns, estimate likelihoods, and help communities live more safely on an active planet.