A patch of bright Arctic sea ice melts, and that local change can influence ocean temperature, wind patterns, ecosystems, and even the rate of future melting. Earth works like a connected network, not a collection of isolated parts. That is why geoscientists do more than describe events such as eruptions, floods, droughts, or ice loss. They analyze data to trace how one surface change can trigger feedbacks that amplify or reduce change across the atmosphere, hydrosphere, biosphere, cryosphere, and geosphere.
Earth's surface may seem stable when viewed over a school year or even a decade, but it is constantly changing. Rivers cut valleys, glaciers grind rock, coastlines erode, forests spread or disappear, and tectonic plates slowly rearrange continents. Some changes are sudden, like a volcanic eruption. Others unfold over thousands or millions of years, like mountain building or ice age cycles.
What makes geoscience especially powerful is that one observable change can help explain many others. A drought can reduce plant growth, exposing more bare soil. That bare soil can heat up faster, increasing local air temperature and decreasing moisture returned to the atmosphere by plants. Less moisture can mean less rainfall, which worsens the drought. This is a feedback: the original change produces additional changes that affect the original system.
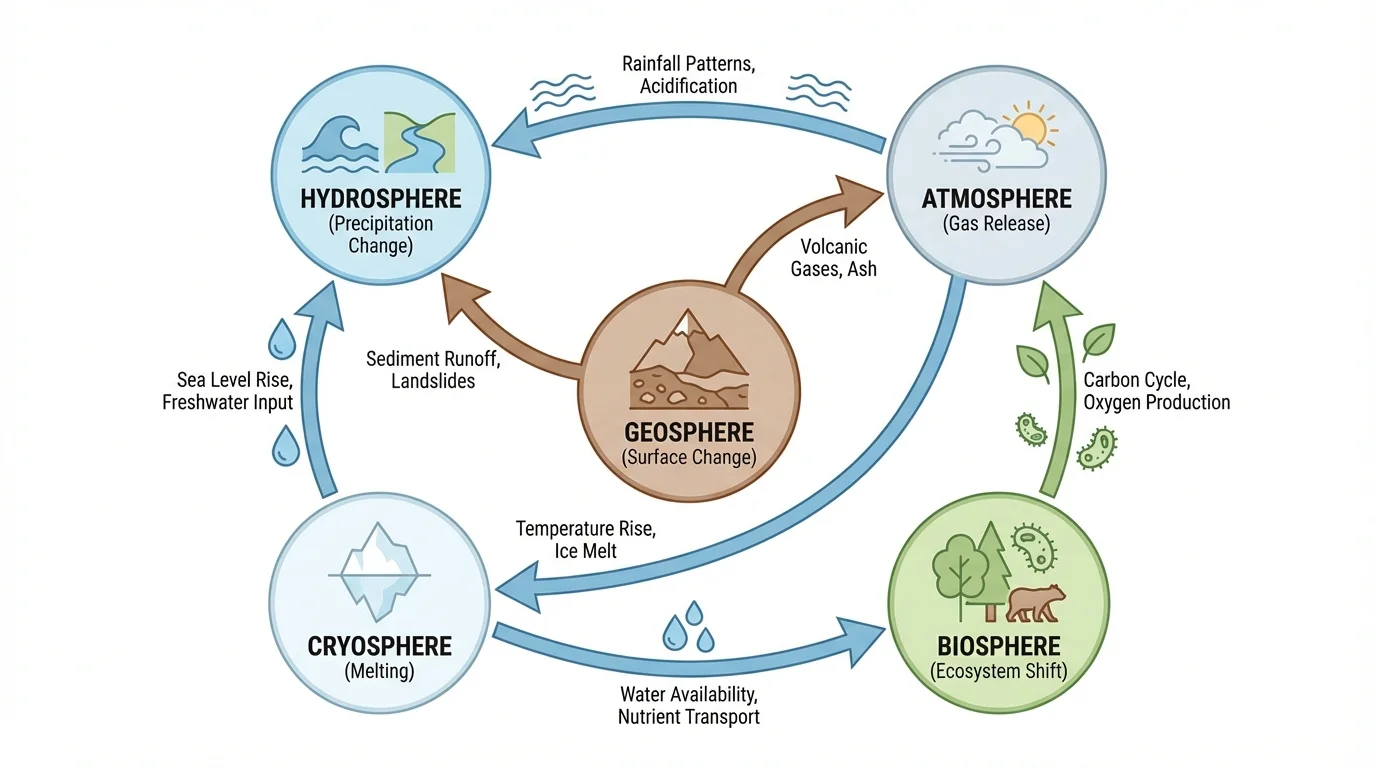
Earth behaves as an interacting system, as [Figure 1] shows, with matter and energy moving among major spheres. A change in one sphere often affects several others, which is why geoscientists must look for connections rather than single isolated causes.
Earth systems are the major interacting parts of the planet: the geosphere, hydrosphere, atmosphere, biosphere, and cryosphere.
Feedback is a process in which a change in a system causes effects that either increase that change or decrease it.
Positive feedback increases the original change, while negative feedback reduces or stabilizes the original change.
The geosphere includes rocks, minerals, soil, landforms, and the solid Earth. The hydrosphere includes liquid water in oceans, rivers, lakes, and groundwater. The atmosphere is the layer of gases surrounding Earth. The biosphere includes living things. The cryosphere includes frozen water such as glaciers, sea ice, and snowpack.
Suppose a glacier retreats. That is a surface change in the cryosphere and geosphere. As ice disappears, darker rock is exposed. Darker surfaces absorb more solar energy, warming the local area. Meltwater changes stream flow in the hydrosphere. Plant communities shift in the biosphere. Warmer local air changes the atmosphere. This is why feedbacks matter: they connect one event to a wider pattern of Earth system response.
A classic example of negative feedback occurs when increased cloud cover reflects more incoming sunlight, cooling the surface and reducing the warming that helped create the clouds. A classic positive feedback occurs when warming melts ice, reducing surface reflectivity and causing even more warming. Positive does not mean "good," and negative does not mean "bad." These terms describe the direction of the response relative to the original change.
To make a strong scientific claim, geoscientists use multiple lines of evidence. They may study satellite images, temperature records, sediment cores, ice cores, stream discharge measurements, atmospheric gas concentrations, fossil pollen, rock layers, or maps of land cover change. No single data source tells the whole story.
Students and scientists often use a claim-evidence-reasoning approach. A claim answers a scientific question. Evidence comes from observations or measurements. Reasoning explains why the evidence supports the claim using scientific principles.
How to recognize a feedback in data
Look for a sequence of linked changes. First identify the original surface change. Next identify measurable changes in another system. Then ask whether those secondary changes reinforce the original trend or counteract it. If the response increases the original change, it is a positive feedback. If it slows or reduces the original change, it is a negative feedback.
It is also important to separate correlation from causation. If two variables change together, that does not automatically mean one caused the other. Scientists strengthen causal claims by checking whether the timing fits, whether the mechanism makes sense, and whether different kinds of data point to the same explanation.
For example, if satellite data show shrinking snow cover, temperature records show warming, and stream data show earlier spring runoff, those patterns together support a connected explanation better than any one dataset alone.
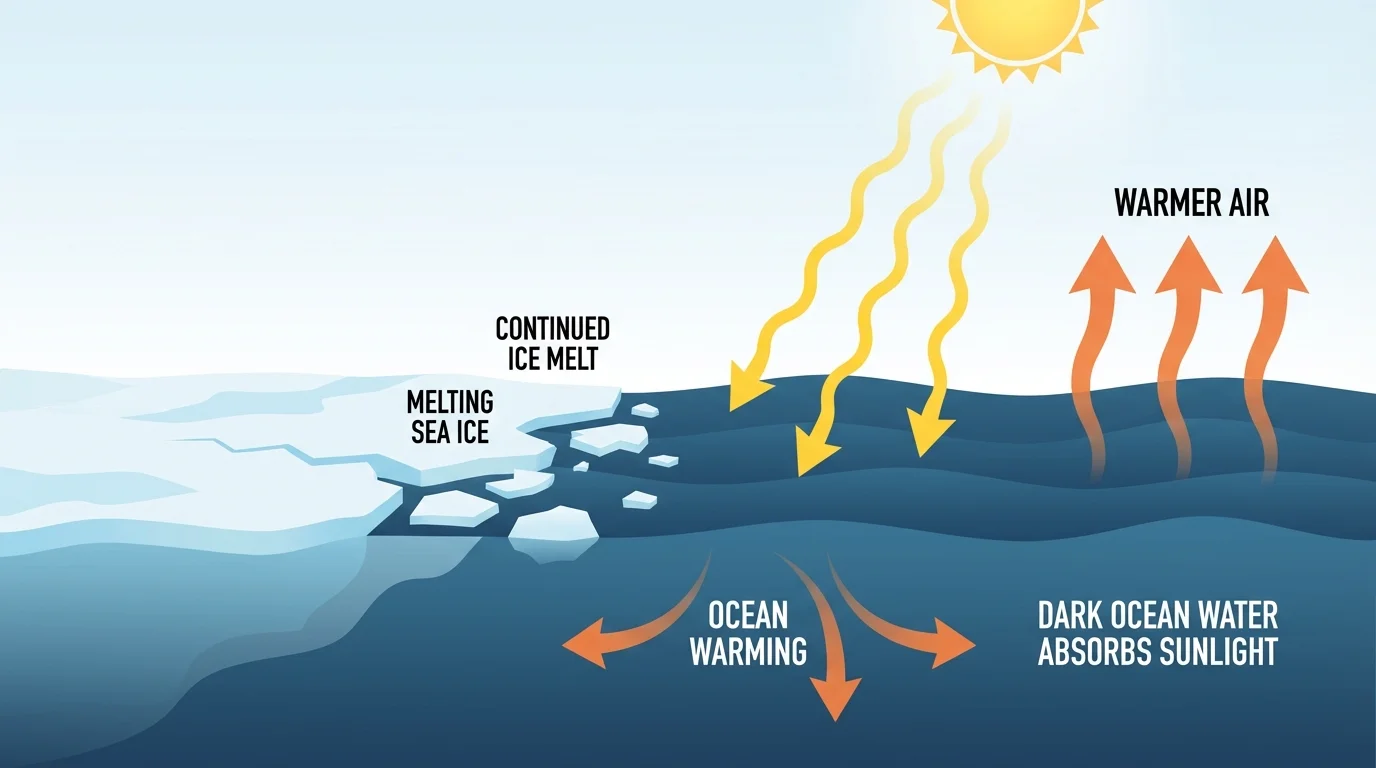
In the Arctic, a change in surface ice cover creates one of the clearest Earth system feedbacks, as [Figure 2] illustrates. When bright sea ice melts, it exposes darker ocean water. That darker water absorbs more of the Sun's energy, which warms the ocean and nearby air and leads to further ice melt.
This process depends on albedo, which is the fraction of incoming sunlight that a surface reflects. Bright ice has high albedo; dark ocean water has low albedo. If a surface receives solar energy of about \(100 \textrm{ units}\), ice might reflect \(60\) to \(80\) units, while darker water may reflect only about \(10\) units and absorb the rest. That difference strongly affects temperature.
As sea ice decreases, atmospheric circulation can also change. Open water releases heat and water vapor to the atmosphere. Ocean ecosystems shift because sea ice habitats shrink. Coastal communities may face stronger wave erosion because open water allows waves to travel farther. What began as a surface change in the cryosphere spreads into the atmosphere, hydrosphere, biosphere, and geosphere.
Reading a simple albedo-related dataset
A student examines summer Arctic data from two years. In Year 1, average sea ice coverage is \(6.0\) million \(\textrm{km}^2\). In Year 2, it drops to \(5.0\) million \(\textrm{km}^2\). Over the same period, average absorbed solar energy in the region increases from \(70\) units to \(78\) units.
Step 1: Identify the pattern
Sea ice coverage decreases by \(1.0\) million \(\textrm{km}^2\), while absorbed energy increases by \(8\) units.
Step 2: Connect the pattern to a mechanism
Less bright ice means more dark water is exposed. Darker surfaces absorb more solar energy.
Step 3: Build the claim
The data support the claim that declining sea ice lowers regional albedo, increasing solar absorption and reinforcing further warming and ice loss.
This is evidence for a positive feedback.
Later observations often show longer ice-free seasons and changes in food webs. Polar bears, seals, plankton communities, and fisheries can all be affected. The same process seen in [Figure 2] also helps explain why Arctic warming is often faster than the global average.
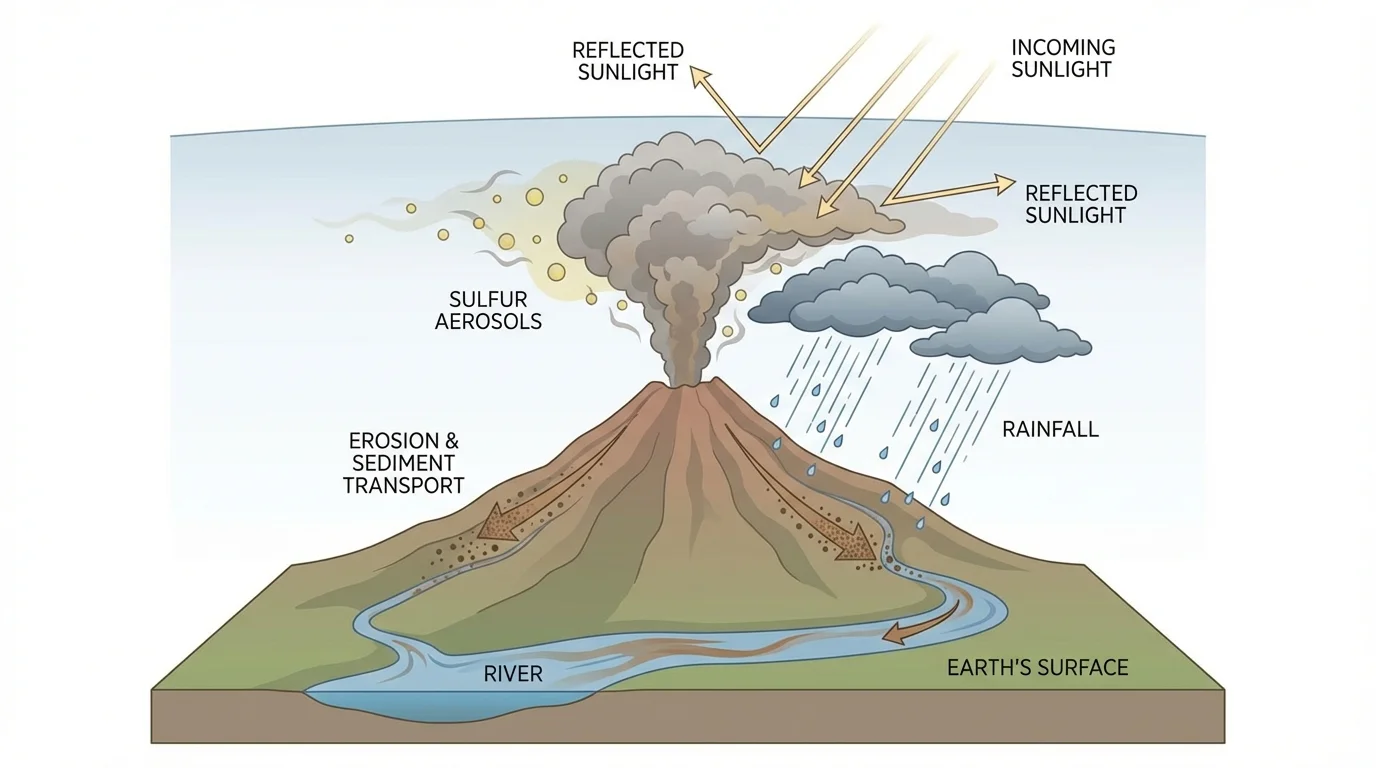
A major volcanic eruption can change Earth's surface in hours, but its effects quickly spread into the atmosphere and hydrosphere, as [Figure 3] shows. Lava covers land, ash buries ecosystems, and sulfur-rich gases rise into the atmosphere, where they can form tiny particles called aerosols.
These aerosols can reflect incoming sunlight and temporarily cool parts of Earth's surface. That means a geosphere event can trigger an atmospheric change that affects climate for months to a few years. Ashfall can also alter river chemistry, clog streams, change infiltration, and affect plant growth.
One well-known example is the \(1991\) eruption of Mount Pinatubo in the Philippines. After the eruption, global average temperatures dropped slightly for a short period because volcanic aerosols reflected sunlight. This is not the same as long-term climate cooling from reduced greenhouse gases, but it demonstrates how a sudden event can produce measurable cross-system effects.
Scientists analyze volcanic feedbacks using satellite observations of ash clouds, measurements of atmospheric aerosol concentration, weather records, and stream chemistry data. If increased aerosols appear immediately after an eruption and are followed by reduced surface temperatures, the timing and mechanism strengthen the causal claim.
Large eruptions can inject material high into the stratosphere, where particles may remain longer than ordinary weather clouds. That is one reason some eruptions affect global climate rather than just local weather.
Volcanic feedbacks can work in different directions. Cooling from aerosols can reduce melting in snow- or ice-covered areas, which tends to counter warming. But ash deposited on snow can darken the surface, lower albedo, and increase melting. In geoscience, the same event can produce multiple feedbacks at the same time.
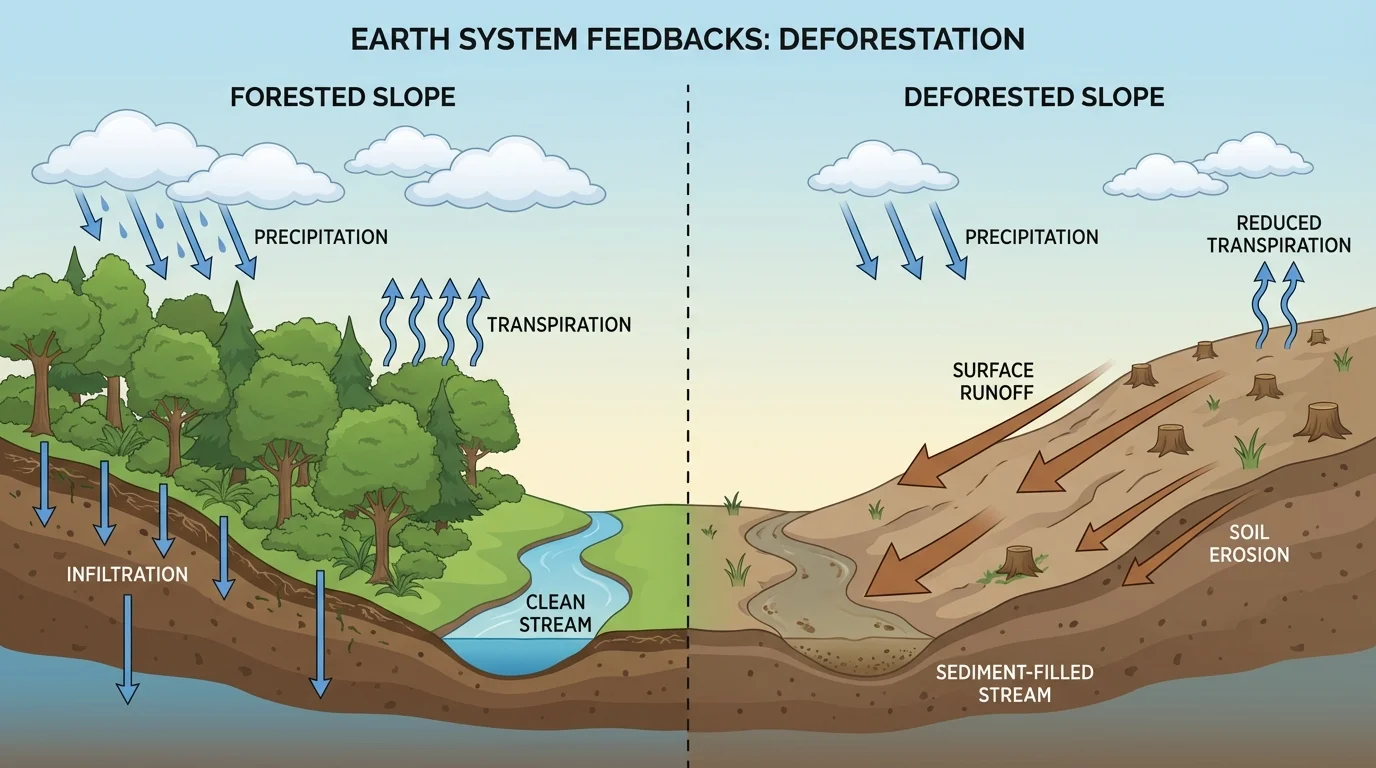
Removing vegetation changes Earth's surface in a way that strongly affects other systems, as [Figure 4] illustrates. When forests are cleared, roots no longer hold soil as effectively, leaves no longer intercept rainfall, and less water returns to the air through transpiration. The result can be more runoff, more erosion, less local humidity, and changes in regional rainfall patterns.
This is a strong example of interaction among the geosphere, biosphere, hydrosphere, and atmosphere. Bare soil is often more vulnerable to erosion. Sediment carried into rivers can reduce water quality and alter aquatic habitats. With fewer trees, less carbon is stored in biomass, and atmospheric \(\textrm{CO}_2\) may increase if wood is burned or decomposes.
On steep slopes, forest loss can also increase the risk of landslides. After heavy rain, water may run off quickly rather than soaking into the ground. Flood peaks in streams may become higher. Surface temperature may rise because shaded, moist ground is replaced by drier exposed land.
Using stream data to support a claim
A watershed is measured before and after extensive logging. Before logging, average sediment concentration in a nearby stream is \(12\) parts per million. After logging, it rises to \(31\) parts per million. Peak storm runoff also increases from \(40\) to \(68\) cubic meters per second.
Step 1: Compare the two time periods
Sediment increases by \(19\) parts per million, and peak runoff increases by \(28\) cubic meters per second.
Step 2: Infer likely surface processes
Higher runoff suggests less infiltration and interception. Higher sediment suggests more erosion of exposed soil.
Step 3: Make the claim
The data support the claim that deforestation changed the land surface in ways that increased erosion and altered stream behavior, producing feedbacks in the hydrosphere and biosphere.
Additional rainfall and land-cover data would further strengthen the explanation.
Later in a study, researchers might connect reduced cloud formation and warmer local temperatures back to the same land-cover change. The hillside contrast in [Figure 4] helps visualize why losing vegetation can amplify drought stress in some regions while also increasing flood danger during storms.
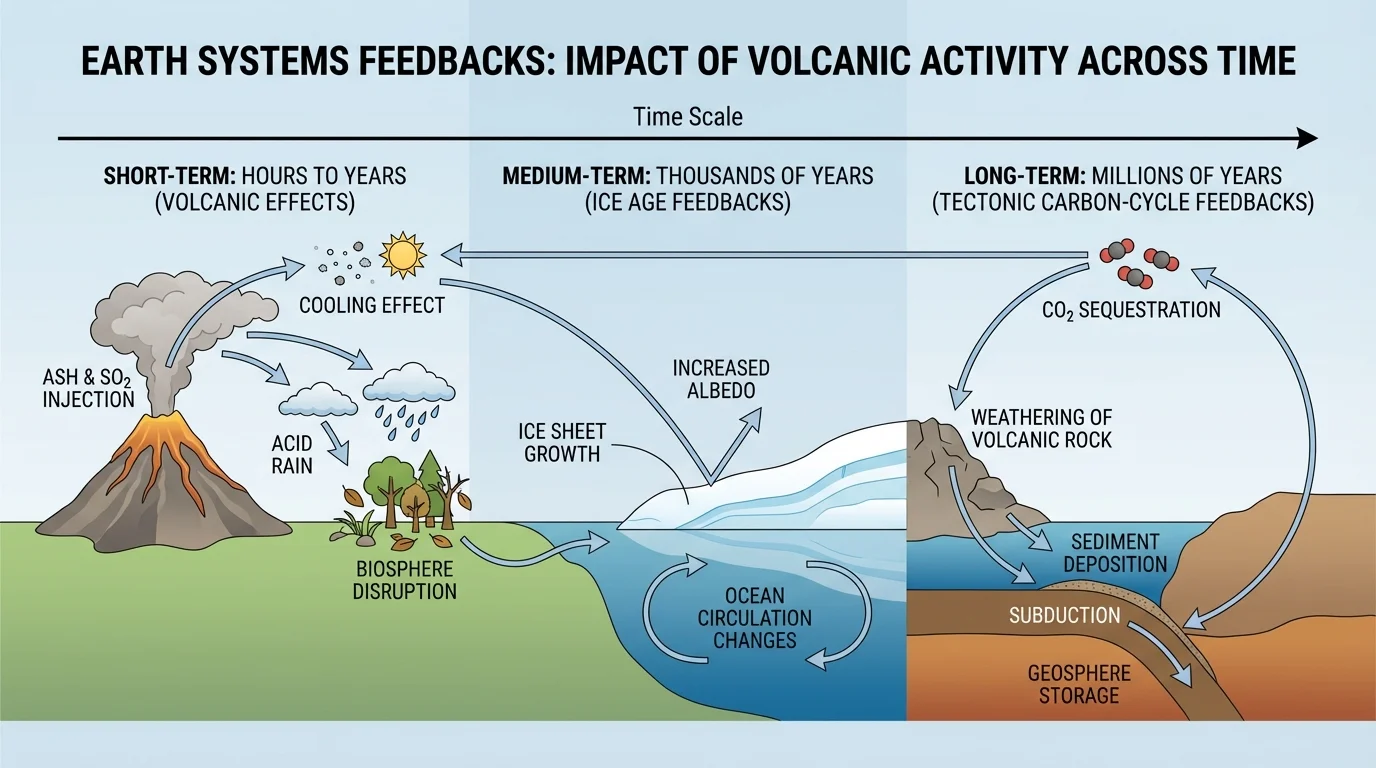
Not all feedbacks happen at the same speed. Some occur suddenly, some over centuries or millennia, and some over millions of years, as [Figure 5] illustrates. Recognizing time scale is essential because the same type of Earth system interaction may look very different depending on how long it unfolds.
Sudden feedbacks include volcanic ash clouds, flash flooding after wildfire, or rapid glacier lake outburst floods. These may develop over hours to years. Intermediate feedbacks include the expansion and retreat of ice sheets, shifting ocean circulation, or long drought cycles that alter vegetation and soil. These often occur over hundreds to tens of thousands of years.
Very long-term feedbacks include tectonic uplift, mountain building, seafloor spreading, and changes in the long-term carbon cycle. For example, when tectonic forces build mountains, increased weathering of rock can remove some \(\textrm{CO}_2\) from the atmosphere over long periods. That can influence climate. In turn, climate affects erosion rates, which affect how mountains evolve.
| Time scale | Example surface change | Feedback type | Other systems affected |
|---|---|---|---|
| Hours to years | Volcanic eruption | Aerosol cooling or ash-darkened snow melt | Atmosphere, hydrosphere, biosphere |
| Decades to millennia | Sea ice loss | Lower albedo increases warming | Atmosphere, hydrosphere, biosphere |
| Thousands to millions of years | Mountain uplift | Weathering influences atmospheric \(\textrm{CO}_2\) | Atmosphere, hydrosphere, geosphere |
Table 1. Examples of Earth surface changes and their feedbacks across different time scales.
The timeline in [Figure 5] makes an important point: Earth is dynamic on every scale. Human observations often capture only a small part of a much longer process, so geoscientists combine modern measurements with evidence preserved in rocks, ice, sediments, and fossils.
When asked to analyze geoscience data, begin with the exact question. Are you being asked whether one change to Earth's surface caused feedbacks in other systems? If so, you need more than a description. You need a claim that identifies the original change, the systems involved, and whether the feedback amplified or reduced the change.
Reliable scientific claims depend on evidence, not opinion. A strong explanation identifies patterns in data, proposes a mechanism, and checks whether different datasets agree.
A useful structure is: Surface change \(\rightarrow\) system response \(\rightarrow\) feedback effect. For example: decreased sea ice \(\rightarrow\) darker ocean absorbs more solar energy \(\rightarrow\) regional warming increases further sea ice loss. This chain is scientifically stronger if supported by satellite images, albedo data, and temperature records.
Words such as because, therefore, and which led to are important because they signal reasoning. A strong claim might be: "The data support the claim that loss of sea ice created a positive feedback because lower albedo increased absorbed solar energy, warming the ocean and atmosphere and promoting more melting."
Claim-evidence-reasoning model
Question: Can a drought-triggered vegetation decline create feedbacks in other Earth systems?
Step 1: Claim
Yes. A drought-driven decline in vegetation can create positive feedbacks that intensify drying and alter the hydrosphere and atmosphere.
Step 2: Evidence
Satellite images show reduced plant cover. Soil moisture records decrease. Air temperature rises. Streamflow becomes more variable after storms.
Step 3: Reasoning
With less vegetation, less water returns to the atmosphere through transpiration, soils are less shaded, and runoff increases. These changes can reduce local humidity, increase heating, and worsen erosion, reinforcing the original drought stress.
This example shows how one surface change can ripple through several Earth systems.
Scientists also consider alternative explanations. Could temperature have risen because of a heat wave unrelated to vegetation loss? Could stream sediment have increased due to construction rather than logging? Good geoscience claims become stronger when they test and rule out competing causes.
Understanding feedbacks is not only about passing a science class. It matters for predicting hazards, planning cities, managing forests, preparing for drought, and responding to climate change. If a change to Earth's surface can trigger additional changes, then small shifts may grow into major regional problems.
For example, communities near coasts must consider how loss of wetlands changes erosion and storm damage. Farmers must consider how soil degradation affects runoff, crop growth, and local water availability. Policymakers use geoscience data to decide where to build, what to protect, and how to reduce risk.
"The Earth is a complex system of interacting components, and change in one part can influence the whole."
That idea is the heart of Earth system science. Geoscience data do more than record change; they reveal the links among processes. Once those links are understood, we can make evidence-based claims about how Earth works and how future changes may unfold.