[Figure 1] Have you ever given a toy car a tiny push and watched it move a little, then given it a big push and watched it zoom away? That is science and engineering at work. We can build or use something, test it, and then look carefully at what happened. When we do that, we find out if a design really works.
A push is when you move something away from you. A pull is when you bring something toward you. Pushes and pulls can make things start moving, stop moving, go faster, slow down, or change direction.
When you push a ball, the ball can roll. When you pull a wagon, the wagon can move toward you. If you push a toy car from the side, it may turn. If you pull a door, it opens in your direction. A push or pull has a direction, and direction means the way something moves, such as forward, backward, left, or right.
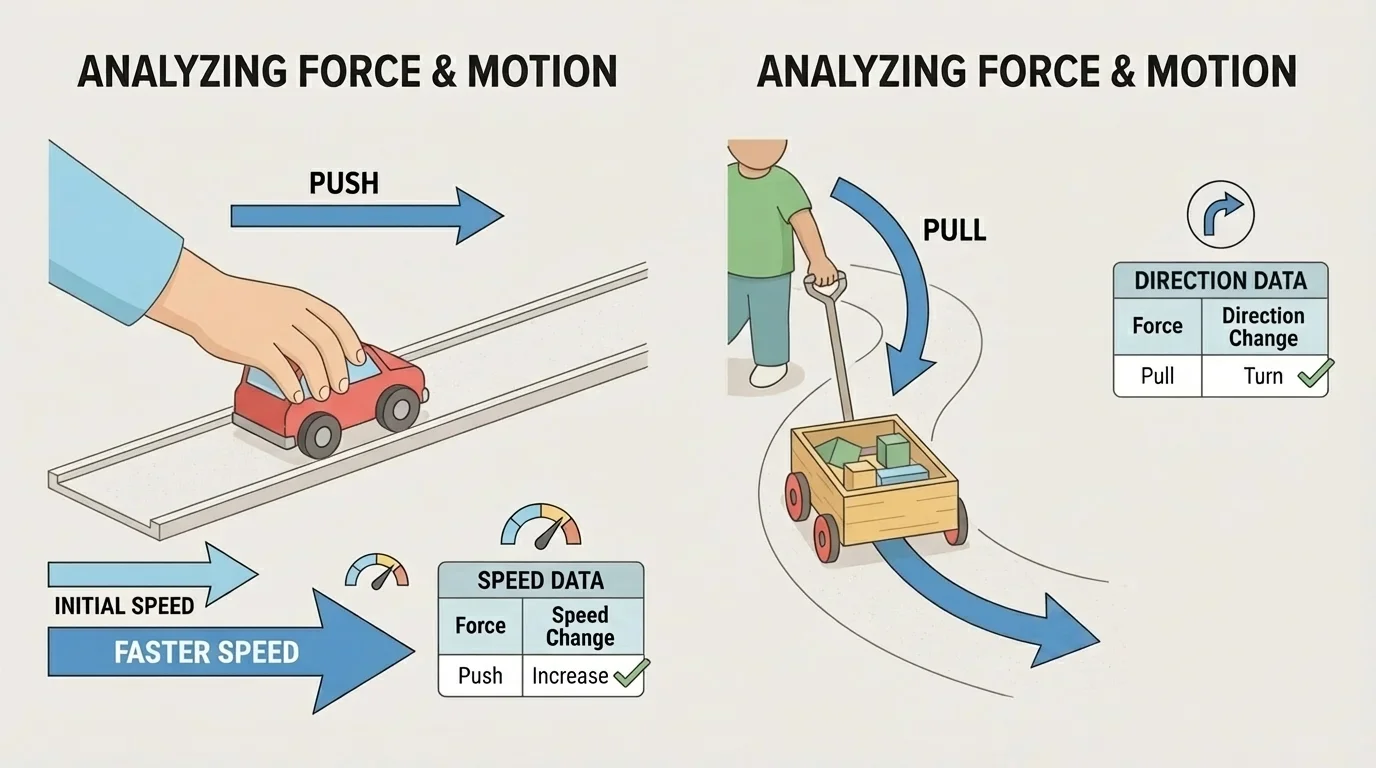
Pushes and pulls can also have different strengths. A gentle push may move a toy only a little. A stronger push may move it more. We do not need difficult calculations to notice this. We can just observe what happens and compare the results.
Speed tells how fast or slow something moves. Design solution means something people make to solve a problem, like a ramp that helps a toy car move or a handle that helps pull a wagon.
When scientists and engineers want to know if something works, they do not just guess. They test it. Then they look at the results.
Data is the information we gather from a test. For young scientists, data can be very simple. It can be what we see, what we count, or how far something goes. It can be pictures, tally marks, or words like farther, shorter, faster, and slower.
If a class tests a toy car, the data might be: the red car went farther, the blue car turned left, or the ball stopped near the box. This helps us answer an important question: did the design do what we wanted it to do?
Engineers test real things this way too. They look at what happened after each try so they can decide if a tool, toy, or machine is working the way they planned.
We can use our eyes and ears to notice changes. We can also use simple classroom tools, like cubes on the floor, to see which object went farther. If one toy rolls past more cubes, that tells us it moved a greater distance.
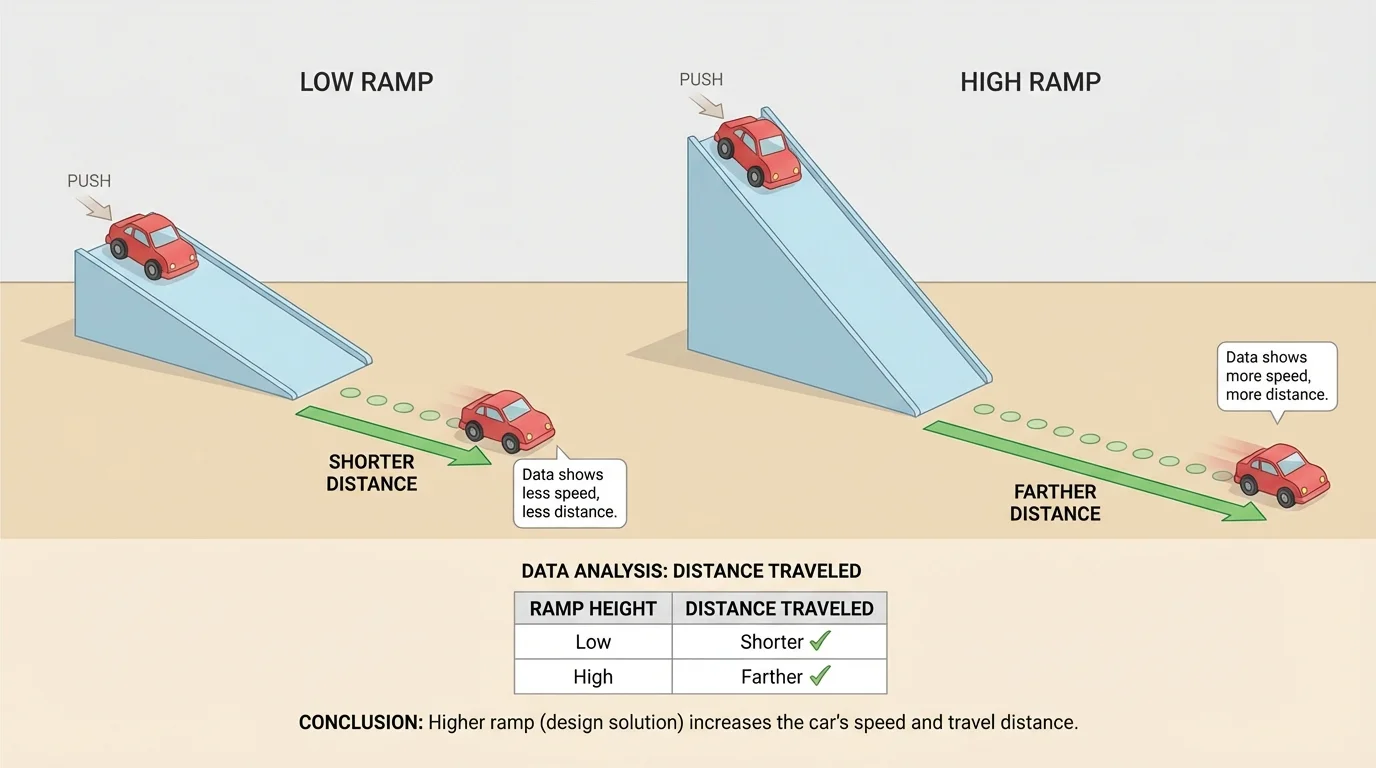
[Figure 2] Suppose the problem is: How can we help a toy car go faster? One design solution might be a ramp. We test the design by letting the same car roll down it and watching what happens.
If we try a low ramp and then a higher ramp, we can compare the results. We might see that the car from the higher ramp moves faster or goes farther after it reaches the floor. The test helps us know whether the ramp changed the car's motion as intended.
We can also test direction. Suppose the problem is: How can we make a ball change direction? A design solution might be a small wall or bumper made from blocks. When the moving ball touches the bumper, it can turn and go a new way. If the ball turns toward the target, the design works as intended. If it misses the target, the design may need to change.
Example: Testing a toy car ramp
The goal is to make the toy car move faster.
Step 1: Use the first ramp.
The car rolls a short way.
Step 2: Use the second ramp.
The car rolls a longer way.
Step 3: Compare the results.
If the second ramp makes the car move more quickly and travel farther, that design works better for this goal.
The important idea is not just trying a ramp. The important idea is looking at the results to decide if it works.
To make a fair test, we try to keep some things the same, like using the same toy car each time. Then we can better tell whether the design caused the change we saw.
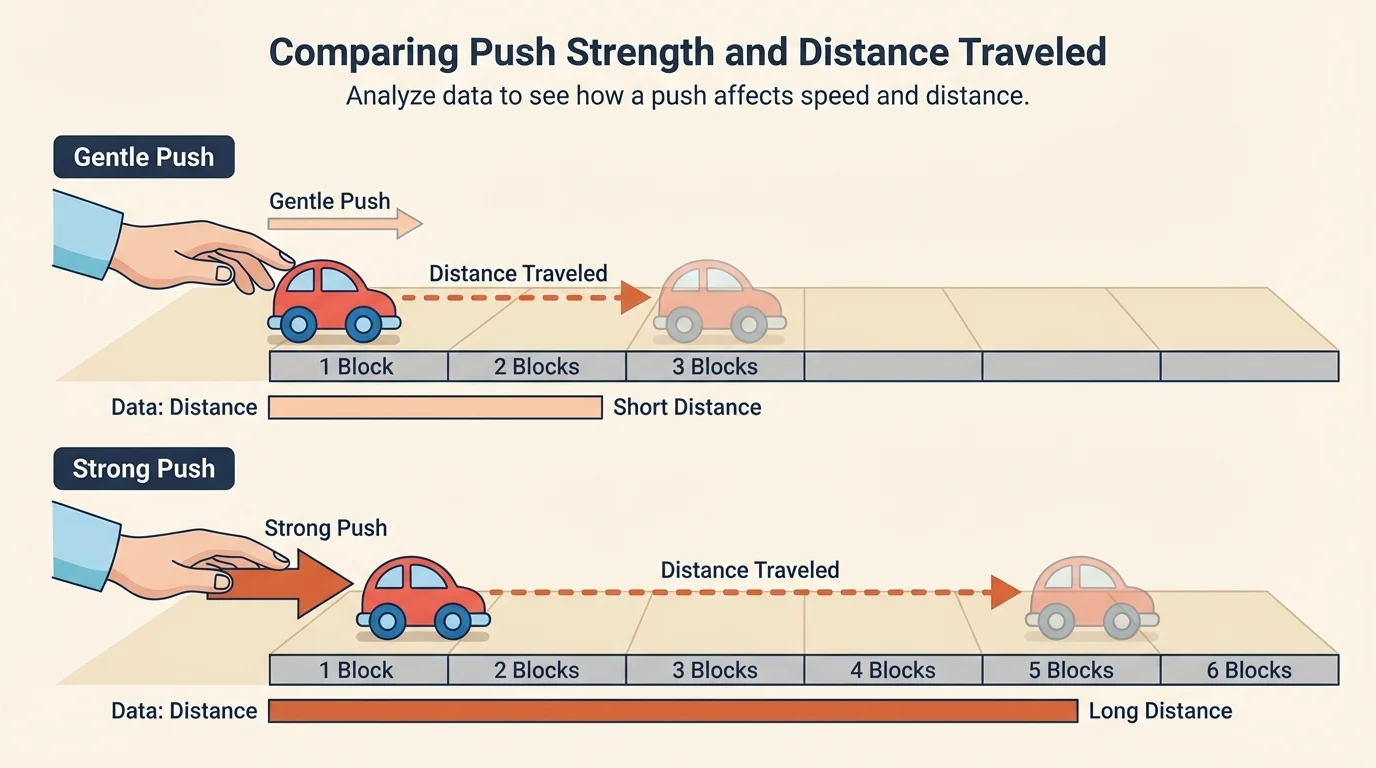
Simple results can be put in a chart. A chart helps us compare what happened, as [Figure 3] shows. We can look for clues such as which push made an object go farther or which pull made it turn the right way.
Here is one way to organize test results.
| Test | What we did | What happened | Did it work? |
|---|---|---|---|
| a | Gentle push on toy car | Car moved a little | Not enough for a long trip |
| b | Stronger push on toy car | Car moved farther | Yes, for going farther |
| c | Pull on wagon handle | Wagon came toward us | Yes, for moving this way |
| d | Ball hit block bumper | Ball turned right | Yes, for changing direction |
Table 1. Simple test results showing how different pushes and pulls change motion.
When we read data, we ask: What changed? Did the object speed up? Did it slow down? Did it turn? Did it start moving or stop moving? The answers help us decide if the design did its job.
Sometimes the answer is yes. Sometimes the answer is no. Both answers are useful. If a design does not work, the data tells us what to fix. Later, when we think again about pushes and pulls, [Figure 1] reminds us that changing strength or direction can change how an object moves.
How data helps us decide
Data helps us make a choice based on what really happened. If one design makes an object move the way we want and another design does not, the data gives us evidence for choosing the better design.
A stronger push is not always the best choice. If the goal is to stop near a target, a gentle push may work better. The best design depends on the goal.
People use ideas about pushes and pulls every day. On a playground, a push starts a swing moving. In a store, a pull moves a wagon or cart. At home, we push a chair in, pull a drawer open, and roll toys across the floor.
Engineers use these ideas when they make toys, doors, strollers, carts, and ramps. They test to see if an object moves in the right way. If a stroller is hard to turn, the design may need to change. If a toy launcher sends a ball in the wrong direction, the design may need to change too.
You already know that objects can move. Now you are adding a new idea: we can test why they move a certain way and decide if a design causes the motion we want.
We can also use simple data from our tests to explain our thinking. We might say, "This ramp worked because the car went farther," or "This bumper worked because the ball turned left toward the cup." Those are science answers based on evidence.
After a test, we can improve the design. If a car does not go fast enough, we might change the ramp. If a ball does not turn enough, we might move the bumper. If the wagon handle is too short to pull easily, we might redesign it.
Looking back at the chart in [Figure 3], we can see that results help us make smart changes. We are not just playing with objects. We are solving problems by testing, observing, and deciding.
That is what it means to analyze data to tell whether a design solution works as intended: we try something, watch carefully, collect simple results, and use those results to answer the question, "Did it do what we wanted?"