A tiny rock can tell a big story. A puddle gets smaller, sand feels different from soil, and a windy day can move leaves across the ground. Scientists learn by looking closely and keeping track of what they see. When we record what we notice, we make our ideas easier to remember, share, and compare.
An observation is something we notice by using our senses. We can see color, shape, size, and movement. We can feel if something is rough or smooth. We can hear rain on a roof or wind in trees. In Earth science, we often observe rocks, soil, sand, water, clouds, and land.
Some observations are about Earth materials. A rock may be hard. Soil may be dark and crumbly. Sand may have tiny grains. Water may collect in a low place after rain. These details help us understand the world around us.
Observation means noticing something carefully. Record means to save what we noticed so we can look at it again later.
Good observers try to be careful and honest. If a puddle is small, we say it is small. If two leaves are different colors, we say that too. Recording what is really there helps people learn from the same information.
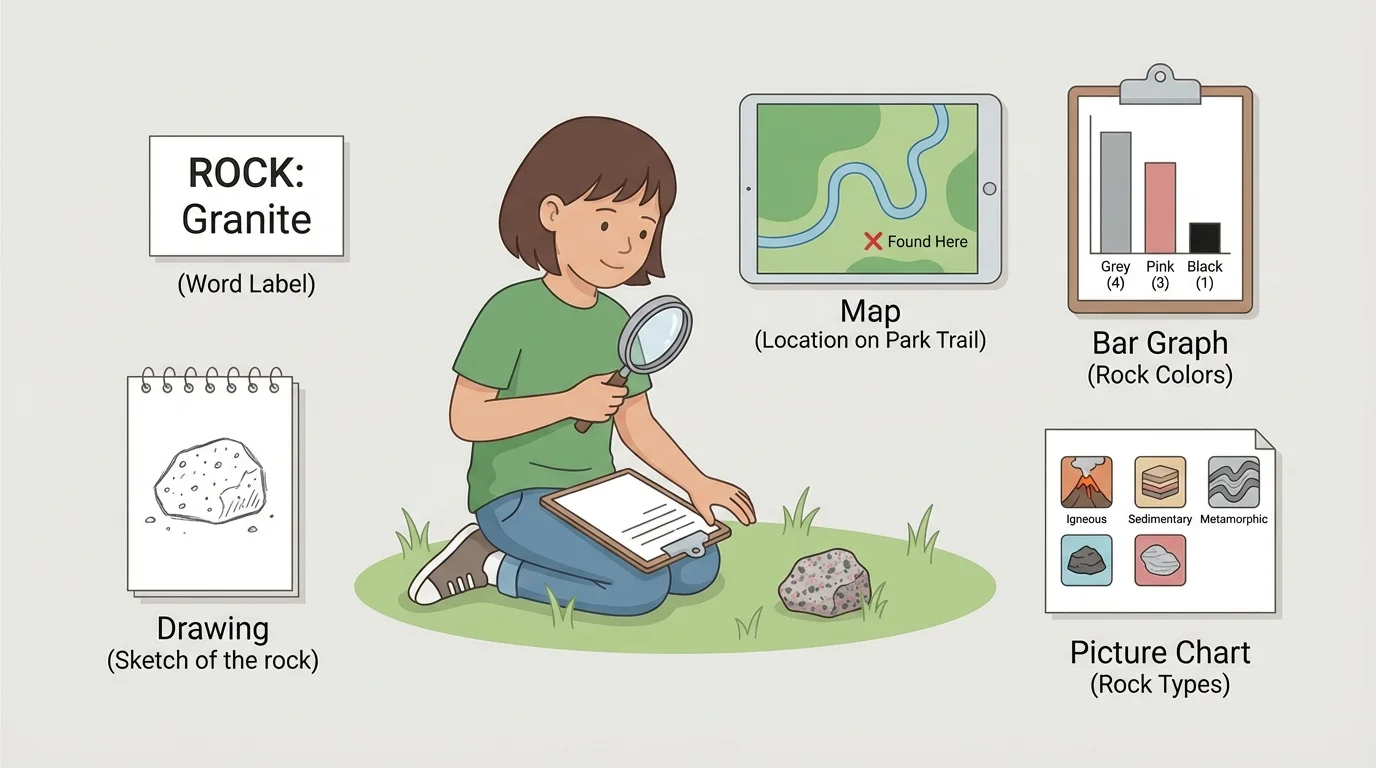
One observation can be saved in many forms, as [Figure 1] shows. If we find a rock on the ground, we can use words to say, "The rock is gray and bumpy." We can make a drawing of its shape. We can mark its place on a simple map. We can put it into a chart with other rocks. We can add it to a graph to show how many gray rocks we found.
Each way of recording helps in a different way. Words tell details. Drawings show what something looks like. Maps show where something is. Graphs show amounts. Charts help sort and compare things.
Scientists often use more than one kind of record. A weather watcher may write "windy," draw clouds, mark where rain fell on a map, and keep a graph of sunny and rainy days. Using different records gives a fuller picture.
Some scientists keep field notebooks when they work outdoors. They quickly write words and make simple sketches so they do not forget what they saw.
Even young scientists can do this. A child looking at a garden may record, "Wet soil," draw a flower, show the flower bed on a map, and add one mark to a chart for "plants seen today."
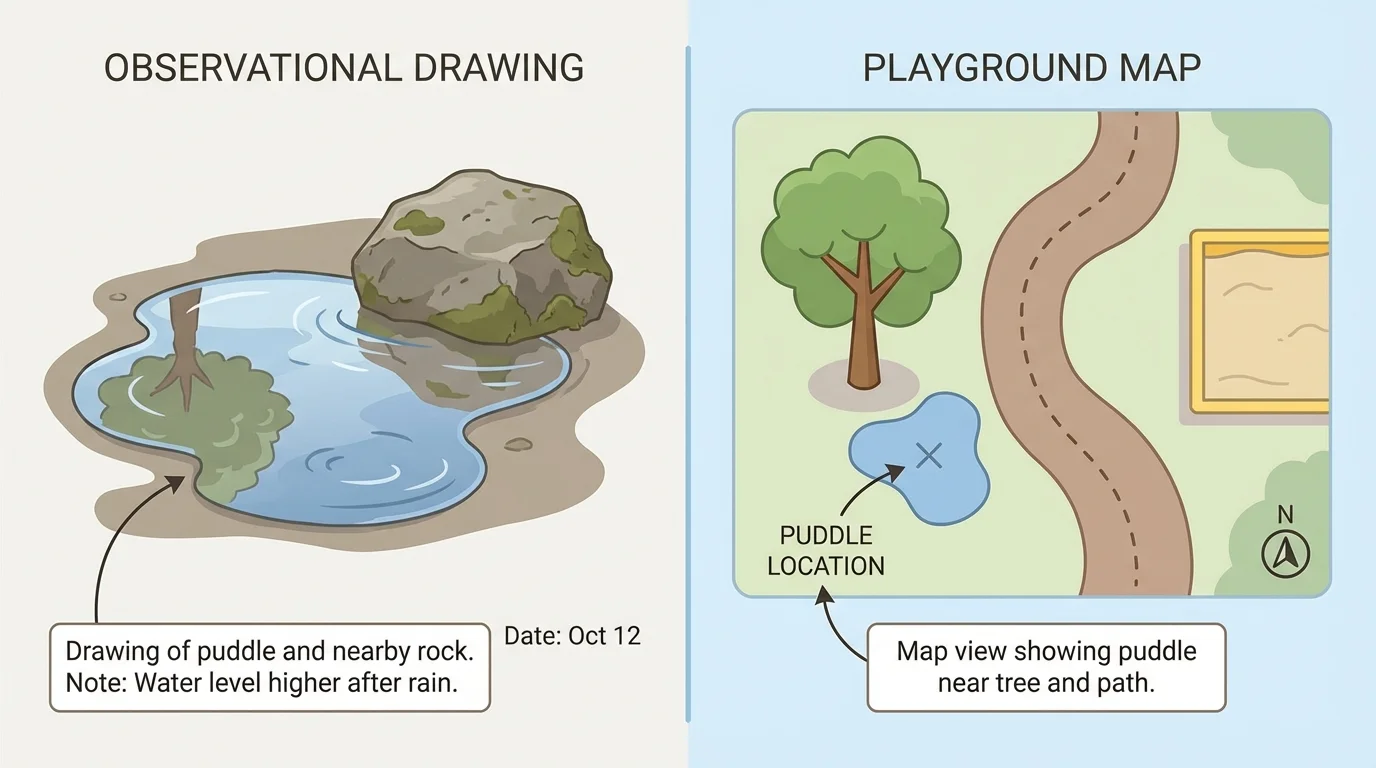
A [Figure 2] makes an important difference easy to see: a drawing shows what something looks like, and a map shows where something is. If we observe a puddle, a drawing can show its shape and the rock beside it. A map can show that the puddle is near the slide, under a tree, or next to a path.
A drawing does not have to be perfect. It should show important parts. For a leaf, we might draw the stem and the shape. For a rock, we might show if it is round or jagged. For a patch of soil, we might show cracks if the ground is dry.
A map is a simple picture of a place from above. It can show where sand is, where water collects, or where different rocks are found. Maps help us notice patterns. For example, wetter soil may be in lower places, while dry ground may be higher.
Maps are useful when Earth's surface changes. After rain, we can mark where puddles form. Later, if the sun comes out, we may see the puddles shrink. Looking back at the map helps us remember where the water was.
Patterns in place are easier to notice when we use maps. A map can show that leaves gather where wind pushes them or that pebbles are found near a path. Scientists look for these patterns to learn how water, wind, and people change the land.
Later, when we compare places again, [Figure 2] stays helpful because it reminds us that location matters. Knowing where something is can be just as important as knowing what it looks like.
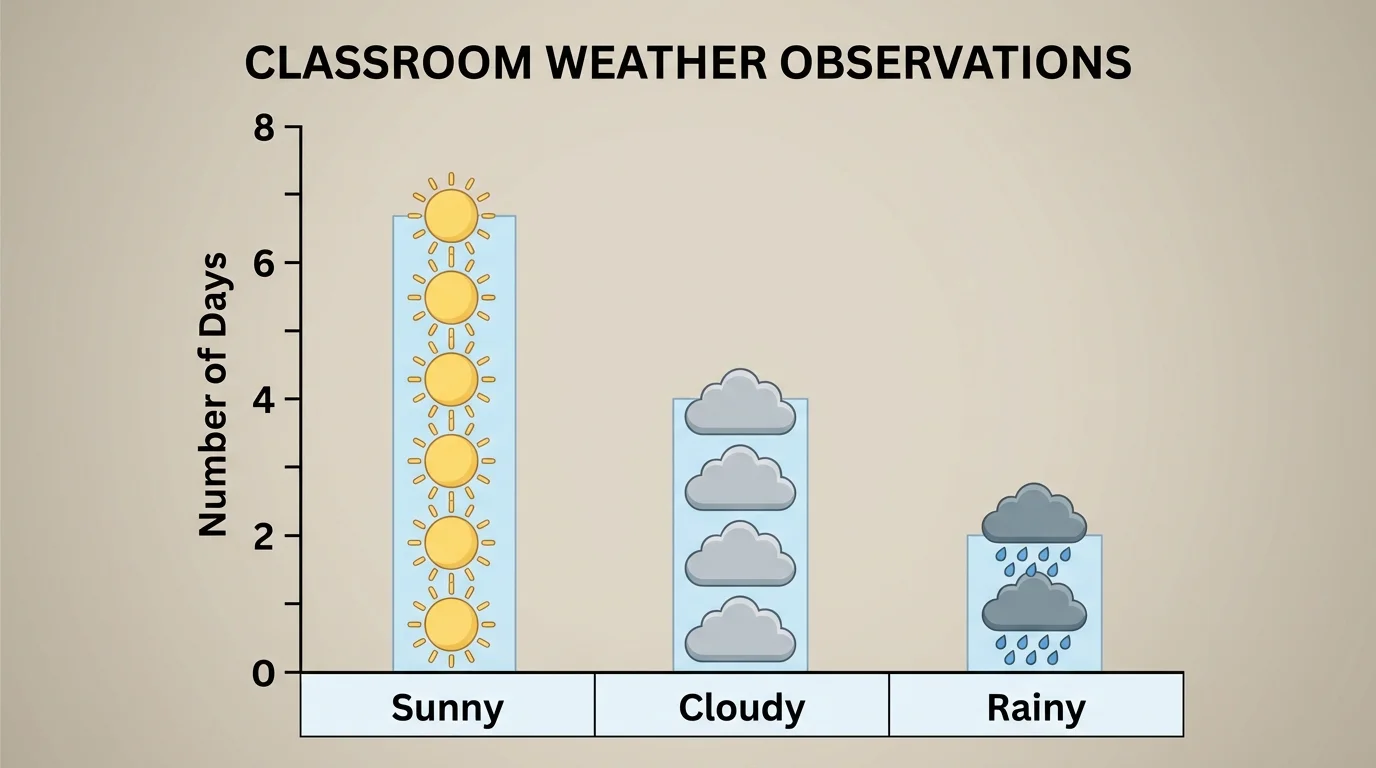
When we observe the same thing again and again, a [Figure 3] helps us see more and less quickly. A simple graph can show how many sunny days, cloudy days, or rainy days happened in one week. It can also show how many smooth rocks and rough rocks were collected.
A graph shows amounts. A picture graph may use one picture for each day. A bar graph uses bars that grow taller when there is more. Young children can read a graph by asking, "Which one has more?" and "Which one has less?"
A chart helps sort information into groups. We might make a chart with columns for "rock," "soil," "sand," and "water." Then we place pictures or marks in the right column. Charts help us organize many observations neatly.
Graphs and charts are useful for Earth science because nature changes over time. If we watch the sky every day, our graph may show many sunny days in a row, then two rainy days. If we sort leaves by color in a chart, we may notice that more leaves turn brown in one season.
| Record type | What it helps show | Example |
|---|---|---|
| Words | Details | "The soil is wet and dark." |
| Drawing | What it looks like | A sketch of a shell |
| Map | Where it is | A playground map with a puddle marked |
| Graph | How many | Sunny days and rainy days |
| Chart | Groups and sorting | Rocks sorted by color |
Table 1. Different ways to record observations and what each one shows best.
When children compare data later, [Figure 3] supports their thinking because it makes the pattern easy to see without reading many sentences.
Scientists record observations so they can remember, compare, and share. Memory can fade, but a notebook page, a sketch, a map, or a graph stays the same. This helps people look back and ask new questions.
Recording also helps us notice patterns. A pattern is something that happens in a way we can recognize. Rain may collect in the same low spot. Wind may blow leaves toward one fence. Smooth stones may be found in one area more than another area.
Real-world example: watching a puddle
Step 1: Use words
Write, "The puddle is wide and shiny."
Step 2: Use a drawing
Draw the puddle and the nearby tree.
Step 3: Use a map
Mark the puddle near the path.
Step 4: Use a chart or graph
On different days, add a mark for "big puddle," "small puddle," or "gone."
These records help us see that sunlight and warmth can make surface water dry up.
People also use records to solve problems. If soil washes away after rain, a map can show where the soil moved. A chart can help compare places with more grass and places with less grass. This information helps people protect the land.
Weather observers record clouds, rain, and wind. Gardeners notice where soil stays wet. Builders study land before making roads or houses. Park workers may map trails, streams, and rocky places. All of them use records to understand Earth materials and Earth's surface.
A child on a nature walk can do similar science. The child might use words to describe bark, a drawing to show a stone, a map to mark where flowers grow, a chart to sort leaves, and a graph to show how many birds were seen each day. These simple tools turn looking into learning.
When you look carefully, you are doing science. When you save what you notice with words, pictures, and organized records, you make your thinking clear.
Recording observations does not mean using only one way. The strongest science records often combine many ways. Words add detail. Drawings show shape. Maps show location. Graphs show number. Charts add organization. Together, they help us understand the natural world better.