When a skateboarder pushes off hard and suddenly speeds up, or a car slams on the brakes and your body lurches forward, there is a precise mathematical rule controlling what happens. That rule is Newton's second law of motion, and scientists have tested it with data for centuries. Today you will see how numbers, graphs, and experiments all point to the same relationship among force, mass, and acceleration.
Picture a car moving straight along a road. The driver hits the brakes to avoid an obstacle. The car's speed drops quickly; your body feels pulled forward. In reality, your body tends to keep moving at its original speed while the car slows down under the action of the brakes and friction with the road.
Engineers must know exactly how much force is required to slow the car in a certain distance and time. They do this by using Newton's second law and by analyzing real test-track data. That same law also explains why a heavy truck is harder to accelerate than a small car, even with the same engine power.
To understand and analyze data for Newton's second law, we first need clear ideas about some quantities: force, mass, and acceleration. We will focus on one-dimensional motion only: objects moving along a straight line, like a cart on a track or a car on a straight road.
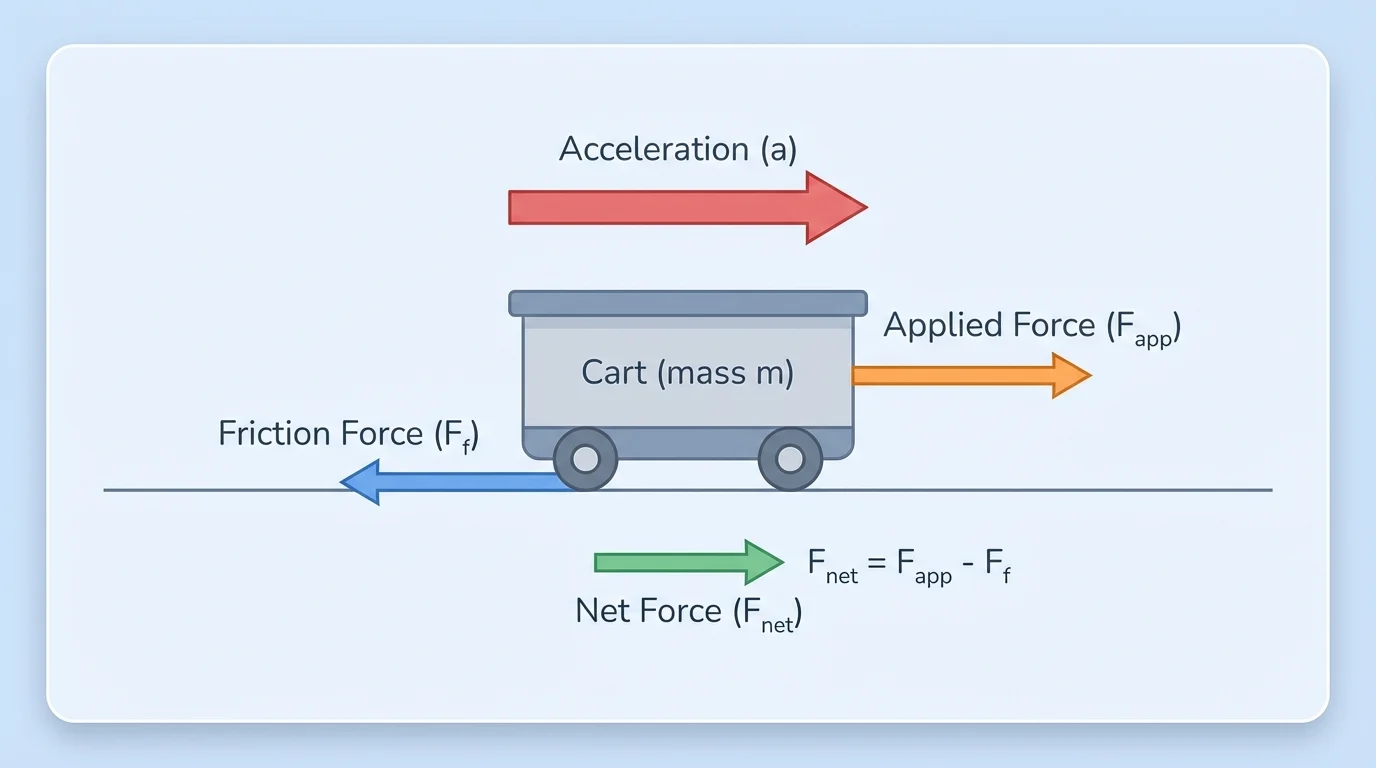
A net force is the combined effect of all forces acting along that line. If a box on a floor is pulled to the right by \(10\textrm{ N}\) and friction resists motion to the left with \(4\textrm{ N}\), then the net force to the right is \(10 - 4 = 6\textrm{ N}\).
Mass measures how much matter is in an object and also how strongly it resists changes in motion. A bowling ball has more mass than a tennis ball, so it is harder to speed up, slow down, or turn. Mass is measured in kilograms, or \(\textrm{kg}\).
Acceleration describes how quickly the velocity of an object changes. In one dimension, if a cart's velocity increases from \(0\textrm{ m/s}\) to \(2\textrm{ m/s}\) in \(1\textrm{ s}\), its acceleration is \(2\textrm{ m/s}^2\), meaning its speed increases by \(2\textrm{ m/s}\) every second.
In one-dimensional motion, directions are usually represented with signs. For example, to the right or forward can be defined as positive, and left or backward as negative. The net force, velocity, and acceleration can then be positive or negative, but they all lie along the same straight line.
For macroscopic objects moving at everyday, non-relativistic speeds in one dimension, Newton's second law can be written as:
\[F_{\textrm{net}} = ma\]
Here, \(F_{\textrm{net}}\) is the net force in newtons, \(m\) is the mass in kilograms, and \(a\) is the acceleration in \(\textrm{m/s}^2\).
This equation shows two important proportionalities:
Because we are in one dimension, the sign of \(F_{\textrm{net}}\) and \(a\) (positive or negative) tells us the direction: if the net force is to the right, the acceleration is to the right; if the net force is to the left, the acceleration is to the left.
For example, if a \(2.0\textrm{ kg}\) cart experiences a net force of \(6.0\textrm{ N}\) to the right, then the acceleration is
\[a = \frac{F_{\textrm{net}}}{m} = \frac{6.0\textrm{ N}}{2.0\textrm{ kg}} = 3.0\textrm{ m/s}^2\textrm{ (to the right)}\]
The claim we want to support with data is: for macroscopic objects moving in one dimension at non-relativistic speeds, the acceleration is equal to the net force divided by the mass.
Newton's Second Law (one-dimensional form) states that the acceleration of an object is equal to the net force acting on it divided by its mass: \(a = \dfrac{F_{\textrm{net}}}{m}\). The net force and the acceleration act along the same straight line.
Every measurement we make of forces and accelerations for carts, cars, or other everyday objects should be consistent with this equation if the law is correct.
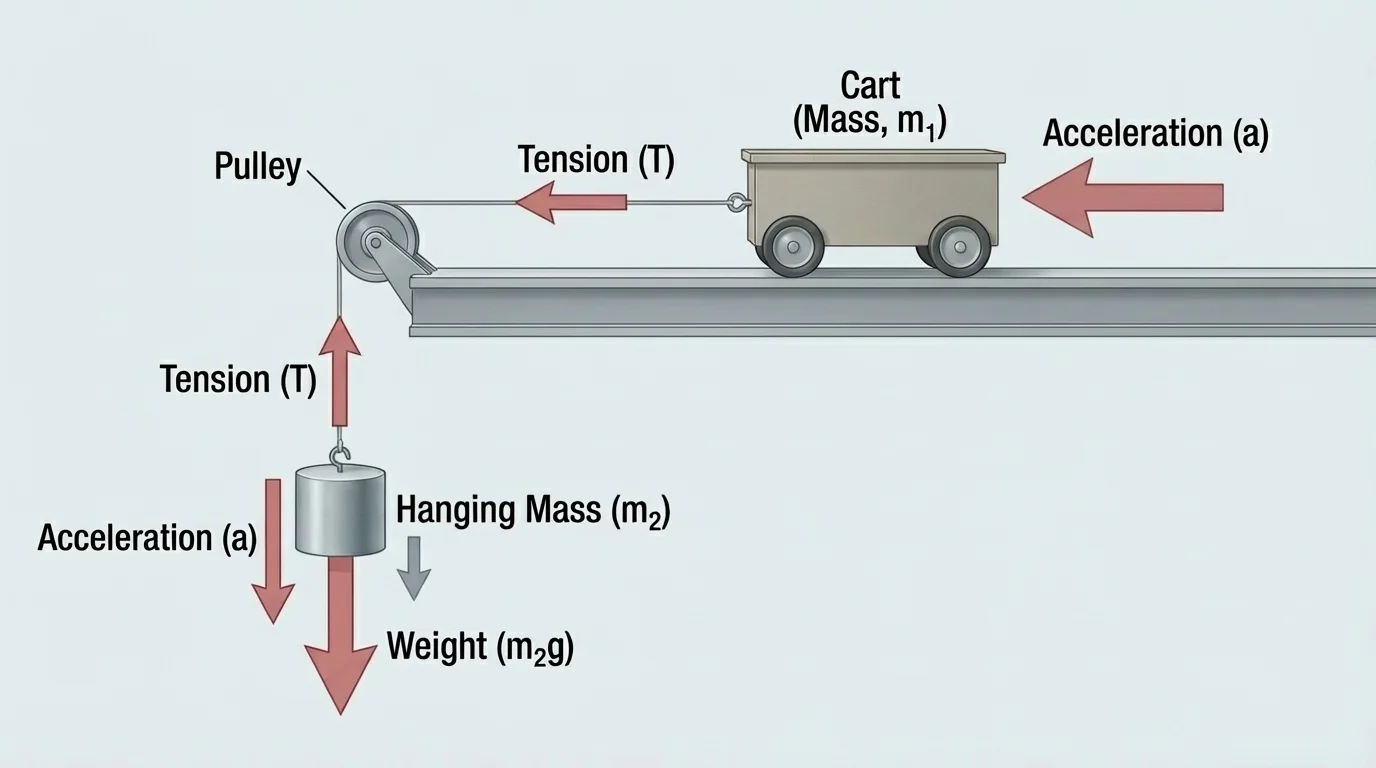
To test Newton's second law, physicists and students design experiments where they can measure mass, force, and acceleration in a controlled way. A classic example uses a low-friction cart on a straight track attached to a hanging mass over a pulley, as described in [Figure 2].
In this setup, the cart plus hanging mass make up a single system. Gravity pulls down on the hanging mass, creating a tension in the string that pulls the cart forward. If friction is small, the net force along the track is approximately equal to the weight of the hanging mass.
To collect useful data, we can choose one variable to change while holding others constant. For example:
In either case, we measure acceleration in one dimension along the track. This can be done using motion sensors, video tracking, or timing gates that measure how quickly the cart speeds up.
Each trial in the experiment produces a data pair \((F_{\textrm{net}}, a)\) for a known mass. Collecting many trials gives us a table we can analyze.
High-speed cameras and motion sensors used in sports science rely on the same principles. By tracking acceleration and knowing the mass of an athlete's body or equipment, analysts can estimate the net forces involved in jumps, kicks, or throws.
The same cart-and-pulley idea used in the lab also appears, in more complex form, in engineering test rigs for testing engines, brakes, and materials.
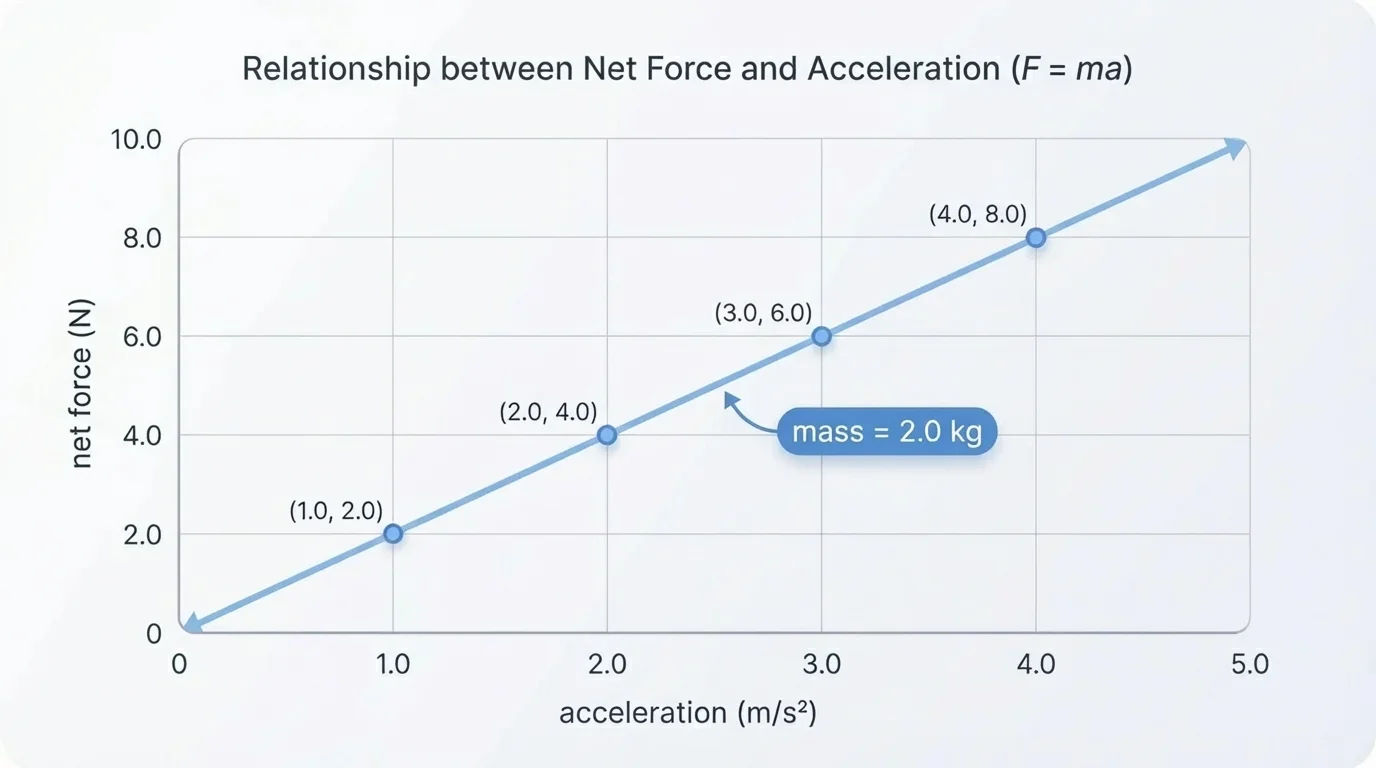
Once we have measured values of net force and acceleration, we can look for patterns that support Newton's second law. Graphs are especially powerful: a straight-line graph between \(F_{\textrm{net}}\) and \(a\) is strong evidence of a proportional relationship, as illustrated in [Figure 3].
Consider an experiment where we keep the cart's mass at \(2.0\textrm{ kg}\) and vary the net force. We might get data like this:
| Trial | Net force \(F_{\textrm{net}}\) (N) | Acceleration \(a\) (m/s\(^2\)) |
|---|---|---|
| 1 | 2.0 | 1.0 |
| 2 | 4.0 | 2.0 |
| 3 | 6.0 | 3.0 |
| 4 | 8.0 | 4.0 |
Table 1. Example data for a \(2.0\textrm{ kg}\) cart with varying net force and measured acceleration.
If we plot net force on the vertical axis and acceleration on the horizontal axis, the data points lie on a straight line through the origin. The slope of this line is the mass:
\[\textrm{slope} = \frac{\Delta F_{\textrm{net}}}{\Delta a} = m\]
From the table, when \(a\) increases from \(1.0\textrm{ m/s}^2\) to \(2.0\textrm{ m/s}^2\), \(F_{\textrm{net}}\) increases from \(2.0\textrm{ N}\) to \(4.0\textrm{ N}\). The slope is
\[\textrm{slope} = \frac{4.0 - 2.0}{2.0 - 1.0} = \frac{2.0}{1.0} = 2.0\textrm{ kg}\]
which equals the mass of the cart. This linear pattern supports the claim that \(F_{\textrm{net}} = ma\).
We can also test the inverse relationship between acceleration and mass. Suppose we keep \(F_{\textrm{net}}\) constant at \(6.0\textrm{ N}\) and vary the total mass. The acceleration should follow
\[a = \frac{F_{\textrm{net}}}{m}\]
so if mass doubles, acceleration should be cut in half. Plotting \(a\) versus \(\dfrac{1}{m}\) should again give a straight line, because
\[a = F_{\textrm{net}} \left(\frac{1}{m}\right)\]
where \(F_{\textrm{net}}\) is the slope.
These graphical checks turn raw data into visual evidence for Newton's second law, much like detectives turning clues into a clear picture of what happened.
Using Graphs to Test Laws of Nature
Whenever scientists suspect that two quantities are related by a simple equation, they search for a straight line when graphing data. A straight line with a predictable slope or intercept supports the law; random scatter or a curve suggests that the law is incomplete or does not apply under those conditions.
Later, when we interpret more complex motion (such as in car crashes), we still return to the simple, straight-line relationships first confirmed in controlled experiments like those related to [Figure 3].
Example 1: Finding Acceleration from Net Force and Mass
A \(1.5\textrm{ kg}\) cart moves along a straight track. A pulling device exerts \(5.0\textrm{ N}\) to the right, while friction exerts \(1.0\textrm{ N}\) to the left. Find the acceleration and its direction.
Step 1: Find the net force.
Take right as positive. Then the net force is \(F_{\textrm{net}} = 5.0 - 1.0 = 4.0\textrm{ N}\) to the right.
Step 2: Apply Newton's second law.
Use \(a = \dfrac{F_{\textrm{net}}}{m}\): \(a = \dfrac{4.0\textrm{ N}}{1.5\textrm{ kg}} \approx 2.67\textrm{ m/s}^2\).
The cart's acceleration is approximately \(2.67\textrm{ m/s}^2\) to the right.
Notice that, as in the cart illustrated in [Figure 1], we included friction as part of the net force. Ignoring friction when it is significant would make our data disagree with Newton's second law.
Example 2: Finding Mass from a Force–Acceleration Graph
An experiment keeps the same cart but changes the pulling force. The measured data pairs \((a, F_{\textrm{net}})\) lie roughly on a straight line. Two points on the best-fit line are \((1.5\textrm{ m/s}^2, 3.0\textrm{ N})\) and \((3.0\textrm{ m/s}^2, 6.0\textrm{ N})\). Estimate the mass of the cart.
Step 1: Compute the slope of the line.
\[\textrm{slope} = \frac{\Delta F_{\textrm{net}}}{\Delta a} = \frac{6.0 - 3.0}{3.0 - 1.5} = \frac{3.0}{1.5} = 2.0\textrm{ kg}\]
Step 2: Interpret the slope.
From \(F_{\textrm{net}} = ma\), the slope in a net-force-vs-acceleration graph is the mass. So the cart's mass is about \(2.0\textrm{ kg}\).
The graph in [Figure 3] shows a similar situation, where the line's slope equals the mass.
Example 3: Showing the Effect of Changing Mass
A thrust device pulls different carts along the same straight track with a constant net force of \(10.0\textrm{ N}\). The measured accelerations are:
Step 1: Check consistency with \(a = \dfrac{F_{\textrm{net}}}{m}\).
For Cart A: \(a = \dfrac{10.0}{1.0} = 10.0\textrm{ m/s}^2\). For Cart B: \(a = \dfrac{10.0}{2.0} = 5.0\textrm{ m/s}^2\). For Cart C: \(a = \dfrac{10.0}{5.0} = 2.0\textrm{ m/s}^2\).
Step 2: Interpret the pattern.
When mass doubles (from 1.0 to 2.0 kg), acceleration halves (10.0 to 5.0 m/s\(^2\)). When mass increases by a factor of 5 (1.0 to 5.0 kg), acceleration decreases by a factor of 5 (10.0 to 2.0 m/s\(^2\)). This inverse relationship matches Newton's second law.
The consistent numerical pattern supports the claim that \(a = \dfrac{F_{\textrm{net}}}{m}\) for these carts.
Real objects often experience friction, air resistance, or other forces that complicate motion. Still, the second law remains valid if we correctly include all forces in the net force.
For a car braking in a straight line, the main horizontal forces are the friction force between the tires and the road (opposite the motion) and small air-resistance forces. The net force determines the car's straight-line deceleration. If braking tests show that doubling the braking force doubles the magnitude of the deceleration, that is evidence that the car's motion follows Newton's second law, just like the cart in [Figure 1].
Sometimes we cannot measure every force directly. Instead, we infer them from acceleration data. For example, if a cart of known mass is pushed so it accelerates at \(1.0\textrm{ m/s}^2\) to the right and we know the applied pulling force is \(6.0\textrm{ N}\), then the net force must be \(F_{\textrm{net}} = ma = (2.0)(1.0) = 2.0\textrm{ N}\) to the right for a \(2.0\textrm{ kg}\) cart. That means friction and other opposing forces must total \(6.0 - 2.0 = 4.0\textrm{ N}\) to the left.
This process—using measured acceleration and known mass to work backward to unknown forces—is a common technique in engineering. It assumes Newton's second law is correct; if the inferred forces match what we expect from materials and design, the data support the law.
Newton's second law is not just a classroom rule. It is built into the design of many technologies you interact with every day.
Vehicle safety: Crash-test engineers analyze how cars decelerate during collisions. By knowing the mass of the car and measuring the deceleration along the straight-line crash direction, they calculate the net force on the vehicle and on crash-test dummies. Safety features like seat belts, crumple zones, and airbags are designed to reduce the acceleration (and therefore the force on people) by increasing the time and distance over which the car comes to rest.
Sports equipment: When a baseball bat hits a ball, the bat exerts a large force over a short time, changing the ball's velocity along a mostly straight line. The mass of the ball is fixed, so a larger net force produces a larger acceleration and a higher exit speed. Sports scientists and coaches measure these accelerations to optimize technique and equipment.
Rockets and propulsion: In the early stages of a rocket launch, engines produce a nearly constant thrust (a force) along the rocket's axis. As fuel burns and the rocket's mass decreases, the same thrust results in a larger acceleration. By plugging changing mass into \(a = \dfrac{F_{\textrm{net}}}{m}\), engineers can predict the rocket's vertical acceleration during different phases of the launch.
Industrial automation: Robotic arms moving objects along straight tracks must accelerate and decelerate smoothly. Controllers use Newton's second law to set motor forces that produce desired accelerations without overloading mechanical parts.
"I have not as yet been able to discover the reason for these properties of gravity from phenomena, and I do not feign hypotheses."
— Isaac Newton
While Newton did not guess at deeper causes, he showed that his laws accurately described the data. Today, when we analyze forces and accelerations in cars, rockets, or robots, we are continuing that tradition of checking nature against mathematical relationships.
Students often have intuitive ideas about motion that conflict with Newton's second law. Data help clear up these misunderstandings.
Misconception 1: "A bigger force always means a bigger speed, not a bigger acceleration." In reality, Newton's second law links force to acceleration, the change in velocity, not the velocity itself. A constant net force produces a constant acceleration, which can gradually build up a large speed over time. Data showing that doubling net force doubles acceleration (for the same mass) directly supports the law.
Misconception 2: "Heavier objects always fall faster." In the absence of air resistance, all objects near Earth's surface accelerate downward at roughly \(9.8\textrm{ m/s}^2\), regardless of mass. The gravitational force on a heavier object is larger, but so is its mass, and the two effects cancel in \(a = \dfrac{F_{\textrm{net}}}{m}\). At everyday speeds where air resistance matters, lighter objects with larger surface areas can fall more slowly, but careful experiments (dropping objects in a vacuum tube) show that Newton's second law still holds.
Misconception 3: "If an object is moving, there must be a net force in the direction of motion." Actually, an object moving in a straight line at constant velocity has zero acceleration and therefore zero net force. Experiments where an object glides along a nearly frictionless track show that, once pushed, it continues moving at almost constant velocity even after the push ends. These data support the idea that net force is required to change motion, not to maintain it.
In each case, analyzing careful measurements of force, mass, and acceleration helps us decide whether our mental picture or Newton's mathematical law is closer to reality. Over and over, the data favor Newton's law for macroscopic objects moving in one dimension at non-relativistic speeds.
Before applying Newton's second law, always identify the object or system you are analyzing, list all forces along the line of motion, and compute the net force. Then use \(F_{\textrm{net}} = ma\) to connect that net force to the object's acceleration.
The experimental setups you have seen, like the cart and hanging mass in [Figure 2], are deliberately simple so that the data clearly reveal this fundamental relationship.