A tiny map can represent an entire city. A floor plan that fits on paper can describe a real house. A model car can be much smaller than the real thing but still keep the same shape. That is the power of scale drawings: they let us work with sizes that would otherwise be too large or too small to handle easily.
People use scale drawings in many jobs and activities. Architects draw buildings before construction begins. Engineers sketch machines and bridges. Cartographers make maps. Video game designers build worlds using measurements that must stay proportional. In all of these cases, the drawing is not the actual size, but it still tells the truth about the shape and measurements.
To use a scale drawing correctly, you must know how drawing measurements and actual measurements are connected. Once you understand that relationship, you can find missing lengths, compare figures, and even create a new version of the same drawing at a different scale.
You already know that ratios compare two quantities and that proportions show two equal ratios. Scale drawings use both ideas constantly. If two lengths match in a scale drawing, their ratio stays the same.
Another important idea is that scale drawings keep the shape of a figure. Angles stay equal, and side lengths change in the same proportion. This is why scale drawings are closely connected to similar figures.
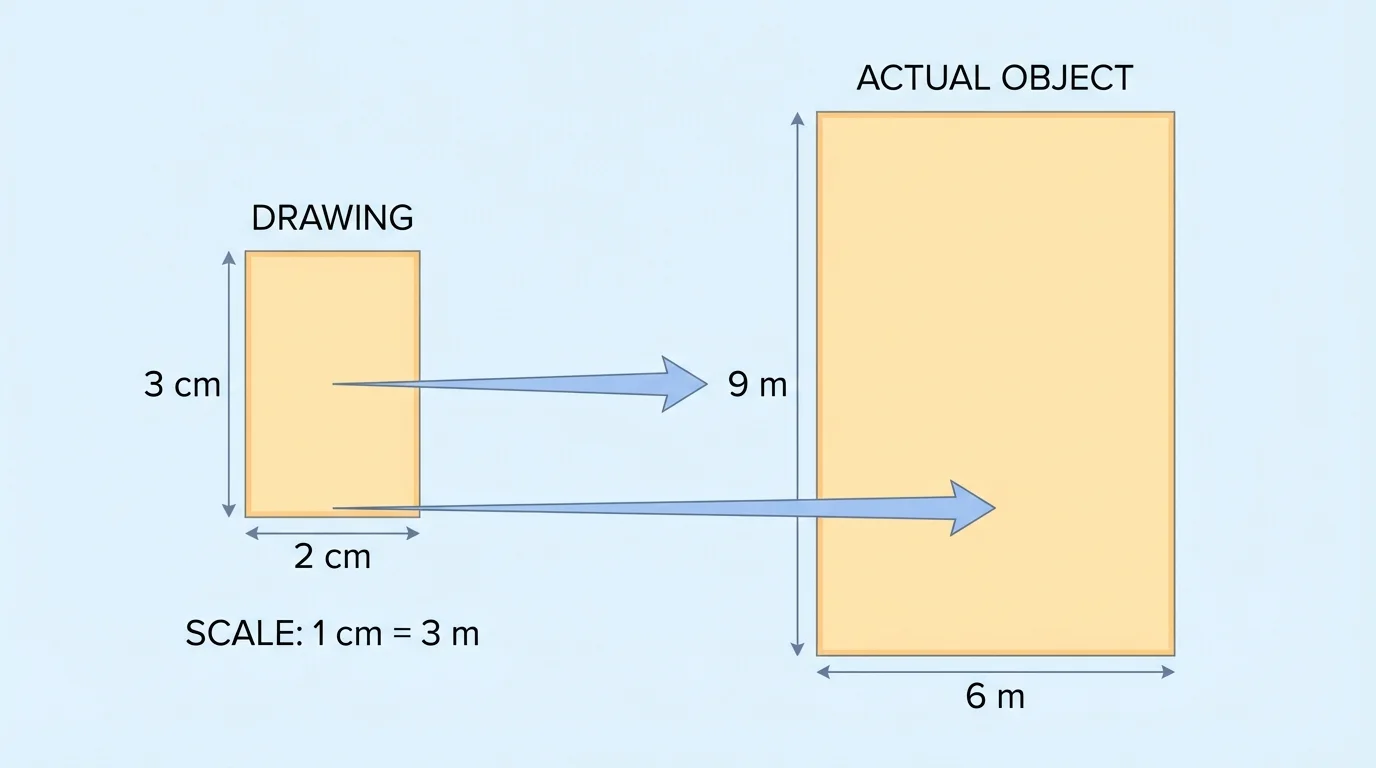
A scale drawing is a drawing of an object where every length is enlarged or reduced by the same ratio. The ratio that connects the drawing to the real object is called the scale. The matching sides or distances are called corresponding lengths, and they must stay proportional, as [Figure 1] shows.
For example, if a rectangle on paper is half as long and half as wide as the real rectangle, then the drawing and the real rectangle have the same shape. Every side in the drawing corresponds to a side in the real object.
The actual length is the real measurement of the object. A drawing length is the measurement you see on the paper, screen, map, or plan. If the scale is known, you can move back and forth between these two kinds of measurements.
Scale drawing means a picture of an object in which all lengths are changed by the same ratio.
Scale is the ratio between a length on the drawing and the corresponding actual length.
Actual length is the real measurement of the object.
Corresponding lengths are lengths that match the same part of two similar figures.
Suppose a drawing uses the scale \(1:4\). This means every \(1\) unit on the drawing stands for \(4\) units in real life. A side that measures \(3 \textrm{ cm}\) on the drawing would represent \(12 \textrm{ cm}\) in reality.
Scales can be written in different ways. You might see \(1:50\), or "\(1 \textrm{ cm} = 50 \textrm{ cm}\)," or "\(1\) inch represents \(10\) feet." These all describe how a drawing and a real object are related.
It is very important to pay attention to units. A scale works best when the units being compared are the same. For example, the scale \(1 \textrm{ cm} : 5 \textrm{ m}\) can be used, but calculations are easier if you convert \(5 \textrm{ m}\) to \(500 \textrm{ cm}\). Then the scale becomes \(1:500\).
| Scale form | Meaning |
|---|---|
| \(1:10\) | \(1\) unit on drawing represents \(10\) actual units |
| \(1 \textrm{ cm} = 2 \textrm{ m}\) | Every \(1 \textrm{ cm}\) on drawing represents \(2 \textrm{ m}\) in reality |
| \(2:1\) | Drawing is enlarged; \(2\) drawing units represent \(1\) actual unit |
Table 1. Common ways to write and interpret a scale.
Most school problems use a reduction scale, where the drawing is smaller than the actual object. But sometimes a drawing is enlarged, such as a cell shown under a microscope or a tiny machine part shown in a diagram.
Maps often use several kinds of scale at once. A printed map may show a ratio scale such as \(1:100{,}000\) and also a bar scale that lets you measure distance even if the map is resized.
When the drawing and actual units differ, convert first, then set up the ratio. That small habit prevents many mistakes later.
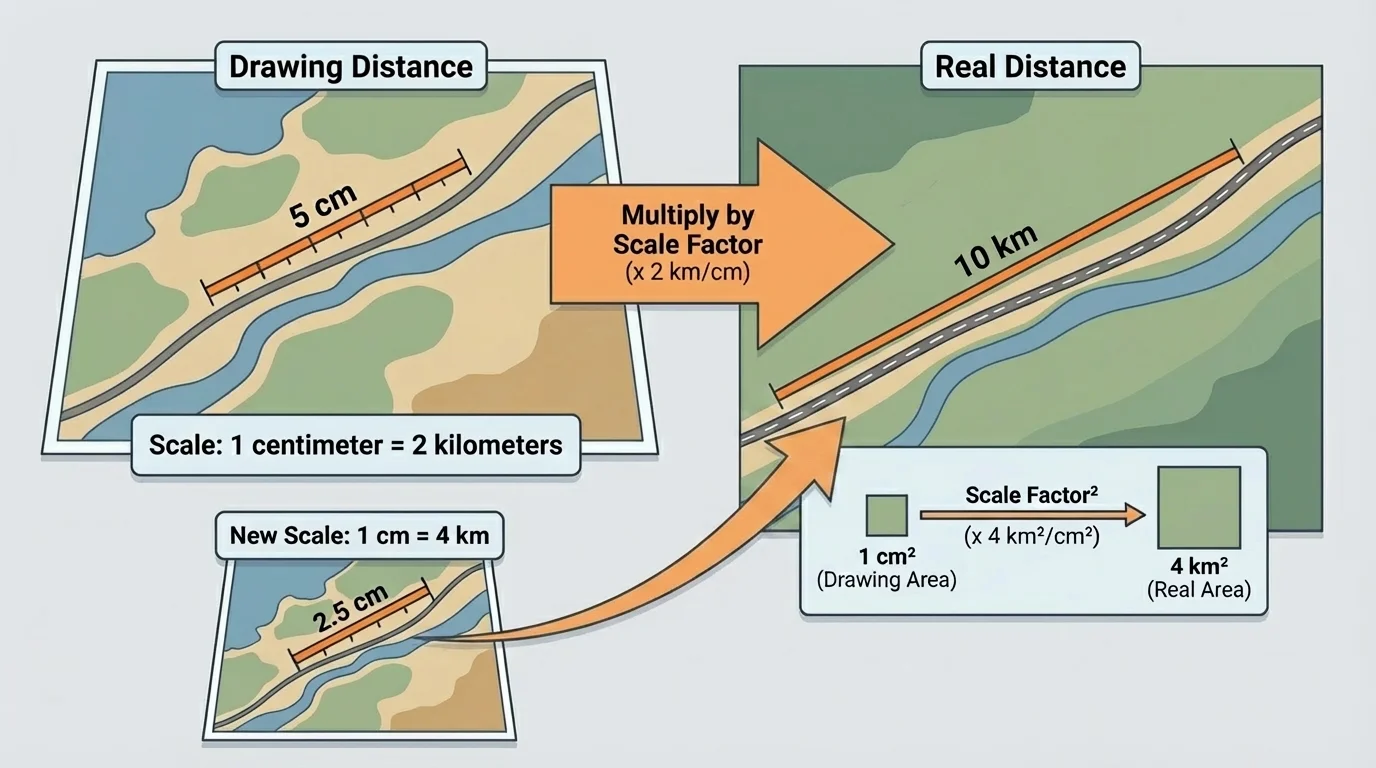
When you know a measurement on the drawing and want the real measurement, you usually multiply by the scale factor from drawing to actual. A scale tells how each drawing unit matches a real unit, as [Figure 2] illustrates with a measured route on a map.
If the scale is \(1:8\), then every \(1\) unit on the drawing equals \(8\) real units. So a drawing length of \(5\) units represents \(40\) real units, because \(5 \times 8 = 40\).
Worked example 1
A map uses the scale \(1 \textrm{ cm} = 3 \textrm{ km}\). Two towns are \(4.5 \textrm{ cm}\) apart on the map. Find the actual distance.
Step 1: Identify the scale relationship.
Each \(1 \textrm{ cm}\) on the map represents \(3 \textrm{ km}\) in real life.
Step 2: Multiply the map distance by the actual distance per centimeter.
\(4.5 \times 3 = 13.5\)
Step 3: State the answer with units.
\[13.5 \textrm{ km}\]
The towns are \(13.5 \textrm{ km}\) apart.
You can also solve these problems with a proportion. For the same example, you could write \(\dfrac{1}{3} = \dfrac{4.5}{x}\), where \(x\) is the actual distance in kilometers. Solving gives the same answer: \(x = 13.5\).
Proportions are especially helpful when the numbers are less friendly or when you want to check that your setup makes sense.
Worked example 2
A blueprint uses the scale \(1:100\). A wall measures \(6.2 \textrm{ cm}\) on the blueprint. What is the actual length of the wall?
Step 1: Interpret the scale.
\(1:100\) means \(1 \textrm{ cm}\) on the blueprint represents \(100 \textrm{ cm}\) in reality.
Step 2: Multiply by \(100\).
\(6.2 \times 100 = 620\)
Step 3: Convert units if needed.
\(620 \textrm{ cm} = 6.2 \textrm{ m}\)
Step 4: Write the result.
\[6.2 \textrm{ m}\]
The actual wall length is \(6.2 \textrm{ m}\).
Notice that the number happened to stay \(6.2\), but the units changed from centimeters on the plan to meters in real life. That kind of coincidence can be misleading, so always track the units carefully.
Sometimes you know the real measurement and want to know how long it should be in the drawing. In that case, you usually divide by the drawing-to-actual scale factor.
For example, if the scale is \(1:20\) and the real object is \(140 \textrm{ cm}\) long, then the drawing length is \(140 \div 20 = 7 \textrm{ cm}\).
Worked example 3
A classroom is \(9 \textrm{ m}\) long. A floor plan will use the scale \(1 \textrm{ cm} = 1.5 \textrm{ m}\). How long should the classroom be on the floor plan?
Step 1: Compare actual length with the scale.
Each \(1 \textrm{ cm}\) on the plan represents \(1.5 \textrm{ m}\).
Step 2: Divide the actual length by \(1.5\).
\(9 \div 1.5 = 6\)
Step 3: State the drawing length.
\[6 \textrm{ cm}\]
The classroom should be \(6 \textrm{ cm}\) long on the floor plan.
If the scale is written as a ratio such as \(1:250\), then a real length of \(1{,}000 \textrm{ cm}\) would become \(1{,}000 \div 250 = 4 \textrm{ cm}\) on the drawing.
As with [Figure 1], the important idea is that corresponding sides keep a constant ratio. If one side uses the scale correctly, every side must use the same scale.
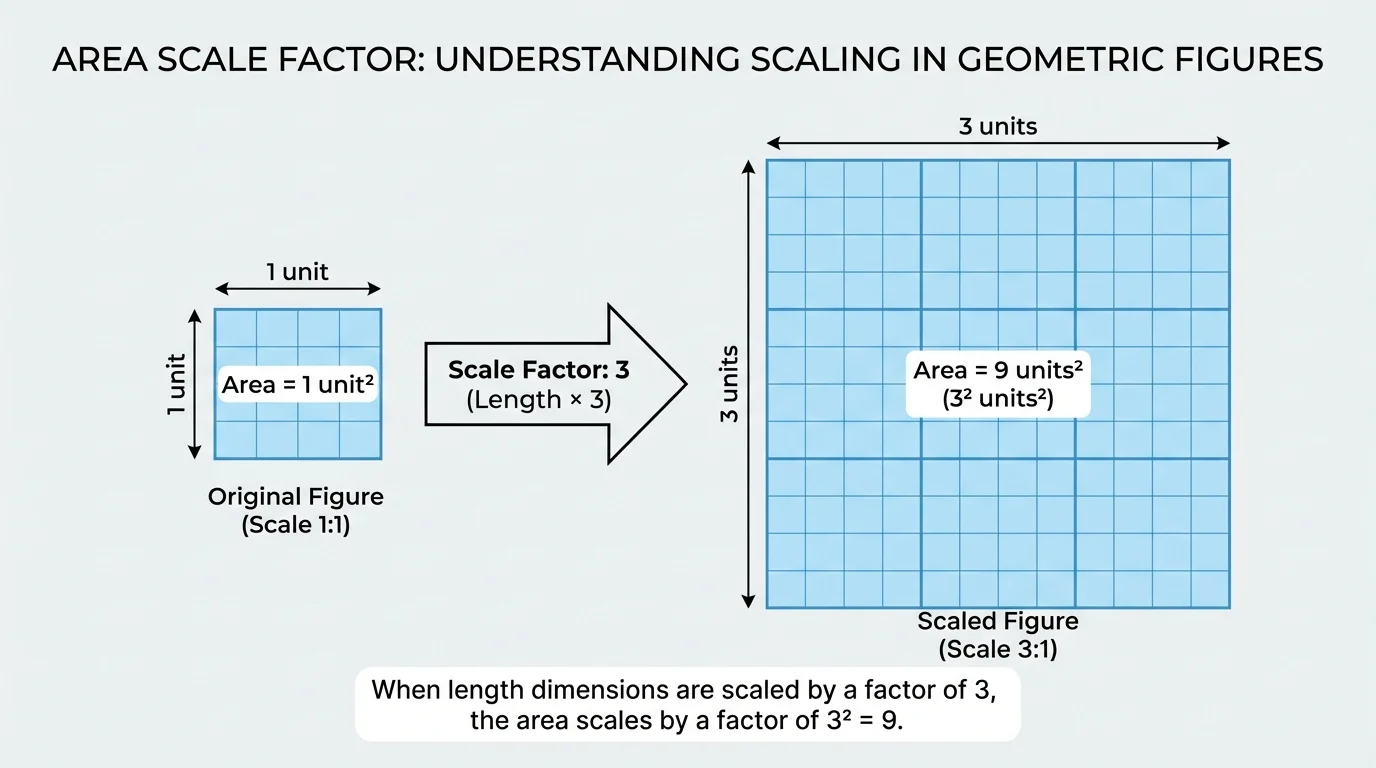
Length and area do not change the same way. If side lengths are multiplied by some factor, then areas are multiplied by the scale factor squared. This is one of the most important ideas in the topic, and [Figure 3] makes the difference between length change and area change easier to see.
Suppose the side length of a square is multiplied by \(3\). The new square is not just \(3\) times the area. Its area is \(3^2 = 9\) times as large. That happens because both the length and the width are multiplied by \(3\).
If a scale drawing has a length scale of \(1:50\), then the area scale is \(1^2:50^2\), which simplifies to \(1:2{,}500\). So each square unit on the drawing represents \(2{,}500\) square units in reality, as long as the units are matched correctly.
Why area uses the square of the scale factor
Area measures two dimensions: length and width. If each dimension is multiplied by \(k\), then the area is multiplied by \(k \times k = k^2\). That is why a length scale of \(4\) gives an area scale of \(16\), not \(4\).
This idea also works in reverse. If you reduce every side by a factor of \(2\), the area becomes \(\left(\dfrac{1}{2}\right)^2 = \dfrac{1}{4}\) of the original area.
Worked example 4
A rectangular garden is shown on a drawing with scale \(1 \textrm{ cm} = 4 \textrm{ m}\). On the drawing, the garden measures \(3 \textrm{ cm}\) by \(5 \textrm{ cm}\). Find the actual area.
Step 1: Find the actual side lengths.
Length: \(3 \times 4 = 12 \textrm{ m}\)
Width: \(5 \times 4 = 20 \textrm{ m}\)
Step 2: Use the area formula for a rectangle.
\(A = l \times w\)
Step 3: Substitute the actual dimensions.
\(A = 12 \times 20 = 240\)
Step 4: Give the area with square units.
\[240 \textrm{ m}^2\]
The actual area of the garden is \(240 \textrm{ m}^2\).
You could also find the drawing area first: \(3 \times 5 = 15 \textrm{ cm}^2\). Since the length scale is \(4\), the area scale is \(16\). Then \(15 \times 16 = 240\), which matches the answer in square meters. This matches the pattern shown in [Figure 3].
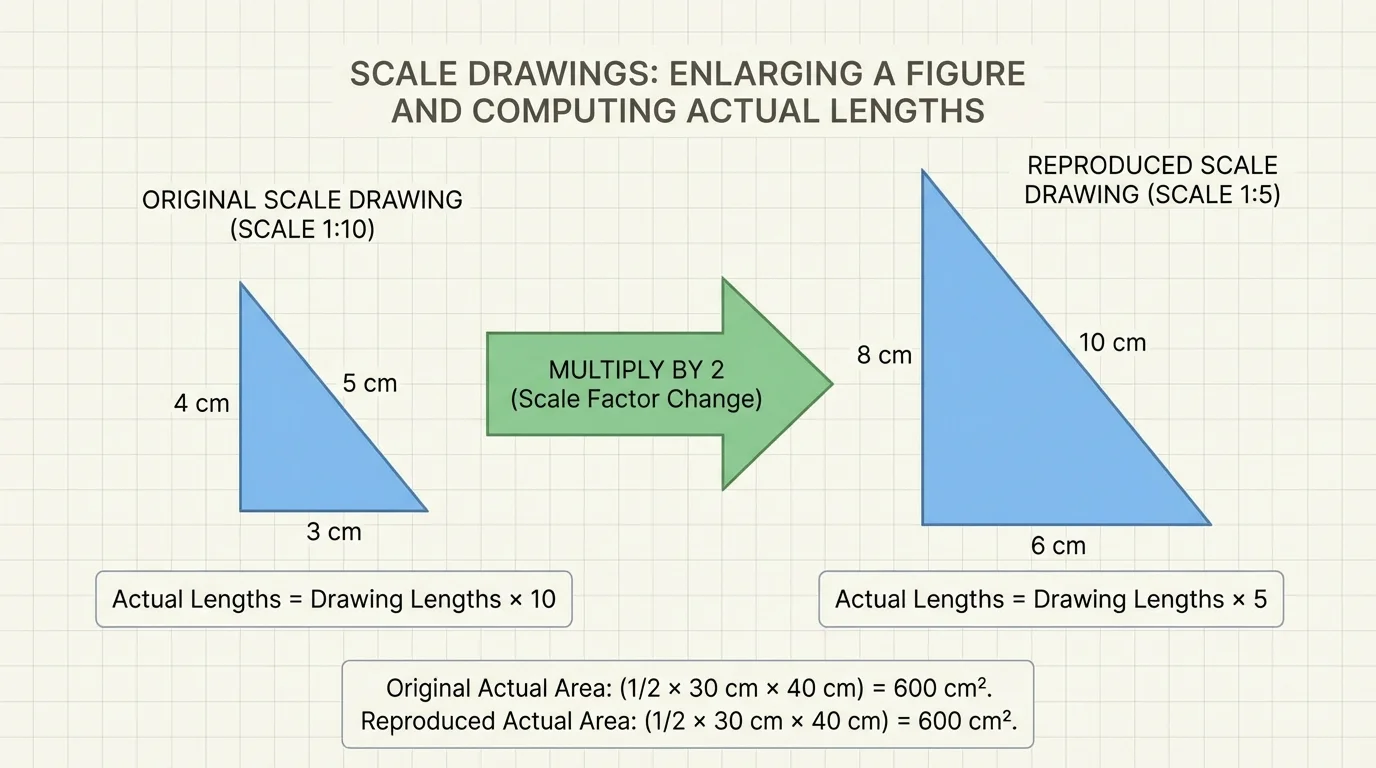
Sometimes you are given one scale drawing and asked to make a new one at a different scale. In that case, compare the old drawing and the new drawing directly. The change from one drawing to the other is another scale factor, as [Figure 4] shows.
For example, suppose a map is drawn at scale \(1:200\), and you want a new drawing at scale \(1:100\). The new drawing will be larger, because each drawing unit now represents less actual distance. Since \(\dfrac{200}{100} = 2\), every length in the new drawing should be \(2\) times the old drawing length, as [Figure 4] shows.
If you switch the other way, from \(1:100\) to \(1:200\), then the new drawing will be half as large. Every side length in the new drawing would be multiplied by \(\dfrac{1}{2}\).
Worked example 5
A triangle has sides \(4 \textrm{ cm}\), \(6 \textrm{ cm}\), and \(8 \textrm{ cm}\) on a drawing with scale \(1:50\). Reproduce the drawing at scale \(1:25\).
Step 1: Compare the two scales.
The old drawing uses \(1:50\). The new drawing uses \(1:25\).
Step 2: Find how much larger the new drawing should be.
\(\dfrac{50}{25} = 2\), so every side in the new drawing is \(2\) times the old drawing length.
Step 3: Multiply each side by \(2\).
\(4 \times 2 = 8\)
\(6 \times 2 = 12\)
\(8 \times 2 = 16\)
Step 4: State the new side lengths.
\[8 \textrm{ cm},\ 12 \textrm{ cm},\ 16 \textrm{ cm}\]
The reproduced triangle should have side lengths \(8 \textrm{ cm}\), \(12 \textrm{ cm}\), and \(16 \textrm{ cm}\).
This works because both drawings represent the same real triangle. The second drawing is simply a larger version of the first drawing, with all corresponding lengths multiplied by the same number.
One common mistake is mixing units. If a scale compares centimeters and meters, convert before calculating. For instance, \(1 \textrm{ cm} = 2 \textrm{ m}\) is easier to use as \(1 \textrm{ cm} = 200 \textrm{ cm}\) when setting up a ratio with centimeters.
Another mistake is using multiplication when division is needed, or division when multiplication is needed. Ask yourself: "Am I going from drawing to actual, or from actual to drawing?" Drawing to actual usually means multiply. Actual to drawing usually means divide.
A third mistake is treating area like length. If the side length doubles, the area becomes \(4\) times as large, not \(2\) times. If the side length triples, the area becomes \(9\) times as large.
"Same shape, proportional sides."
— The big idea behind scale drawings
It also helps to estimate before finishing. If a map distance is only \(2 \textrm{ cm}\), an answer of \(2{,}000 \textrm{ km}\) would make sense only if the scale is extremely large. Quick estimates can catch errors before they become final answers.
Scale drawings are everywhere. Architects use them to design rooms, doors, windows, and staircases. A contractor may look at a blueprint to know how long a wall should be or how much floor area must be covered. Since shapes and measurements must match exactly, proportional reasoning is essential.
Maps are another clear example. If you measure a road on a map, the scale tells the actual distance. Hikers, drivers, and pilots all rely on this idea. Even phone maps are based on scaling, though the app performs the calculations for you.
Engineers and product designers also use scale drawings and models before building real objects. A bridge design might begin on a page, but every part must still match the intended real dimensions. A model airplane or a museum display may use a reduced scale so people can study the object more easily.
Sports fields can also be planned with scale drawings. A coach or grounds crew may sketch where lines and equipment belong. If the sketch is accurate, the real field can be marked correctly.
Whenever a figure must be drawn, resized, or measured while keeping the same shape, scale drawings provide the mathematical tool to do it correctly.