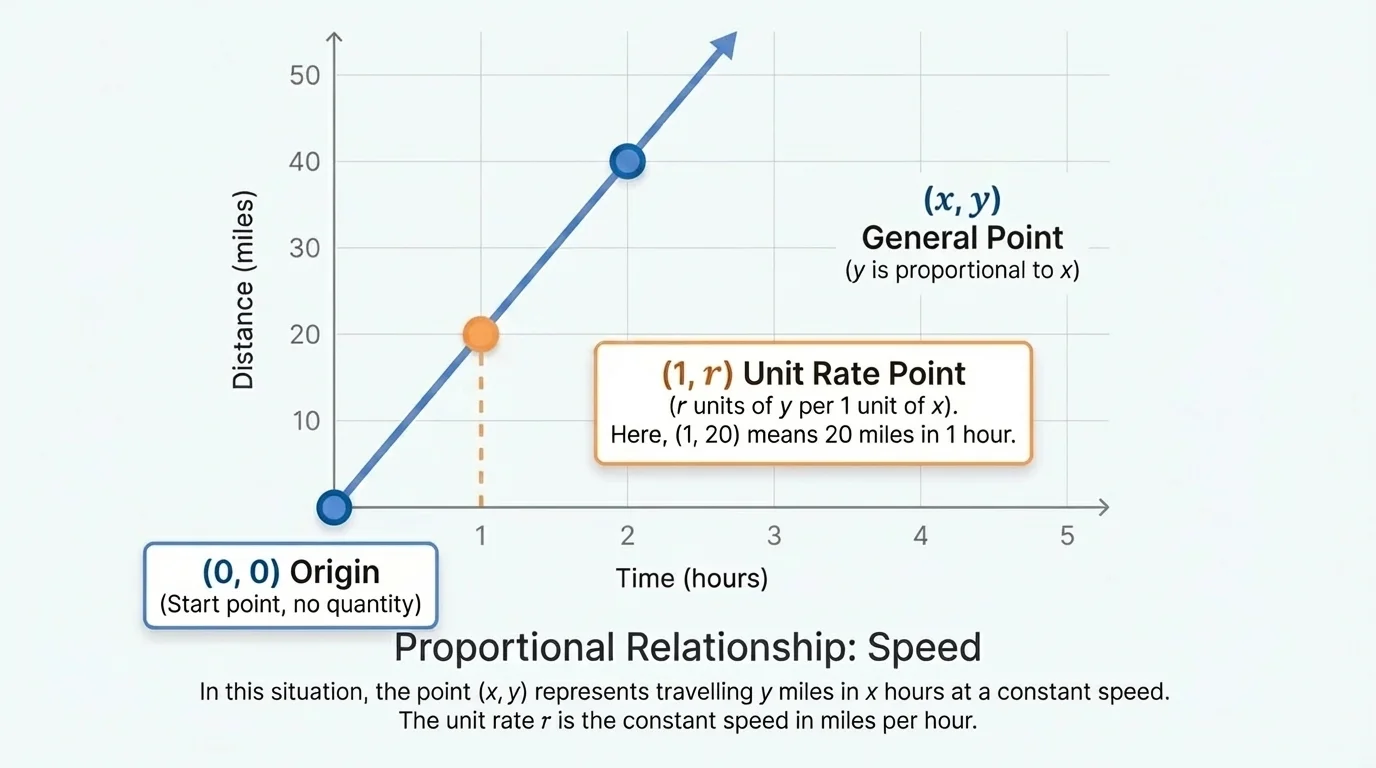
If a bike travels at a steady speed, a graph of time and distance is more than a picture of dots and lines. Every point on that graph tells a tiny story: after a certain amount of time, the bike has gone a certain distance. That is what makes proportional graphs so useful. They turn rates into visual patterns, and once you understand what each point means, you can read a graph almost like reading a sentence.
In many real situations, one quantity changes at a constant rate compared to another. A taxi fare may charge the same amount per mile. A recipe may use the same amount of flour for each batch. A worker may earn the same amount each hour. When the relationship keeps the same ratio, the graph represents a proportional relationship, and each point gives a matched pair of values from the situation.
For example, if apples cost $2 per pound, then buying \(3\) pounds costs $6. On a graph where \(x\) is pounds of apples and \(y\) is cost, the point \((3, 6)\) means that \(3\) pounds of apples cost $6. The graph is not just showing a location. It is showing a fact about the situation.
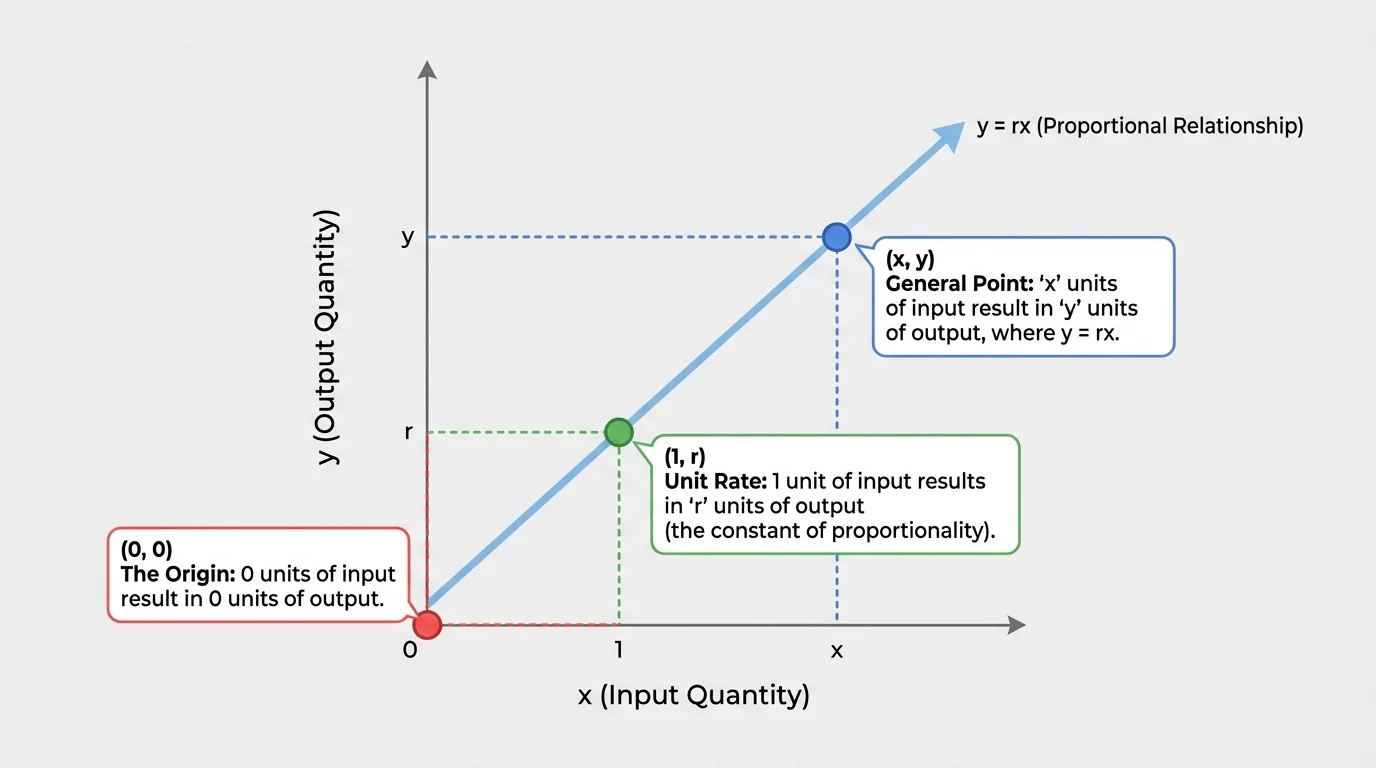
On a coordinate plane, a point \((x, y)\) tells two values at once. The first number, \(x\), is the horizontal coordinate, and the second number, \(y\), is the vertical coordinate.
[Figure 1] When you read a graph, always ask: What does the \(x\)-value stand for? What does the \(y\)-value stand for? Without the context, a point is just numbers. With the context, it has meaning.
A proportional relationship is a relationship between two quantities in which their ratio stays constant. If \(y\) is proportional to \(x\), then the relationship can be written as \(y = rx\), where \(r\) is the constant ratio. On a graph, this appears as a straight line through the origin.
The number \(r\) is called the constant of proportionality. It tells how much \(y\) changes for each \(1\) unit of \(x\). In many situations, this is also the unit rate. For example, if a runner goes \(5\) miles in \(1\) hour, then the unit rate is \(5\) miles per hour, so \(r = 5\).
The equation for a proportional relationship is
\(y = rx\)
This equation matters because it tells you what every point means. If you know \(x\), you can multiply by \(r\) to find \(y\). If a graph matches this rule, then every plotted point represents a pair of values that fit the same constant rate.
Proportional relationship: a relationship in which two quantities have a constant ratio and can be written as \(y = rx\).
Unit rate: the amount of \(y\) for each \(1\) unit of \(x\).
Because the graph is a line, students sometimes focus only on the shape. But the most important idea is the meaning of the points on that line. A proportional graph is powerful because every point agrees with the same rate.
A point \((x, y)\) on the graph of a proportional relationship means that when the first quantity is \(x\), the second quantity is \(y\). The two numbers belong together.
Suppose a babysitter earns $12 per hour. Then the relationship between hours worked and money earned is
\(y = 12x\)
where \(x\) is hours and \(y\) is dollars earned. The point \((4, 48)\) means that after \(4\) hours, the babysitter earns $48. The point \((2.5, 30)\) means that after \(2.5\) hours, the babysitter earns $30.
Notice that the point does not mean "\(x\) and \(y\) are separate facts." It means "these two values happen together." That is the key to interpreting graphs correctly.
Here are some examples of point meanings in context:
| Situation | Point | Meaning |
|---|---|---|
| Cost of bananas at $3 per pound | \((2, 6)\) | \(2\) pounds cost $6 |
| Distance at \(60\) miles per hour | \((1.5, 90)\) | In \(1.5\) hours, \(90\) miles are traveled |
| Water filling at \(8\) liters per minute | \((5, 40)\) | In \(5\) minutes, \(40\) liters fill the tank |
Table 1. Examples of how points on graphs of proportional relationships match real-world situations.
One point on every proportional graph is especially important: \((0, 0)\). This point is called the origin.
In a proportional relationship, if \(x = 0\), then
\[y = r(0) = 0\]
so \(y = 0\). That means the graph must pass through \((0, 0)\).
In context, \((0, 0)\) means that if there are zero units of the first quantity, there are zero units of the second quantity. For example:
This makes sense for proportional situations because nothing starts with a fixed extra amount. There is no starting fee, no beginning distance, and no bonus already included.
Why the origin matters
The point \((0, 0)\) helps you tell whether a graph is proportional. If a line does not pass through the origin, then the relationship is not proportional, even if the graph is straight. A straight line with a starting amount other than zero represents a different kind of relationship.
[Figure 2] For instance, if a taxi charges a $3 starting fee plus $2 for each mile, the equation is \(y = 2x + 3\). That graph is a straight line, but it does not go through \((0, 0)\). The point at \(x = 0\) would be \((0, 3)\), meaning the cost is already $3 before any miles are traveled. That is not proportional.
Another very important point is \((1, r)\). This point shows the unit rate directly on the graph. Since the equation is \(y = rx\), when \(x = 1\), we get \(y = r\).
So the point \((1, r)\) means that for \(1\) unit of the first quantity, there are \(r\) units of the second quantity. That is exactly what a unit rate tells you.
If oranges cost $2.50 per pound, then the proportional relationship is \(y = 2.5x\). The point \((1, 2.5)\) means that \(1\) pound costs $2.50. If a machine prints \(18\) pages per minute, then the point \((1, 18)\) means in \(1\) minute it prints \(18\) pages.
The point \((1, r)\) is helpful because it gives the rate without needing to divide. On a graph, you can often find the unit rate by looking for where the line passes when \(x = 1\). Later, when you compare other points on the same line, you can see that they are all built from that same rate.
A graph can reveal the unit rate even when the situation is not described in words. If you can identify the point where \(x = 1\), the matching \(y\)-value tells the constant of proportionality.
This idea is one reason graphs are so useful. A single point can reveal the rate for the entire relationship.
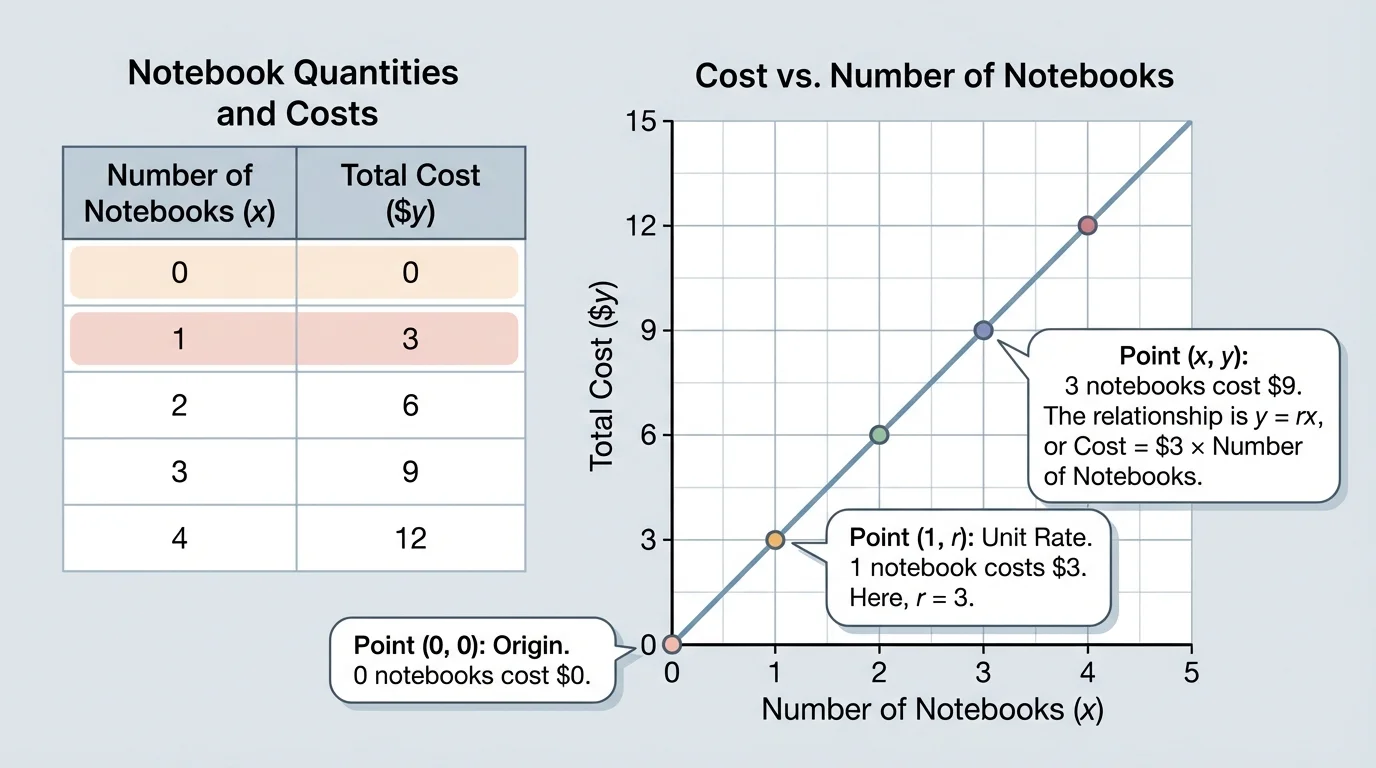
Good math thinking means connecting words, tables, equations, and graphs, and [Figure 3] shows how the same proportional relationship can appear in more than one form. If you understand what a point means, you can move easily among these forms.
Suppose notebooks cost $1.50 each. Then the relationship between number of notebooks and total cost is \(y = 1.5x\). A table might list \((1, 1.5)\), \((2, 3)\), and \((4, 6)\). On the graph, those same values appear as points.
If you see the point \((4, 6)\), you can say, "\(4\) notebooks cost $6." If you see \((0, 0)\), you can say, "\(0\) notebooks cost $0." If you see \((1, 1.5)\), you can say, "\(1\) notebook costs $1.50," so the unit rate is $1.50 per notebook.
To write a situation from a graph, start by reading the axis labels. Then choose a point and interpret it in words. Ask what the point says about the two quantities together.
To check whether the graph is proportional, look for two clues: the graph is a straight line, and it passes through the origin. Then use the point where \(x = 1\), if visible, to find the unit rate.
These examples show how to interpret points and use the special points \((0, 0)\) and \((1, r)\).
Worked Example 1
A gym charges $8 for each class. Let \(x\) be the number of classes and \(y\) be the total cost. What does the point \((5, 40)\) mean?
Step 1: Identify the quantities.
Here, \(x\) represents number of classes, and \(y\) represents total cost.
Step 2: Read the coordinates in order.
The point \((5, 40)\) means \(x = 5\) and \(y = 40\).
Step 3: Write the meaning in words.
If a student attends \(5\) classes, the total cost is $40.
This point tells one true fact about the proportional relationship.
Notice that the point gives a complete statement about the situation, not just a pair of numbers.
Worked Example 2
A faucet fills containers at a constant rate of \(6\) liters per minute. Explain the meanings of \((0, 0)\) and \((1, 6)\).
Step 1: Write the equation.
Since the rate is \(6\) liters per minute, the relationship is \(y = 6x\), where \(x\) is minutes and \(y\) is liters.
Step 2: Interpret \((0, 0)\).
The point \((0, 0)\) means that after \(0\) minutes, the container contains \(0\) liters of water.
Step 3: Interpret \((1, 6)\).
The point \((1, 6)\) means that after \(1\) minute, the container contains \(6\) liters of water.
Step 4: Connect \((1, 6)\) to the rate.
Because \(x = 1\), the \(y\)-value gives the unit rate. So the faucet fills at \(6\) liters per minute.
The points \((0, 0)\) and \((1, 6)\) are especially useful because they reveal both the starting value and the unit rate.
These two points appear in every proportional situation, although the value of \(r\) changes.
Worked Example 3
A graph shows a proportional relationship between hours and money earned. The line passes through \((0, 0)\) and \((1, 14)\). What does the point \((3, 42)\) mean?
Step 1: Find the unit rate from \((1, 14)\).
When \(x = 1\), \(y = 14\), so the unit rate is \(14\). This means the person earns $14 per hour.
Step 2: Interpret the point \((3, 42)\).
The point \((3, 42)\) means in \(3\) hours, the person earns $42.
Step 3: Check with multiplication.
Since \(y = 14x\), substituting \(x = 3\) gives \(y = 14 \cdot 3 = 42\).
The point matches the proportional relationship because it uses the same constant rate.
Step-by-step interpretation helps prevent one of the most common mistakes: reversing the meaning of \(x\) and \(y\).
Worked Example 4
Suppose a graph has the point \((1, 4)\) on a proportional line. Find the equation and explain what \((0, 0)\) means if \(x\) is pounds of rice and \(y\) is cost in dollars.
Step 1: Use \((1, 4)\) to find the unit rate.
Since \(x = 1\), the value of \(y\) is the unit rate. So \(r = 4\).
Step 2: Write the equation.
The equation is \(y = 4x\).
Step 3: Interpret \((0, 0)\).
The point \((0, 0)\) means \(0\) pounds of rice cost $0.
This confirms the relationship is proportional: there is no starting fee or extra fixed cost.
Proportional graphs appear in many parts of everyday life. If a car is moving at a constant speed, a point on the graph of time versus distance tells how far it has gone after a certain time. If a person is paid by the hour, a point on the graph of hours versus earnings tells how much money has been earned. If ingredients are scaled in a recipe, a point on the graph of batches versus cups of flour tells how much flour is needed.
Technology uses proportional thinking too. If a phone downloads data at a constant rate of \(20\) megabytes per second, then the point \((3, 60)\) means that in \(3\) seconds, \(60\) megabytes download. The point \((1, 20)\) gives the unit rate immediately. The point \((0, 0)\) means that in \(0\) seconds, \(0\) megabytes have downloaded.
Manufacturing, science, and business also depend on constant rates. A machine that produces the same number of parts every hour creates a proportional graph. A chemical solution mixed in the same ratio each time follows proportional reasoning. Whenever one quantity is "so much per \(1\)," proportional graphs are nearby.
One common mistake is thinking that any straight line is proportional. That is not true. A proportional graph must be a straight line and pass through \((0, 0)\).
Another mistake is reading a point backward. If \(x\) is hours and \(y\) is dollars, then \((2, 30)\) means \(2\) hours and $30, not $2 and \(30\) hours.
A third mistake is forgetting the meaning of \((1, r)\). This point is not just another dot. It tells the unit rate, which is the key rate for the whole relationship.
A fourth mistake is ignoring the labels on the axes. Two graphs can have the same shape but completely different meanings depending on what \(x\) and \(y\) represent. The notebook example connected the graph, the table, and the context in one picture, as seen in [Figure 3], and that is a helpful habit whenever you interpret data.
"A graph is not just a picture of numbers; it is a picture of a relationship."
When you understand what points mean, proportional graphs become much easier to read. Every point tells a story about two quantities changing together at a constant rate.