A storm tracker on the news might show a map, a moving radar image, a chart of rainfall, and a spoken explanation all at once. If you only listen to the words, you miss part of the story. If you only look at the map, you miss important details too. Strong readers know how to put these pieces together. That skill is called integrating information, and it helps you understand a topic more completely.
Authors do not always explain ideas using only paragraphs. They may include photos, diagrams, tables, timelines, maps, graphs, or captions because each format does a different job. Words can explain causes and effects. A graph can show change over time quickly. A diagram can point out parts of something. A table can organize many facts neatly.
When you bring these parts together, you create a fuller picture. This is called a coherent understanding. Instead of knowing a few separate facts, you understand how the facts connect.
Integrate information means to combine ideas from different sources, formats, or media so they work together to help you understand one topic. A format is the way information is presented, such as a paragraph, chart, diagram, or graph.
This skill matters in every subject. In science, you may read an article about animal habitats and also study a map and a food web diagram. In social studies, you may use a timeline, a photograph, and an informational passage. In everyday life, you might compare nutrition labels, instructions, and advertisements before choosing what to buy.
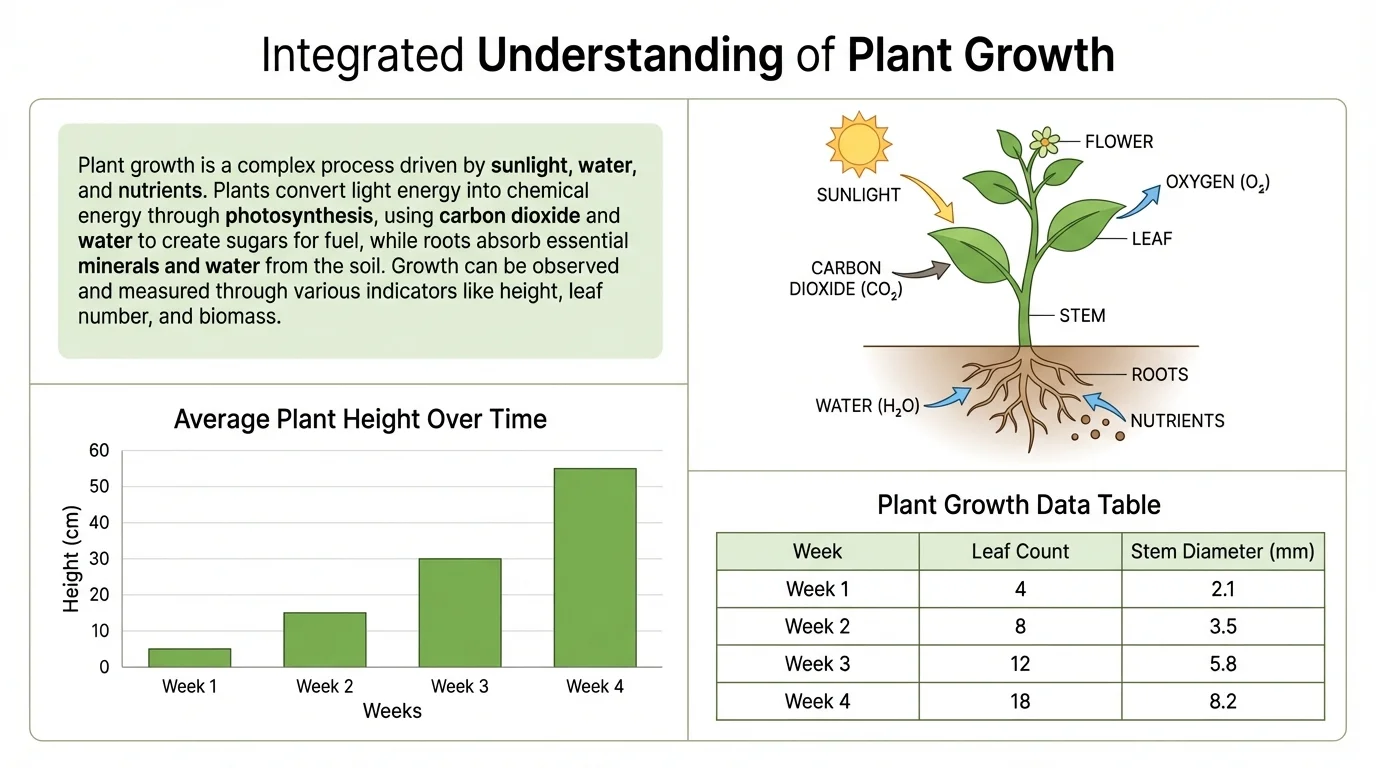
[Figure 1] shows how a single topic can appear in several forms. You might read a paragraph about how plants grow, examine a diagram of a plant, study a bar graph of height changes over time, and check a table of daily water amounts. All of those formats describe the same topic, but each one highlights something different.
Here are some common formats in informational texts:
| Format | What it helps show |
|---|---|
| Paragraph or article | Main ideas, explanations, details, causes, and effects |
| Caption | Short explanation connected to a picture or diagram |
| Table | Facts organized in rows and columns for easy comparison |
| Graph | Patterns, increases, decreases, or relationships in data |
| Diagram | Parts of an object or steps in a process |
| Map | Location and spatial relationships |
| Timeline | Order of events over time |
| Photo or illustration | What something looks like in real life or in a model |
Table 1. Common formats and the kinds of information they present.
Not every picture teaches something important. Some visuals are decorative, but many are essential. Good readers ask, "What information does this format add that the paragraph alone does not give me?"
For example, a paragraph might say that one plant grew faster than another. A table may show the exact heights on each day. A graph can help you notice the pattern more quickly. Together, these formats make the explanation more precise and easier to understand.
Reading different formats is not just about collecting bits of information. It is about connecting them. Suppose a passage says that bees are important pollinators. A diagram shows pollen moving from flower to flower. A chart shows that fruit production is higher when more pollinators are present. When you combine these pieces, you understand not only that bees matter, but why they matter and what effect they have.
This is where the idea of evidence becomes important. In informational texts, evidence can come from words, numbers, or images. A statement in a paragraph is one kind of evidence. A data table is another. A labeled diagram can also act as evidence when it shows how something works.
Building meaning across formats happens when a reader compares details, notices patterns, and asks how one format helps explain another. The goal is not to treat the paragraph, graph, and diagram as separate tasks. The goal is to use all of them to answer one big question about the topic.
Sometimes one format gives the main idea, and another gives supporting details. Sometimes a visual helps explain a part of the text that is confusing. Other times numbers help prove whether a written claim is accurate.
When you read an informational text with mixed formats, it helps to ask a series of questions. These questions keep you from staring at a chart without understanding it or reading a paragraph without noticing important data.
Ask these questions as you read:
This process helps you move from noticing separate details to forming an interpretation. An interpretation is a thoughtful understanding of what the information means.
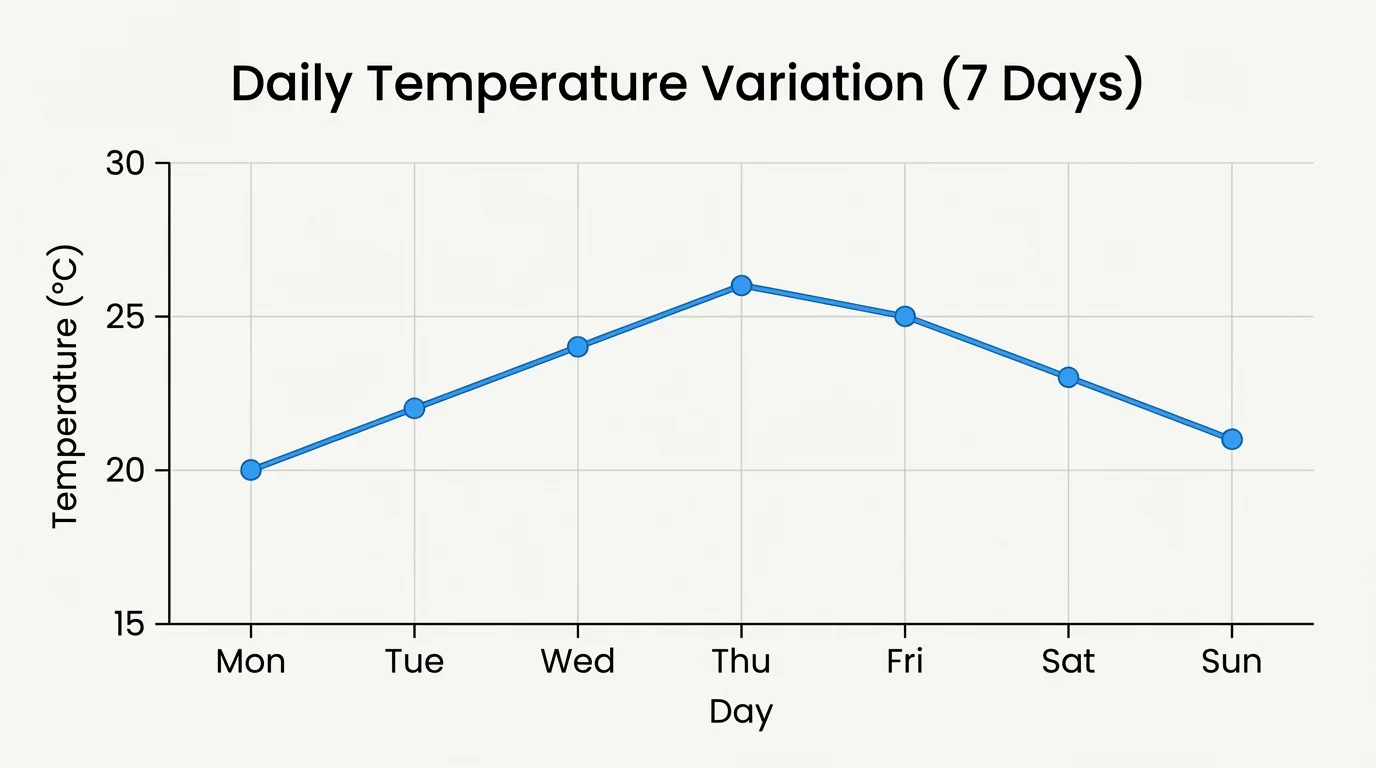
[Figure 2] shows that visuals can be extremely helpful, but only if you read them closely. Before making a conclusion, check the title, labels, symbols, key, and scale. A graph can be misleading if it is not read carefully, especially if you ignore what the axes represent.
For example, if a line graph shows temperature over five days, the horizontal axis may list the days, and the vertical axis may show degrees. If the line rises, you know the temperature increased. But to understand how much it increased, you must check the scale. A rise from one line to the next might mean an increase of only \(1\) degree, or it might mean an increase of \(5\) degrees.
Captions matter too. A photograph of a flooded street may look dramatic, but the caption might explain that the picture was taken after a rare storm. Without the caption, you might wrongly think floods happen there every day.
Diagrams often require close reading as well. Arrows, labels, and highlighted parts are not decorations. They show relationships. In a water cycle diagram, arrows explain movement from evaporation to condensation to precipitation. If you ignore the arrows, you miss the process.
Later, when you compare a written explanation of changing temperatures with the graph in [Figure 2], the graph helps you confirm whether the change is steady, sudden, or uneven across the days.
Some of the most useful information in an article is quantitative information, which means information shown with numbers. This might appear in a table, graph, chart, or labeled measurement in a diagram.
Numbers help you be exact. If a passage says that the school garden produced "much more" lettuce in spring than in winter, that claim is vague. But if a table shows that the garden produced \(12\) heads of lettuce in winter and \(30\) in spring, you can see the difference clearly. Spring produced \(30 - 12 = 18\) more heads of lettuce.
Example: Combining text and data
A paragraph says, "Students became more interested in reading after the new library corner opened." A bar chart shows the number of books checked out each month.
Step 1: Read the written claim.
The claim is that interest in reading increased after the library corner opened.
Step 2: Look for evidence in the chart.
If the chart shows \(40\) books checked out in September, \(55\) in October, and \(72\) in November, the numbers rise over time.
Step 3: Connect the formats.
The chart supports the claim because the number of books checked out increases after the new space opens.
The best conclusion is that the written statement is supported by quantitative evidence.
Quantitative information does not replace words. It works with words. The numbers tell how much, how many, or how often. The paragraph often explains why the numbers matter.
Sometimes the easiest integration happens when all the formats support the same idea. A text may explain that exercise strengthens the heart. A diagram shows the heart pumping blood. A chart shows lower resting heart rates in trained athletes. The formats all point in the same direction.
When this happens, your job is to combine them into one strong statement. You might say, "The article, diagram, and chart all show that regular exercise improves how well the heart works." That statement is stronger than repeating facts one by one because it shows understanding.
Scientists, doctors, and engineers rarely rely on just one kind of information. They often read written reports, study graphs, examine images, and compare measurements before making decisions.
Matching information across formats builds confidence in your conclusion. If several types of evidence lead to the same idea, the understanding becomes more reliable.
Sometimes different formats do not seem to agree at first. A paragraph may say a river is getting cleaner, but a graph might show one pollutant increasing during a certain month. This does not always mean one source is wrong. It may mean you need to read more carefully.
Check the details. Is the graph showing only one month while the paragraph discusses several years? Is the paragraph talking about the whole river while the map focuses on one area? Is there a caption that explains an unusual event?
A conflict can actually help you think more deeply. It pushes you to notice time, place, and conditions. Skilled readers do not panic when information seems different. They investigate.
When reading any informational text, remember to identify the main idea and supporting details first. Integration works best when you already understand the basic point of the text.
If a chart and a paragraph truly disagree, say so clearly. A good reader can explain, "The text claims one thing, but the data in the graph does not fully support that claim." That is a thoughtful response, not a mistake.
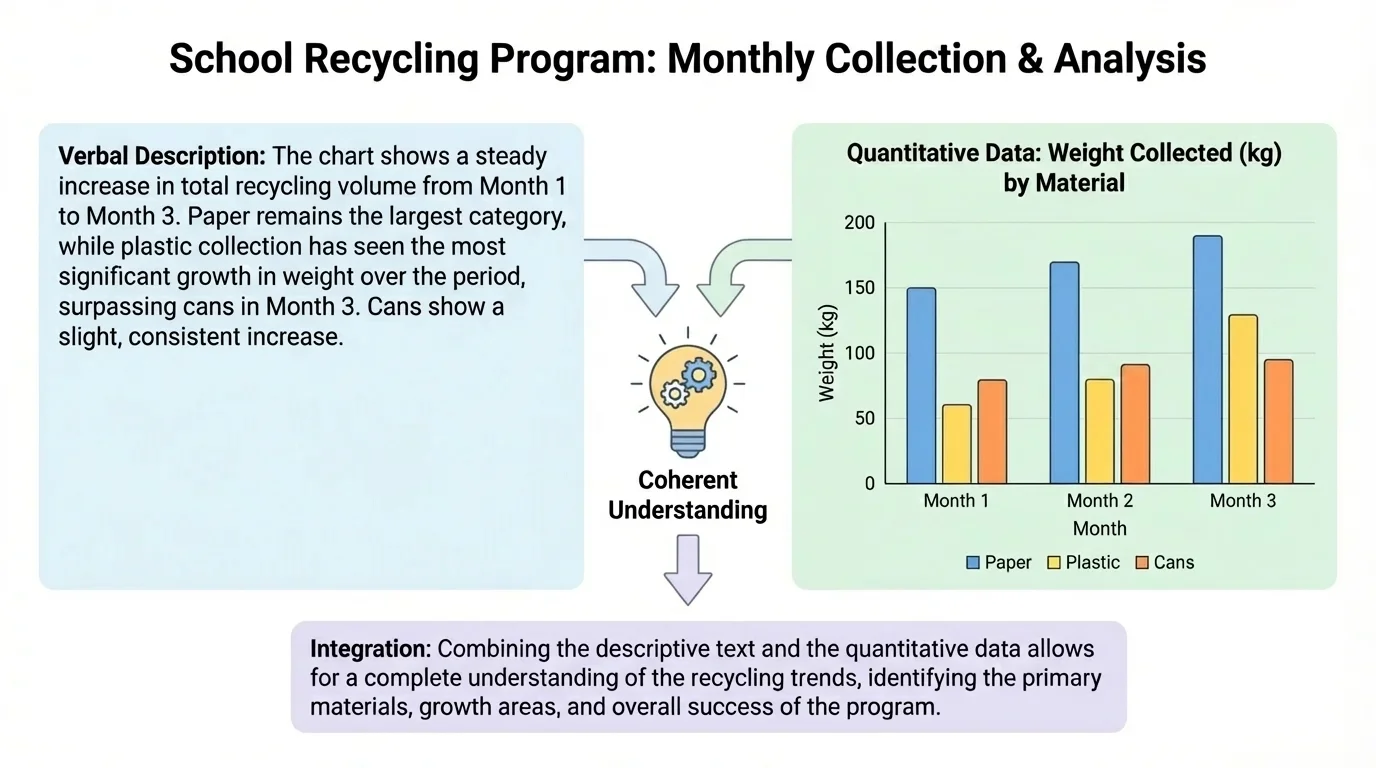
[Figure 3] shows how real life constantly asks you to combine formats. In a school recycling campaign, words and numbers often work together in a poster that includes both a short explanation and a bar chart. The paragraph might explain why recycling reduces waste, while the chart compares how much paper, plastic, and metal students collected over several months.
If the chart shows paper collection rising each month while plastic stays almost the same, you can conclude that students improved most in recycling paper. If the written paragraph says, "Paper recycling increased the fastest," the chart helps confirm that claim.
Weather reports are another great example. A meteorologist may speak about an approaching storm while viewers watch a map, temperature numbers, and rainfall predictions. To understand the forecast, you must combine spoken words, moving images, and data.
Health information also works this way. A nutrition label lists numbers such as calories and grams of sugar. A short paragraph on a package may describe the food as "healthy" or "energy-boosting." A smart reader compares the written claim with the numbers before deciding whether the claim seems reasonable.
Later, when you think again about the recycling poster in [Figure 3], you can see how the written message motivates action while the chart provides proof of what students actually did.
One common mistake is reading only the paragraph and ignoring the visual. Another is staring at the graph without reading the surrounding text. Both approaches lead to incomplete understanding.
A second mistake is skipping labels, keys, and captions. These small features often carry major meaning. A map key, for example, tells what colors or symbols represent. Without the key, the map may be confusing or even misleading.
A third mistake is assuming a picture is just decoration. In informational text, visuals are often evidence. A diagram may explain structure. A graph may reveal a trend. A timeline may show sequence better than a paragraph can.
Another mistake is jumping to conclusions too quickly. If one month's data rises sharply, that does not always mean a long-term pattern. You need to check the full set of information.
In science, you may read about erosion, examine photographs of landforms, and study a chart of rainfall. In social studies, you may read a passage about migration, look at a map, and analyze a timeline. In language arts, you may compare an article with an infographic. In every case, the goal is the same: use all the available information to understand the topic more accurately.
This skill also helps you become a more careful citizen. News stories, websites, and advertisements often combine images, words, and numbers. If you can integrate information well, you are less likely to be fooled by a flashy image or a claim that is not supported by data.
"The more ways you examine information, the clearer the truth becomes."
Strong readers do more than gather facts. They connect formats, test claims, notice evidence, and form conclusions that make sense across the whole text. That is what it means to develop a coherent understanding of a topic or issue.