Have you ever noticed that big mountain areas are often long and connected, while rivers usually twist and branch like tree roots? Earth's surface is full of patterns. Maps help us see those patterns from above, almost like looking at the planet through a giant window. When scientists and students study maps, they do not just name places. They analyze information to figure out where features are, how they connect, and what those patterns tell us about the land and water.
Map data is the information a map gives us. That information can include colors, symbols, labels, lines, and scales. By reading these clues carefully, we can describe Earth's features in a smart and evidence-based way. For example, if a map shows many blue lines coming down from a brown area, we can infer that streams are flowing from higher land into lower land.
Earth's physical features are not spread out randomly. Landforms and bodies of water often appear in patterns. Mountains may form long ranges. Rivers may flow from higher places to lower places. Plains may stretch over wide, flatter areas. Coastlines can curve and create bays, peninsulas, and islands. Learning to read these patterns helps us understand how Earth's surface works and how people use the land.
A map is more than a picture. It is a tool for showing where things are and how places relate to one another. When we analyze a map, we ask questions like these: Where are the high places? Where is the water? Which features are close together? Which features stretch across a region? These questions help us turn map details into useful ideas.
Interpreting a map means explaining what the information shows. If a map has a chain of mountains near a coast, we can describe that as a pattern: high land runs along the edge of the land near the ocean. If a river begins in hills and flows across a plain, we can say the map shows water moving from higher elevation to lower elevation. Good interpretation always uses what the map actually shows, not random guesses.
Pattern is something that repeats or appears in an organized way. In maps, a pattern can be a line of mountains, a branching river system, or many towns located near water.
Interpret means to explain what information shows. When you interpret map data, you use clues from the map to make sense of Earth's features.
Maps can also help us compare places. One region may have many rivers and lakes, while another region may have dry land and few water sources. One area may have broad plains, while another has steep mountains. These differences matter because Earth's features affect weather, plants, animals, and human activities.
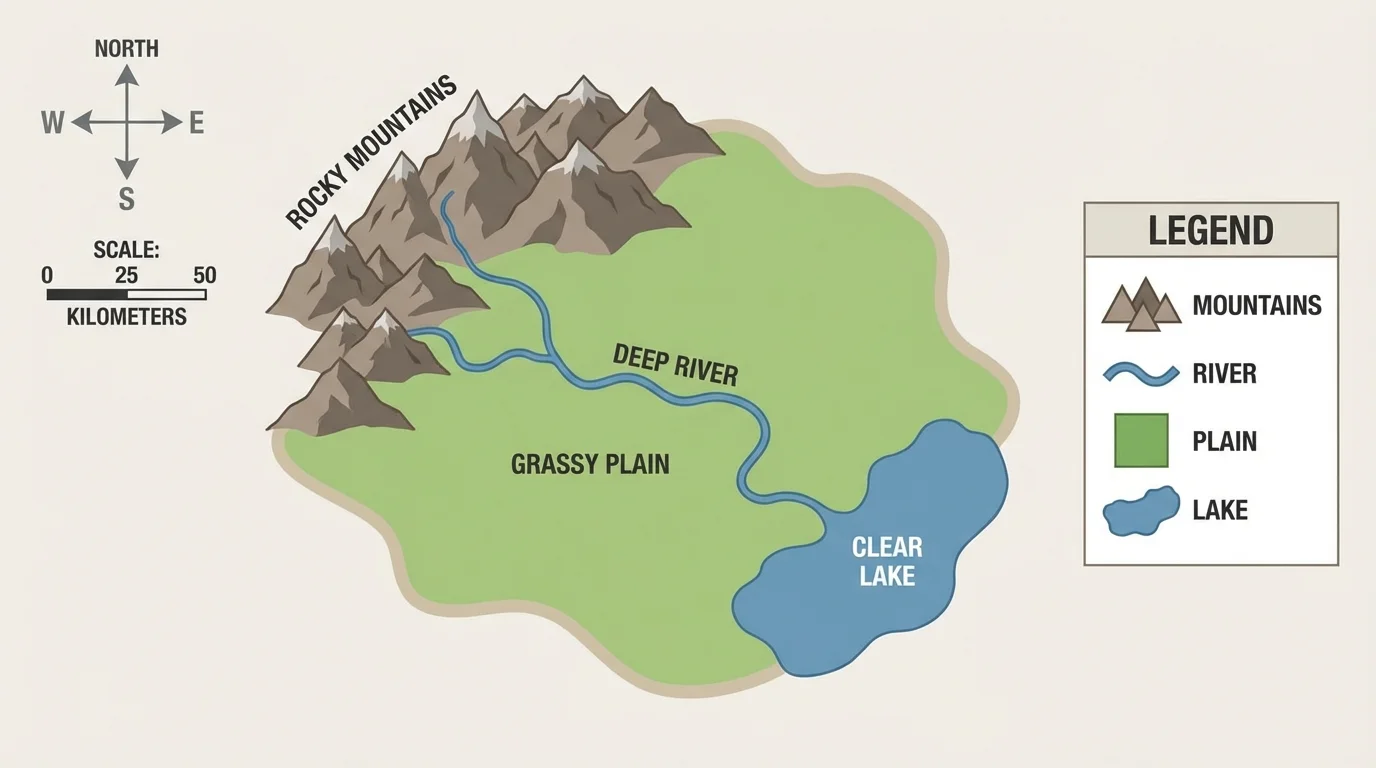
To understand map information, we need to know the tools a map provides. These tools act like a guide. A map's title tells what the map is about, and the legend or key explains what colors and symbols mean, as shown in [Figure 1]. Without these tools, it would be hard to know whether a blue area is a lake, a river, or the ocean.
A legend, also called a key, explains the symbols on the map. A compass rose shows direction, such as north, south, east, and west. A scale helps us understand distance. For example, a scale might show that every small section on the map stands for many real miles or kilometers on Earth.
Colors are important too. Physical maps often use blue for water and green, yellow, or brown for land. Usually, greener colors show lower land, while yellow and brown show higher land. Symbols may mark cities, roads, forests, or peaks. Labels tell the names of features, such as rivers, lakes, mountains, or oceans.
If you misread the legend or forget to check the scale, your interpretation might be wrong. For example, two rivers may look short on a small map, but the scale might reveal that each one is actually very long. A careful map reader always checks the map tools first.
You already know that maps show location. Now the goal is to go farther: use map evidence to explain why features seem grouped, connected, or spread out in certain ways.
As we continue, keep in mind that every color, line, and symbol has meaning. Reading a map well is a little like reading a mystery with clues hidden in plain sight.
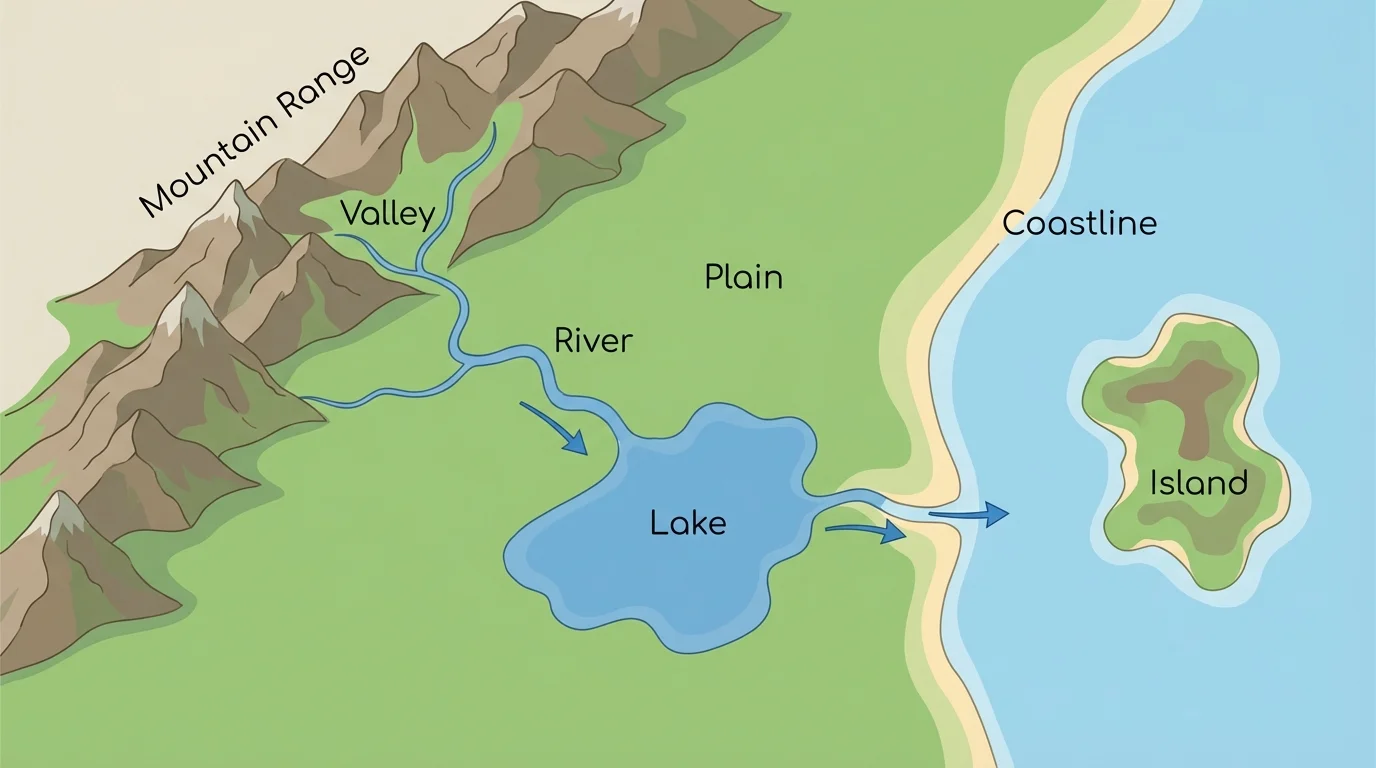
Many maps show Earth's surface features in ways that help us recognize patterns, as shown in [Figure 2]. Common land features include mountains, hills, plains, plateaus, and valleys. Water features include rivers, lakes, oceans, gulfs, bays, and islands. Each of these features has a shape and location that can be studied on a map.
Mountains are high areas of land. On a map, they may appear as brown or dark shaded areas, often in long connected bands. Plains are large, mostly flat areas, and they often cover wide spaces. Valleys are lower areas between hills or mountains. Rivers often run through valleys because water flows downhill.
Coastlines mark where land meets the ocean or sea. Some coastlines are smooth, while others are jagged and curved. A map may also show islands, which are pieces of land surrounded by water, and peninsulas, which are surrounded by water on most sides but connected to the mainland. These features help create recognizable shapes and patterns on maps.
When we describe these features, we should use position words such as north of, south of, near, along, across, between, and beside. For example, a student might say, "The mountains are west of the plain," or "The river flows from the hills through the valley to the coast." That kind of description uses map evidence clearly.
Features also connect with one another. A river may start in mountains, pass through valleys, and then cross a plain. A city may be located near a river and on flatter land. Later, when we compare more maps, we will see that these connections often help explain where people live and work.
A pattern is easier to notice when we ask the right questions. Is a feature found in one small place, or does it stretch across a region? Do similar features appear close together? Does one feature seem to lead into another? These questions help turn simple map reading into real analysis.
For example, mountain ranges often form long lines instead of single isolated peaks. Rivers often branch with smaller streams joining a larger river. Lakes may collect in lower places. Dry regions may have fewer rivers than wetter regions. All of these are map patterns that students can observe and describe.
Scientists often look for repeated shapes and arrangements. If several rivers begin in a high area and flow outward, that tells us the land is sloping away from that area. If many towns appear along a coastline or near rivers, that suggests water is important for transportation, farming, or daily life. A pattern does not just tell us what is there. It also helps us think about why it is there.
Patterns help us explain Earth's surface. When many features appear in an organized way, we can use that arrangement as evidence. A chain of mountains, a fan of streams, or a line of towns near water all suggest relationships between the land, the water, and living things.
Sometimes the most important word in science is because. We do not just say, "There are rivers here." We say, "There are many rivers here because the map shows higher land nearby and water flows downhill." Good interpretation connects observations to reasons.
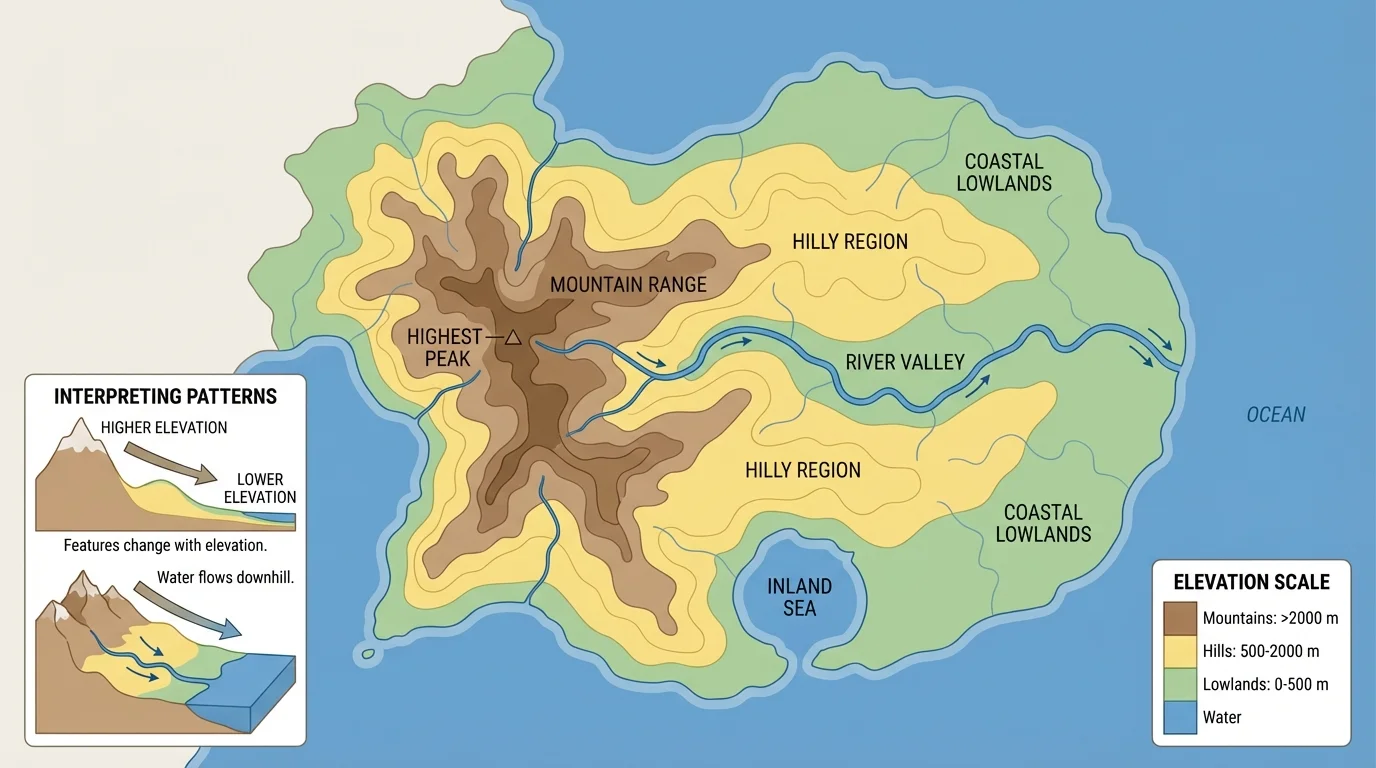
Some maps help us understand elevation, which means the height of land compared with sea level. On many physical maps, color shading reveals patterns of high and low land, as shown in [Figure 3]. Green often shows lower land, yellow may show somewhat higher land, and brown often marks mountains or other high places.
When students look at an elevation map, they can quickly notice where the land rises and falls. Large green spaces may show broad lowlands or plains. Brown bands may show mountain ranges. If rivers begin in brown areas and run into green areas, that pattern suggests water is moving from higher land into lower land.
Maps with elevation information are useful because they show shape and height without requiring us to stand in the place itself. Even from a paper map or digital screen, we can tell which places are likely steep, which are flatter, and where water may collect. Later, when we think about farming, roads, or settlements, elevation becomes very important.
A landform map can also help explain why some areas have winding roads or fewer towns. Very steep or high land may be harder to build on than a broad plain. That means map patterns are not only about nature. They also connect to human choices.
Some of the flattest places on Earth are excellent for farming because machines can move more easily across the land. In contrast, steep mountain land often has fewer large farms and roads.
As we saw in [Figure 3], colors on an elevation map let us compare regions quickly. A student does not need to memorize every place name to notice that one region has connected highlands while another is mostly low and flat.
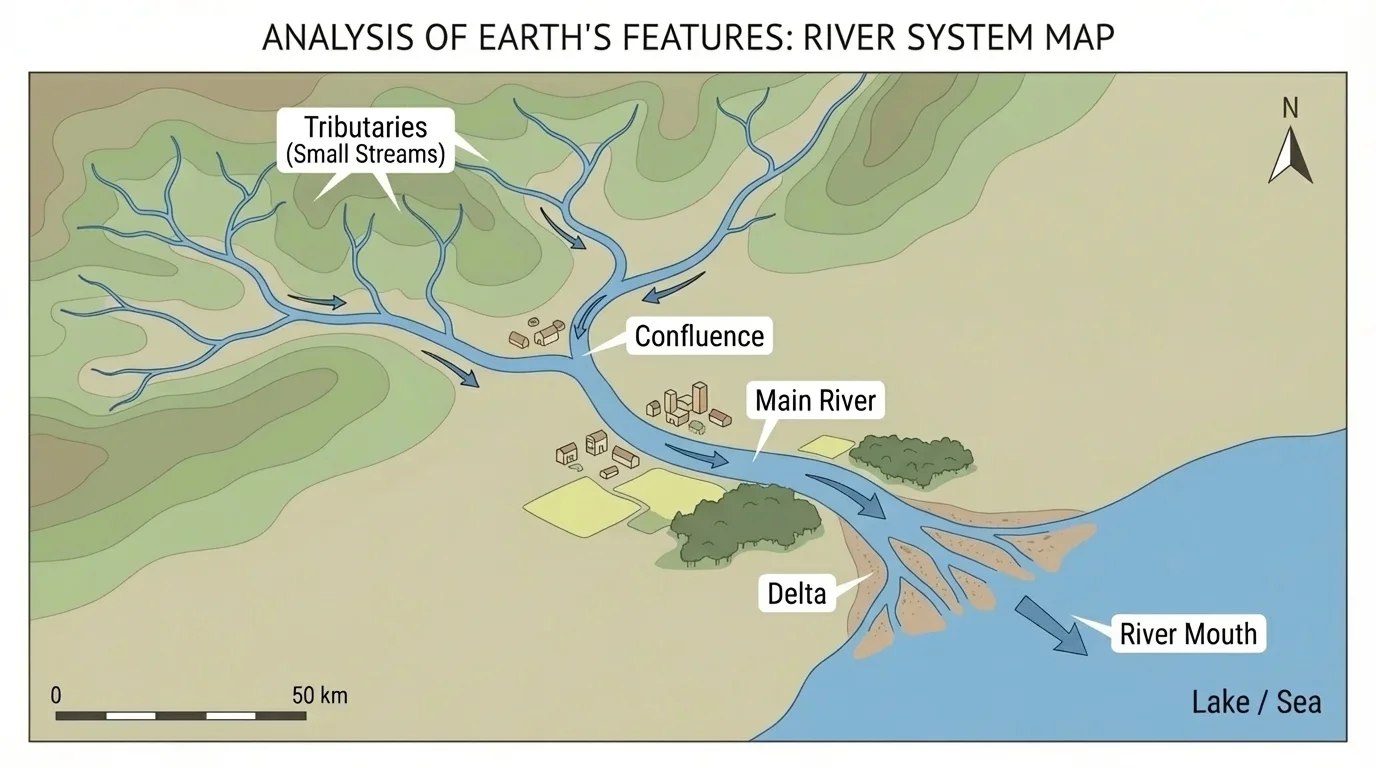
Water features often create some of the clearest map patterns. Rivers usually form connected systems with smaller streams joining larger ones, as seen in [Figure 4]. This branching pattern is one strong clue that water is moving across land toward a larger body of water.
A river system may begin with tiny streams in higher areas. These streams join to form larger rivers, which may flow into a lake, gulf, sea, or ocean. Lakes often appear in lower places where water collects. Wet regions may show many rivers and lakes, while drier regions may show fewer surface-water features.
Maps can also show watershed patterns in a simple way. A watershed is an area of land where water drains to the same river, lake, or other body of water. Even if a map does not use the word watershed, a branching river network can help you infer that water from many smaller places is flowing into one larger system.
Water shapes land over time. Flowing water can wear away rock and soil, carry sediment, and help form valleys and floodplains. You do not need to see this happening moment by moment. A map already records the results in the shapes of rivers, valleys, and lowlands.
Farther into the lesson, the river network in [Figure 4] also helps explain why settlements often appear near water. Rivers provide freshwater, routes for travel, and useful land nearby.
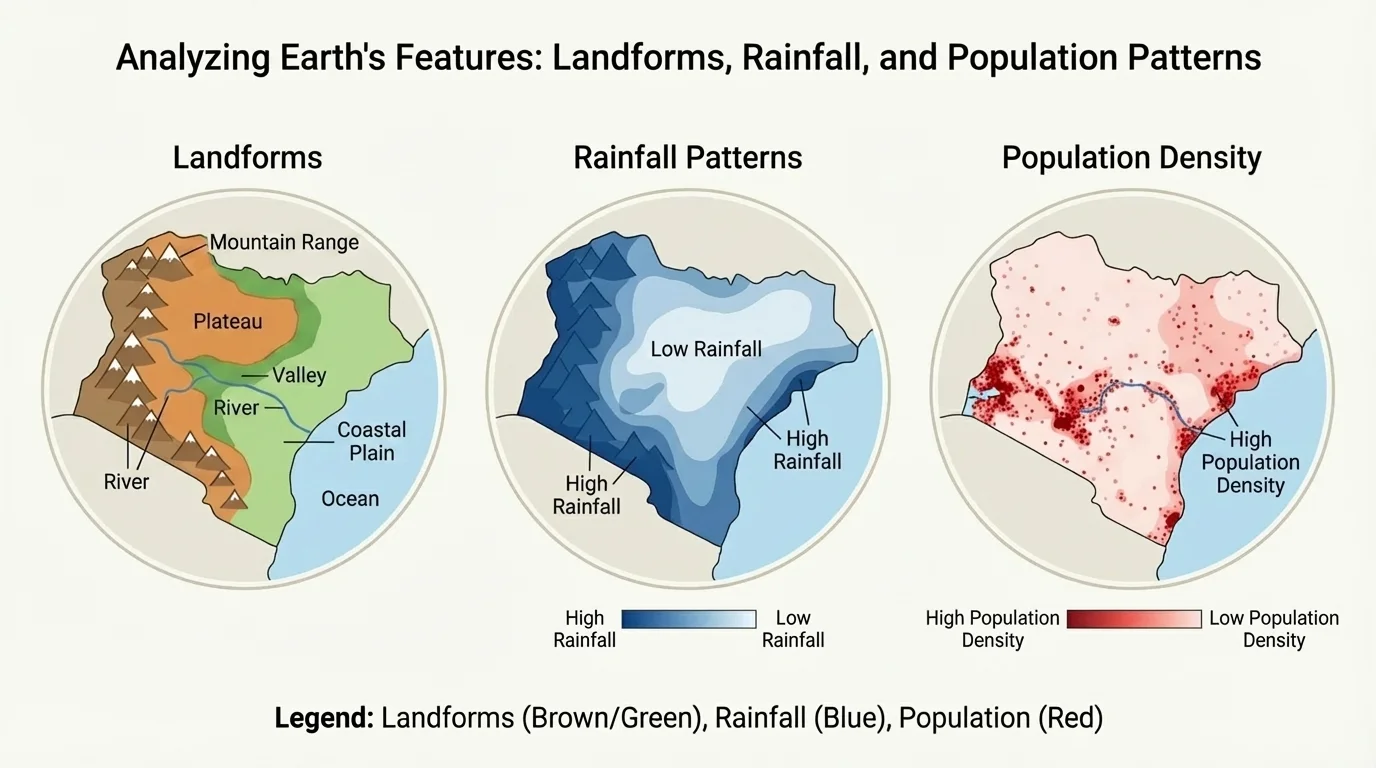
One of the best ways to analyze Earth's features is to compare more than one map of the same place. A physical map may show mountains and rivers. A rainfall map may show wet and dry areas. A vegetation map may show forests, grasslands, or deserts. A population map may show where many people live. Each map adds another clue.
When these maps are compared, relationships become easier to notice. For the same region, [Figure 5] shows that flatter land may match areas with more roads and towns, while high mountains may have fewer settlements. Areas with more rainfall may have more rivers and more plant growth than dry areas.
Suppose one map shows a wide plain with a river running through it. Another map shows rich plant growth there. A third map shows many farms and towns. Putting these maps together, a student can interpret that the plain has water, soil, and space that support farming and communities.
Comparing maps also helps prevent mistakes. If a place has many blue lines on a climate map, those lines might mean rainfall amounts rather than rivers. The legend tells us what each color or line means. That is why scientists rely on several sources of map data, not just one glance.
| Map Type | What It Shows | How It Helps |
|---|---|---|
| Physical map | Landforms and water features | Shows mountains, plains, rivers, lakes, and coastlines |
| Elevation map | High and low land | Shows patterns of slopes, mountains, and lowlands |
| Rainfall map | Wet and dry regions | Helps explain river patterns and plant growth |
| Population map | Where many people live | Helps connect human settlement to Earth features |
Table 1. Different map types and the kinds of information they provide.
Later, when you study more advanced science, you will compare even more kinds of data. For now, the key skill is to notice that one map answers part of a question, and several maps together answer it better.
Case study: Interpreting one region with several maps
Step 1: Observe the physical map.
The region has mountains in the north, a river flowing south, and a large plain in the middle.
Step 2: Observe the rainfall map.
The northern mountains and central plain receive more rain than the far western side.
Step 3: Observe the population map.
Most towns are on the plain and along the river, with fewer towns in the mountains.
Step 4: Interpret the pattern.
The maps together suggest that people settle near flatter land and water sources, while steep mountain land has fewer settlements.
This kind of comparison uses evidence from maps instead of guessing. It also shows how natural patterns on Earth can influence human activities.
People do not live on Earth's surface in exactly the same way everywhere. They respond to the land and water around them. Flat plains may be used for farming, building, and transportation. River valleys may support towns because of freshwater and fertile soil. Coastlines may have ports, fishing areas, and cities.
Mountains can make travel harder, so roads may curve around them or pass through lower gaps. Dry regions may have fewer farms unless irrigation brings in water. Forested regions may have different jobs and land use than grassland regions. By studying maps, we can connect these human choices to the physical features of the land.
As we saw when comparing maps in [Figure 5], places with water and flatter land often support larger populations. This does not mean every flat place is crowded or every mountain place is empty, but patterns on maps help us notice common relationships.
Human activities and Earth's features interact. Earth's surface can make some activities easier or harder. In turn, people change the land by building roads, farms, dams, and cities. Maps help us study both the natural surface and the ways humans use it.
Scientists, planners, and communities use maps in real life. Farmers study land and water maps. City planners look at roads, rivers, and flood-prone areas. Emergency workers use maps to understand where people live and what physical features may affect travel or safety. Map skills are useful far beyond the classroom.
Good scientists make claims that match the evidence. If a map shows a desert area with very few rivers, it is reasonable to say the region appears dry. But it would not be careful to say that no living things can survive there unless another source of data shows that. Maps are powerful, but they must be read accurately.
One helpful habit is to use sentence starters such as "The map shows...," "The pattern suggests...," and "This may be because...." These phrases remind us to base our ideas on evidence. For example: "The map shows mountains along the eastern side of the region. The pattern suggests that high land is concentrated there."
Another helpful habit is to compare several clues at once. Check the legend, direction, scale, labels, and color patterns. Look for connections among landforms, water, and places where people live. Then explain your thinking clearly. That is what analyzing and interpreting map data really means.
By reading maps carefully, students can discover that Earth's surface has order. Mountains, rivers, plains, and coastlines are arranged in ways that can be observed, described, and explained. Maps turn those patterns into information we can study.