If Earth were the size of a small peppercorn, the Sun would still be much larger, and the distance between them would be so great that most drawings in textbooks would not fit on a single page. Space has unusual properties in that way: objects can be huge, but the empty gaps between them are even more enormous. To understand the solar system, scientists do not just memorize numbers. They analyze data, compare measurements, and build models that make those measurements meaningful.
When scientists study the solar system, they often ask two related questions: How big is an object? and How far away is it from another object? These questions are about scale. In space science, scale helps us describe the size of planets, moons, asteroids, and the Sun, and it also helps us describe the vast distances between them.
A major challenge is that the solar system is too large to view all at once with our eyes. A picture may show the Sun and planets close together so they fit on a page, but that picture is not showing true distances. Another picture may spread objects far apart to show distance better, but then the planets become too tiny to see. Understanding this problem is the first step in interpreting solar system data correctly.
Measurements can be compared in more than one way. You can compare by subtraction to find how much larger one value is, or by division to find how many times larger it is. In scale work, division is often more useful because it shows relative size.
In everyday life, people use scale all the time. A road map shrinks long distances so they fit on paper. A toy car model keeps the shape of a real car but reduces its size. The solar system can also be represented with models, but because distances are so extreme, these models require careful choices.
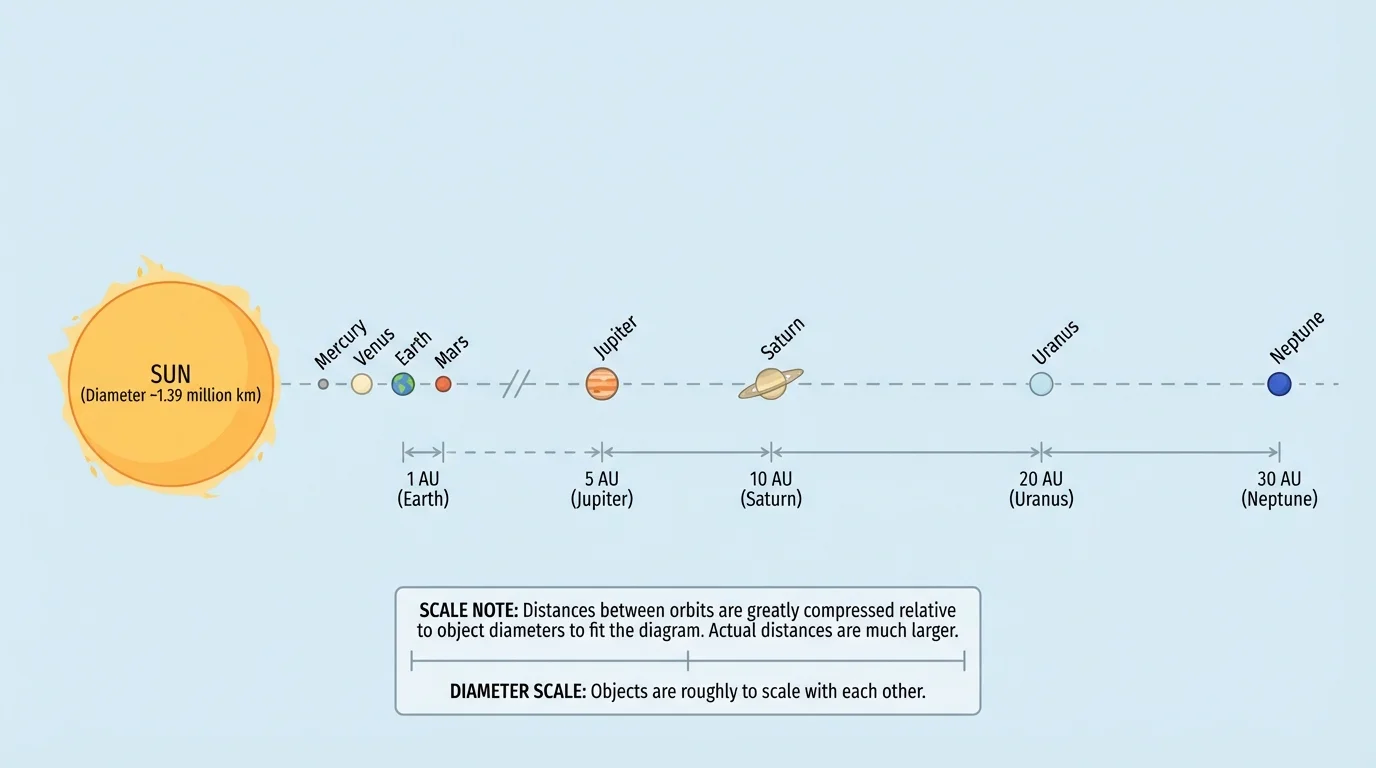
In solar system studies, scale includes both the sizes of objects and the distances between them, as [Figure 1] shows through a simplified line model. A planet's diameter is the distance across it through the center. The distance from a planet to the Sun is usually much greater than the planet's own diameter.
A scale model is a model in which measurements are reduced or enlarged by the same factor. If every real distance is divided by the same number, the model keeps the correct relationships. The same is true for size. But a single model often cannot show both accurate sizes and accurate distances in a convenient way.
Suppose Earth has a diameter of about 12,700 kilometers and Neptune has a diameter of about 49,500 kilometers. We can compare them with a ratio. If we divide the larger by the smaller, we get about \(\dfrac{49{,}500}{12{,}700} \approx 3.9\). That means Neptune is about \(3.9\) times Earth's diameter.
Now compare a planet's diameter with its distance from the Sun. If a planet is about 150,000,000 kilometers from the Sun and its diameter is about 12,700 kilometers, then the distance is about \(\dfrac{150{,}000{,}000}{12{,}700} \approx 11{,}800\) times the planet's diameter. That enormous ratio helps explain why planets that look close to the Sun in textbook drawings are actually very far away.
Scale is the relationship between a real measurement and a model measurement.
Diameter is the distance across an object through its center.
Ratio compares two quantities by division.
Relative size describes how large one object is compared with another, rather than giving exact measurements only.
When scientists interpret scale, they focus on patterns and relationships. They are not just collecting facts about which planet is big or small. They are asking what the numbers reveal about how the solar system is arranged.
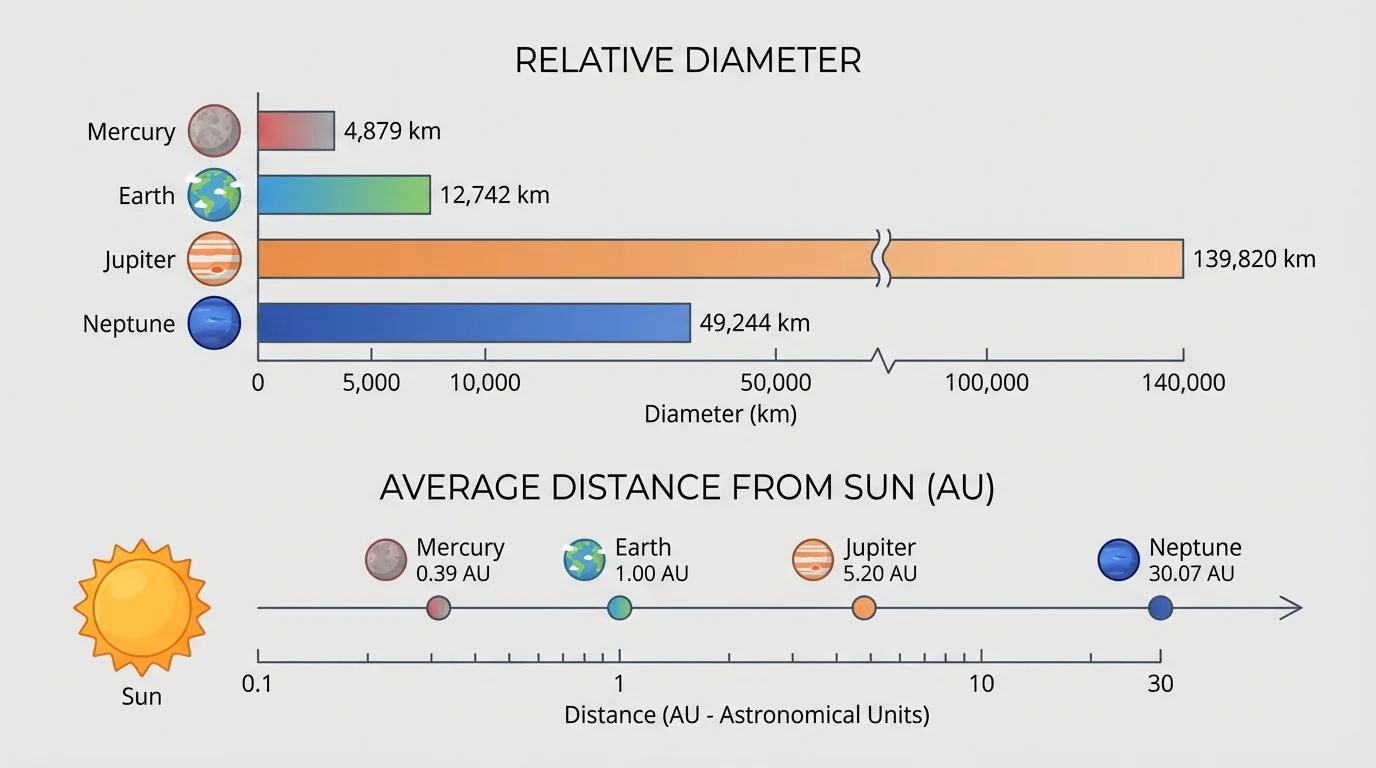
Data become much more useful when organized clearly. In a table, students can search for patterns in size and spacing, and [Figure 2] illustrates how a visual comparison can make those patterns easier to notice. A good question is not only "Which object is largest?" but also "How much larger is it?" and "How does object size compare with the distance between objects?"
Look at the sample data below. The specific values are less important than the relationships they reveal.
| Object | Approximate diameter | Approximate average distance from the Sun |
|---|---|---|
| Mercury | \(4{,}900 \textrm{ km}\) | \(58{,}000{,}000 \textrm{ km}\) |
| Earth | \(12{,}700 \textrm{ km}\) | \(150{,}000{,}000 \textrm{ km}\) |
| Jupiter | \(143{,}000 \textrm{ km}\) | \(778{,}000{,}000 \textrm{ km}\) |
| Neptune | \(49{,}500 \textrm{ km}\) | \(4{,}500{,}000{,}000 \textrm{ km}\) |
Table 1. Approximate diameters and average distances from the Sun for selected planets.
From these data, one clear pattern appears: distances increase dramatically. Another pattern is that larger diameter does not always mean greater distance from the Sun in a simple step-by-step way. The solar system is not arranged like a neat ladder where each object gets a little bigger and a little farther. Instead, the data show a wide variety of sizes and very large spaces.
Students can also compare one value to another using subtraction. For example, Jupiter's diameter is about \(143{,}000 - 12{,}700 = 130{,}300\) kilometers greater than Earth's diameter. But ratio often tells more. Jupiter's diameter compared with Earth's is \(\dfrac{143{,}000}{12{,}700} \approx 11.3\), so Jupiter is a little more than \(11\) times Earth's diameter.
That kind of comparison is powerful because it helps us think relatively. On a drawing where Earth is shown as a small dot, Jupiter would need to be more than eleven times wider. Yet even that larger size is still tiny compared with the distances separating planets, a point that becomes clearer when we return to [Figure 1].
A model that fits on a classroom wall can make the planets look close together even when the real solar system has huge regions of mostly empty space between them.
A ratio helps answer questions like "How many times larger?" or "How many times farther?" This is one of the most useful tools for analyzing scale properties.
Suppose we compare Earth and Mercury using the data in Table 1. Earth's diameter is about \(12{,}700 \textrm{ km}\), and Mercury's diameter is about \(4{,}900 \textrm{ km}\). The ratio is \(\dfrac{12{,}700}{4{,}900} \approx 2.6\). Earth is about \(2.6\) times Mercury's diameter.
Now compare Neptune's average distance from the Sun with Earth's. The ratio is \(\dfrac{4{,}500{,}000{,}000}{150{,}000{,}000} = 30\). Neptune is about \(30\) times farther from the Sun than Earth is. That is a much larger difference than the diameter ratio between many planets.
Worked example: comparing diameters
Use the table to compare Jupiter's diameter with Neptune's diameter.
Step 1: Write the values.
Jupiter: \(143{,}000 \textrm{ km}\)
Neptune: \(49{,}500 \textrm{ km}\)
Step 2: Form a ratio.
\(\dfrac{143{,}000}{49{,}500} \approx 2.89\)
Step 3: Interpret the result.
Jupiter's diameter is about \(2.9\) times Neptune's diameter.
This tells us more than just saying Jupiter is bigger. It tells us how much bigger.
Ratios can also compare distance to size for the same object. For Earth, the distance to the Sun divided by Earth's diameter is about \(\dfrac{150{,}000{,}000}{12{,}700} \approx 11{,}800\). This means if Earth were reduced to a tiny model, the model distance to the Sun would still have to be many thousands of Earth-diameters long. That is one reason accurate solar system models are difficult to fit indoors.
Interpreting a ratio means turning a number into meaning. A ratio of \(2\) suggests a modest difference. A ratio of \(30\) or \(11{,}800\) points to a much more dramatic difference. In solar system data, the biggest surprise is often not object size but the incredible scale of the empty space between objects.
Scientists and teachers often choose a scale for a model so real distances become manageable, and [Figure 3] presents this idea as a school-field layout. A scale might say that \(1 \textrm{ centimeter}\) in the model represents \(10{,}000 \textrm{ kilometers}\) in reality, or that \(1 \textrm{ meter}\) represents \(100{,}000{,}000 \textrm{ kilometers}\). The choice depends on what the model needs to show.
Suppose we choose the scale \(1 \textrm{ cm} = 10{,}000{,}000 \textrm{ km}\). Earth's average distance from the Sun is about \(150{,}000{,}000 \textrm{ km}\). On the model, that becomes \(\dfrac{150{,}000{,}000}{10{,}000{,}000} = 15\) centimeters. Mercury's average distance of \(58{,}000{,}000 \textrm{ km}\) becomes \(5.8\) centimeters.
Worked example: converting a real distance to a model distance
Use the scale \(1 \textrm{ cm} = 10{,}000{,}000 \textrm{ km}\). Find Neptune's model distance from the Sun.
Step 1: Write the real distance.
Neptune is about \(4{,}500{,}000{,}000 \textrm{ km}\) from the Sun.
Step 2: Divide by the scale factor.
\(\dfrac{4{,}500{,}000{,}000}{10{,}000{,}000} = 450\)
Step 3: State the model measurement.
Neptune would be \(450 \textrm{ cm}\) from the Sun.
Since \(450 \textrm{ cm} = 4.5 \textrm{ m}\), Neptune would be \(4.5\) meters away on the model.
This result is striking. Earth is only \(15\) centimeters from the model Sun, while Neptune is \(4.5\) meters away. The outer solar system spreads out quickly. A model that fits inner planets on a desk may require a hallway or field for the outer planets.
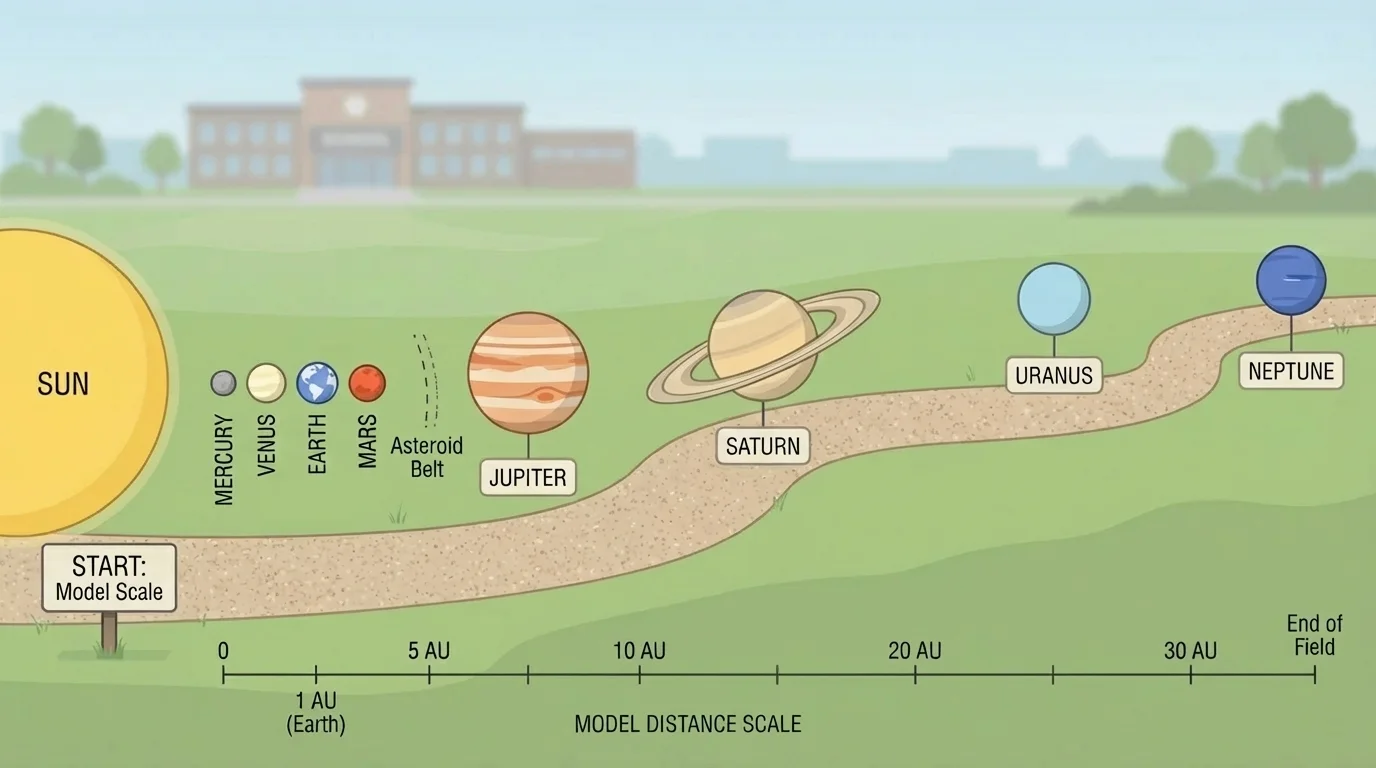
Size can be scaled too. If Earth's diameter of \(12{,}700 \textrm{ km}\) uses the same scale, the model diameter becomes \(\dfrac{12{,}700}{10{,}000{,}000} \textrm{ cm} = 0.00127 \textrm{ cm}\). That is tiny—far too small to see easily. This is why models that show distances accurately often cannot show planet sizes clearly.
The field model in [Figure 3] makes that problem obvious: the markers for planetary positions can be placed, but the planets themselves would need to be almost microscopic at the same scale.
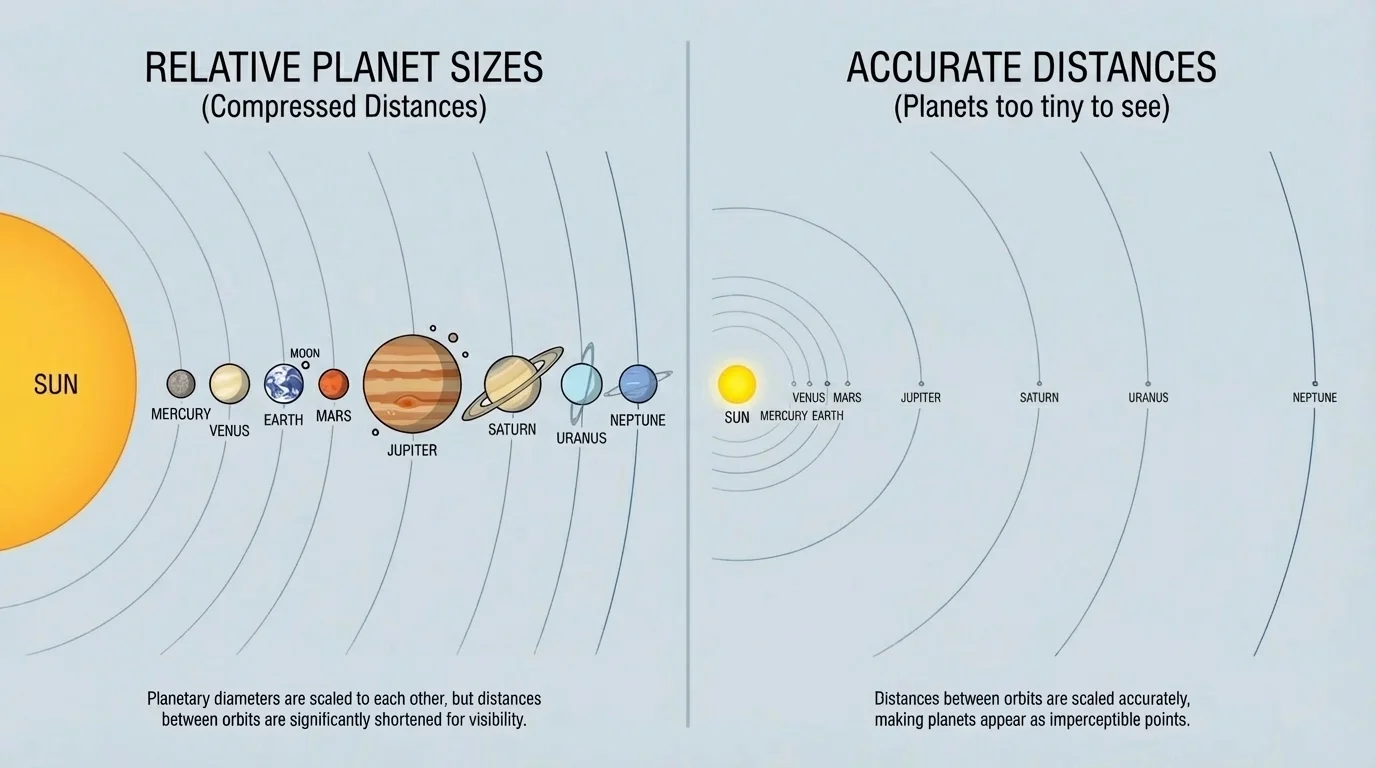
One of the most important ideas in solar system science is that a model can be useful even when it is not perfect, and [Figure 4] makes this tradeoff visible by comparing size-emphasizing and distance-focused models. A model is built for a purpose. If the goal is to show relative sizes, distances may be compressed. If the goal is to show spacing, object sizes may be enlarged so students can still see them.
This is not a mistake. It is a scientific choice. Interpreting data means asking what the model represents accurately and what it simplifies. Scientists do this all the time with graphs, maps, and computer simulations.
Scale models also help explain why solar system events happen the way they do. Eclipses, lunar phases, and seasons depend on the positions, motions, and orientations of objects in space. A model with correct relative positions can help predict when one object lines up with another or why sunlight reaches different places differently at different times.
For example, if students think the Moon is very close to Earth because of a textbook picture, they may misunderstand how sunlight and shadows create phases and eclipses. A better sense of scale helps them see that these events depend on geometry across space, not just on objects touching or sitting side by side.
Why distance matters more than it first appears
In the solar system, size alone does not tell the whole story. A very large object can still be separated from another object by an even more enormous distance. This is why scientists often analyze both diameter data and distance data together. The arrangement of the solar system depends on both.
The contrast shown in [Figure 4] also teaches an important habit of mind: whenever you see a solar system picture, ask whether it is mainly showing size, distance, or motion. That question turns a simple image into scientific evidence you can interpret.
Every model leaves something out. A line model may show distance well but not orbital paths. A drawing of circular disks may show size but not three-dimensional spacing. A computer animation may show motion over time but use exaggerated sizes so objects remain visible.
This does not make models useless. In fact, it makes them more powerful when used carefully. Scientists compare models with data and decide which model is most helpful for the question they are trying to answer. That is part of science and engineering practice: choosing tools that fit the problem.
When interpreting solar system data, it is also important to notice that measurements are often approximate. Distances can change because planets move in orbits. That means a table may list average distance rather than a single fixed value. The goal is to identify patterns and relationships, not to treat every number as exact forever.
Worked example: deciding what a model shows best
A poster shows the planets with large, easy-to-see circles, but all the planets are placed almost the same distance apart. What should you conclude?
Step 1: Identify what looks emphasized.
The circles are large and clear, so the model is probably emphasizing visible object size.
Step 2: Check the spacing.
If the planets are almost evenly spaced, the model is not showing true distances well.
Step 3: Interpret the model.
The poster is useful for comparing appearance or relative size, but not for understanding actual spacing in the solar system.
Good scientific thinking includes recognizing both the strengths and the limits of a model.
Scale analysis is not just for classrooms. Science museums build walk-through solar system models so visitors can physically experience spacing. Engineers planning spacecraft missions must work with distances so large that travel time becomes a major issue. Astronomers create graphs and computer models to communicate data clearly without misleading viewers.
There is also an engineering side to this topic. When someone designs a model for a museum, school, or planetarium, they must decide what the audience needs to understand most clearly. Should the model emphasize relative size? Distance? Motion? Brightness? These are design decisions based on evidence and purpose.
Data interpretation also helps people avoid misconceptions. For example, students may think the planets are packed close together because they have seen small textbook diagrams. But once they calculate scaled distances, they realize the solar system contains vast regions of space. That insight changes how they think about travel, gravity, and the movements that produce eclipses, phases, and seasons.
Some large outdoor solar system models place the Sun in one location and the farthest planet several kilometers away, so visitors must walk or bike between stations to experience the spacing.
Understanding scale also strengthens graph reading, ratio reasoning, and model evaluation—skills used across science. Whether scientists study galaxies, atoms, weather systems, or the solar system, they often ask the same core question: what do the data reveal about size, spacing, and relationships?