A powerful earthquake can shake a city for less than a minute, but the data that help scientists understand it may come from decades or even centuries of records. That is one of the most surprising insights in Earth science: sudden disasters often leave long-term patterns. When scientists study those patterns carefully, they can forecast where danger is more likely and help communities prepare before the next event happens.
A natural hazard is a natural event that can threaten people, property, or ecosystems. A hazard becomes a disaster when it causes serious harm. For example, a strong earthquake in an unpopulated area may be a hazard, but not a disaster. The same earthquake beneath a crowded city can be catastrophic. This is why understanding both Earth processes and human settlement patterns matters so much.
Scientists do not just react after catastrophes. They gather evidence, compare data sets, map past events, measure changes over time, and estimate future risk. Engineers then use that information to design safer buildings, warning systems, evacuation plans, and other tools that reduce loss of life.
Earth produces many kinds of hazards. Some begin deep underground, while others develop in the atmosphere, oceans, rivers, or on steep slopes. Important examples include earthquakes, volcanic eruptions, tsunamis, hurricanes, floods, droughts, landslides, and wildfires. Even though these hazards seem very different, they all can be studied by collecting and interpreting data.
Some hazards are closely tied to the movement of Earth's crust. In this lesson, the term plate tectonics refers to the idea that Earth's outer shell is broken into large moving plates. Where plates collide, pull apart, or slide past one another, stress builds and can be released as earthquakes or volcanic activity. Other hazards, such as floods and hurricanes, are linked more strongly to water, heat, air pressure, and weather patterns.
Hazards can also trigger one another. An undersea earthquake can cause a tsunami. Heavy rain can weaken slopes and cause landslides. Drought can dry vegetation, making wildfires spread more easily. Because Earth's systems interact, scientists often study hazards as connected events rather than isolated ones.
Hazard means a possible source of harm from a natural process. Risk is the chance that people or places will be harmed. Mitigation means actions taken to reduce damage, such as stronger buildings, warning systems, or safe land-use choices.
Understanding these differences helps explain why the same storm or earthquake can have very different effects in different places. A coastal community with evacuation routes, seawalls, and warning sirens may face less danger than a similar community without those protections.
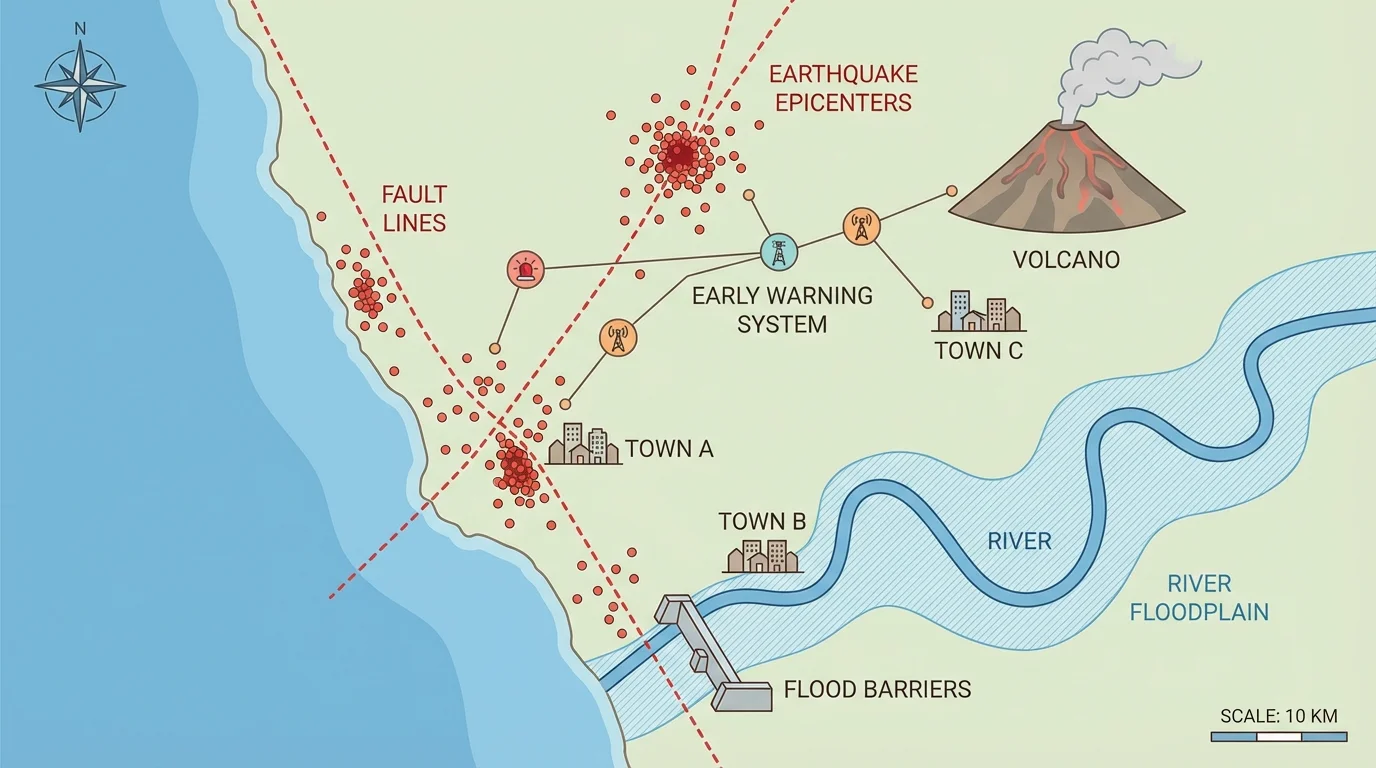
One of the best ways to understand future danger is to study past events. [Figure 1] Scientists create regional hazard histories by combining many sources of evidence. They may use old newspapers, satellite images, seismometer records, flood marks on buildings, tree-ring evidence, volcanic ash layers, river sediment, and oral histories passed down through communities.
When these data are placed on maps, patterns begin to appear. Earthquake epicenters may line up along faults. Flooding may happen again and again in low-lying areas near a river. Volcanic eruptions may cluster around a plate boundary. In this lesson, the term fault refers to a break in Earth's crust where rocks move. Mapping faults helps scientists identify places that may experience future earthquakes.
A map becomes even more useful when it includes time as well as location. If an area has had major floods in years with unusually high rainfall, scientists can compare those events with newer rainfall records. If a volcano has erupted several times over the last few hundred years, geologists can study how often it tends to erupt and what warning signs appeared before each eruption.
Regions also differ in the hazards they face. California has a long history of earthquakes because of active faults. Countries around the Pacific Ocean are part of the "Ring of Fire," where many earthquakes and volcanoes occur. Coastal areas near warm ocean water are more likely to face hurricanes. Mountain valleys may be vulnerable to landslides and flash floods. Looking back helps communities look ahead.
Hazard mapping is not only about nature. Population density, roads, hospitals, schools, dams, and power lines are added to maps too. As we saw in [Figure 1], a hazard map is most useful when it combines Earth science data with information about where people live and travel.
Many destructive hazards begin with powerful forces inside Earth. [Figure 2] A convergent plate boundary is one place where several hazards can happen together. At this kind of boundary, one plate may sink below another. That movement creates stress, heat, melting, and rising magma.
Rocks can suddenly break and move along a fault, releasing energy as seismic waves. This causes an earthquake. Scientists record earthquakes using instruments called seismometers. The place inside Earth where the rupture begins is the focus, and the point on Earth's surface above it is the epicenter. Shallow earthquakes often cause stronger shaking at the surface than deeper ones.
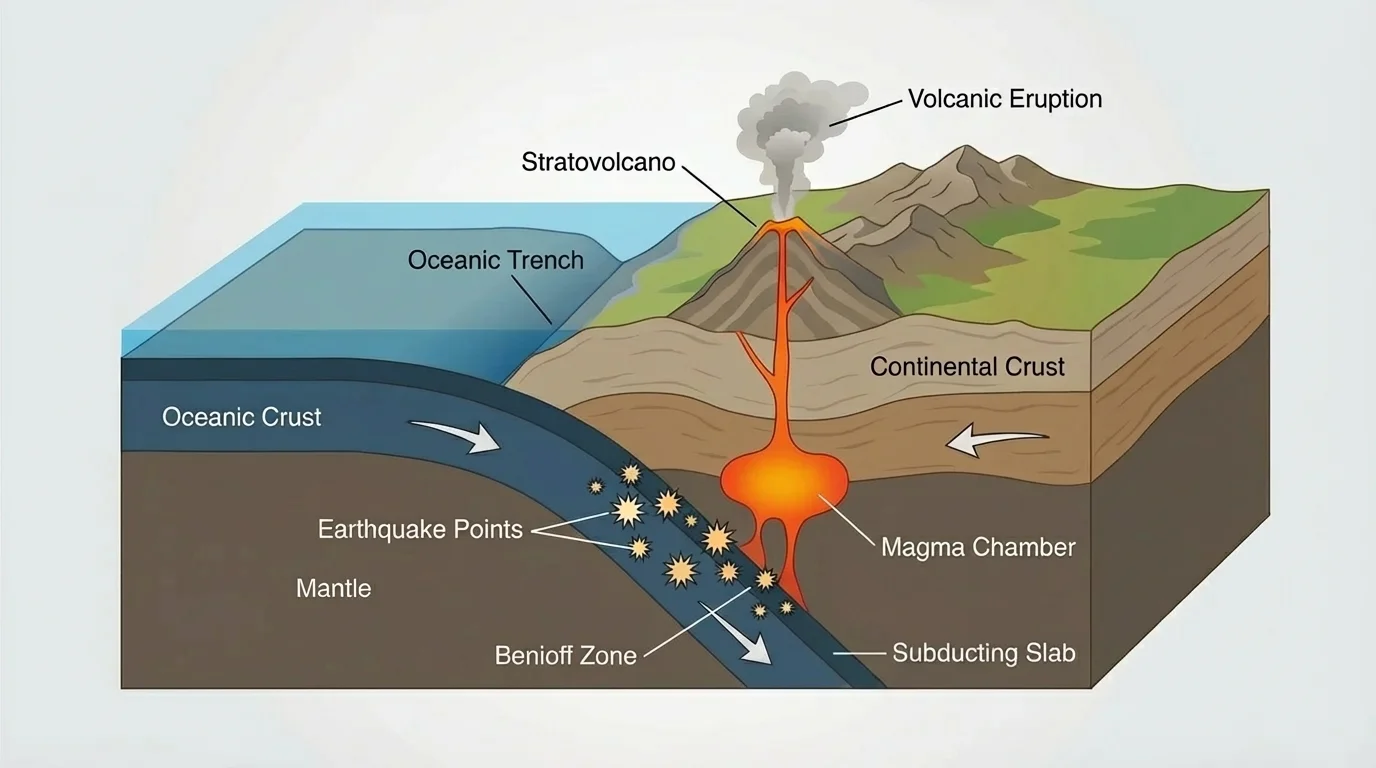
If melting rock rises and reaches the surface, a volcano may erupt. Some eruptions produce slow-moving lava, while others blast ash, gas, and rock fragments high into the air. Volcanoes can also create mudflows called lahars when ash mixes with water. These different eruption styles depend on the chemistry of the magma, the amount of gas, and how easily pressure can escape.
Not all hazards are driven by tectonic forces. Floods are strongly affected by rainfall, snowmelt, river shape, and land cover. Landslides happen when gravity pulls soil and rock downslope, often after heavy rain or earthquakes. Hurricanes form over warm ocean water when heat and moisture feed rotating storm systems. Even though the causes differ, the scientific approach is similar: collect evidence, find patterns, and estimate future risk.
Earth systems are connected. The geosphere, hydrosphere, atmosphere, and biosphere interact constantly. An earthquake in the geosphere can displace ocean water in the hydrosphere and produce a tsunami. Drought in the atmosphere can dry plants in the biosphere and increase wildfire risk. Scientists study these connections because one change can lead to several hazards.
This is why hazard forecasting cannot depend on one measurement alone. A slope may seem stable until rainfall saturates the soil. A volcano may look quiet until gas pressure, ground swelling, and small quakes all begin to increase together.
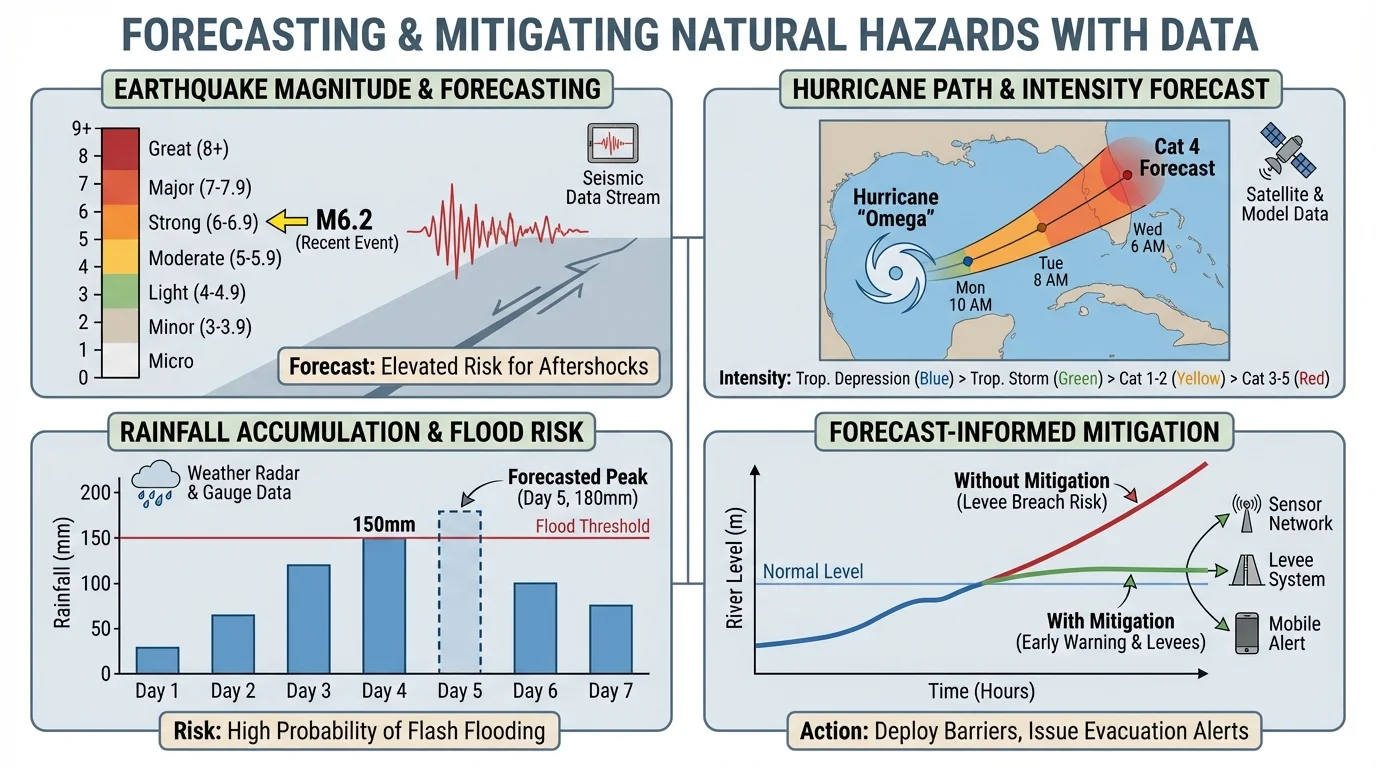
Different hazards require different types of data, and scientists choose measurements that best match the process they are studying, as [Figure 3] illustrates. For earthquakes, they may examine magnitude, depth, and the distribution of aftershocks. For floods, they may look at rainfall totals, river height, soil moisture, and snowpack. For hurricanes, they track wind speed, air pressure, water temperature, and storm path.
Here, the term magnitude refers to a number that describes the size or strength of an event, such as an earthquake. A larger magnitude usually means more energy released. Magnitude is not the only important measurement, though. A moderate earthquake close to a city can be more damaging than a stronger earthquake far away.
Scientists also examine frequency, which means how often something happens. If a river floods every few years, that pattern suggests a higher ongoing risk than a river that has flooded only once in recorded history. Frequency does not guarantee exactly when the next event will occur, but it helps estimate likelihood.
Data are often clearer when organized in tables and graphs.
| Hazard | Important Data | What the Data Help Forecast |
|---|---|---|
| Earthquake | Magnitude, depth, location, aftershocks | Areas likely to shake strongly and possible aftershock risk |
| Volcano | Ground swelling, gas release, small quakes, heat | Possible eruption timing and eruption style |
| Flood | Rainfall, river height, soil moisture, snowmelt | Where and when water may overflow |
| Hurricane | Wind speed, air pressure, ocean temperature, track | Storm path, landfall zone, and strength |
| Landslide | Slope angle, rainfall, rock type, vegetation cover | Which slopes are most unstable |
Table 1. Examples of major natural hazards, the data scientists monitor, and the forecasts those data support.
Sometimes scientists use formulas to make quick estimates. One useful relationship for speed is distance divided by time:
\[v = \frac{d}{t}\]
If a tsunami travels about 600 kilometers in 1 hour, its average speed is \[v = \frac{600 \textrm{ km}}{1 \textrm{ h}} = 600 \textrm{ km/h}\].
This estimate helps emergency managers decide how much warning time coastal communities may have after an undersea earthquake.
Another useful idea is change over time. If a river rises from 2 meters to 5 meters in 6 hours, the average rate of rise is \[\frac{5 - 2}{6} = \frac{3}{6} = 0.5 \textrm{ meters per hour}\].
If that trend continues, flooding may become more likely. In real life, scientists use many more measurements, but even a simple rate can give important clues.
Later, when scientists compare several data types at once, [Figure 3] remains useful because it shows that a single graph rarely tells the whole story. Strong forecasting comes from combining evidence.
A forecast is a scientific prediction based on evidence, data, and models. Forecasts are strongest when they are built from repeated observations. For example, if a volcano has shown the same warning signs before past eruptions, similar signs today may mean another eruption is possible.
Earthquake forecasting is more difficult than weather forecasting because scientists usually cannot say the exact day and hour when a fault will slip. Instead, they estimate probabilities. If a fault has produced several large earthquakes over many decades, scientists may say that a certain region has a higher chance of a damaging earthquake in the future. That is still useful information because it guides building codes and emergency planning.
Flood forecasts can sometimes be more specific. If weather models predict heavy rain over a river basin and the ground is already saturated, officials may issue flood warnings. Hurricane forecasts use satellites, aircraft, ocean measurements, and computer models to predict where a storm may move and how strong it may become.
Case study: using repeated flood data to estimate risk
A town records 6 major floods in 30 years.
Step 1: Find the average time between major floods.
\[\frac{30 \textrm{ years}}{6} = 5 \textrm{ years}\]
Step 2: Interpret the result carefully.
This does not mean a flood happens exactly every 5 years. It means that, on average, the historical record shows one major flood per 5-year interval.
Step 3: Use the pattern for planning.
If rainfall is increasing and homes are being built in the floodplain, the real risk may become even higher than the old average suggests.
The data help planners decide where homes, roads, and shelters should be placed.
Good forecasts also include uncertainty. Nature is complex, and no model captures every detail. That does not make forecasting useless. In fact, science becomes more reliable when scientists clearly explain what is known, what is uncertain, and what extra data are needed.
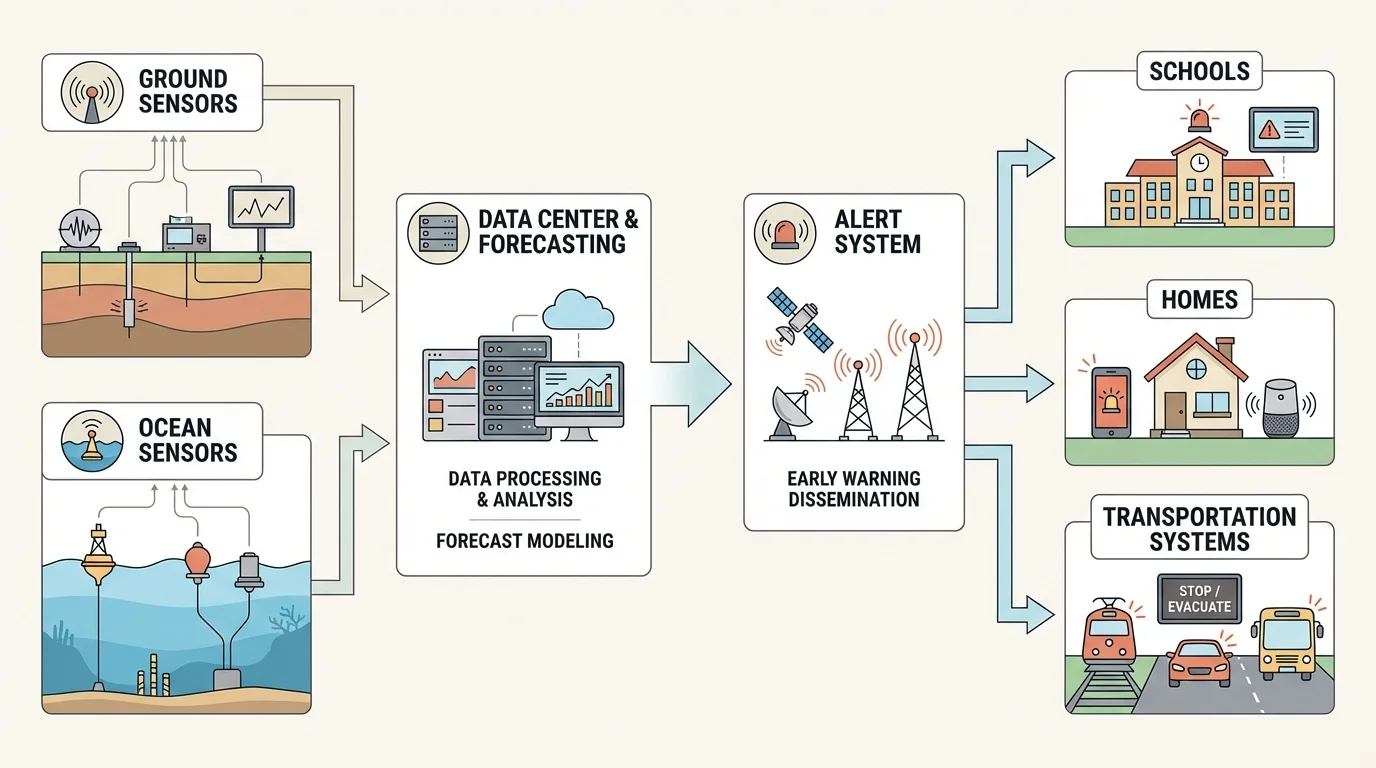
Forecasting matters most when it leads to action. [Figure 4] Technology turns data into protection. Sensors in the ground can detect earthquake waves. Buoys in the ocean can detect unusual sea-level changes linked to tsunamis. Weather satellites can follow hurricanes from space. River gauges can send water-level data automatically to emergency centers.
Once data are collected, computers analyze them rapidly. If danger crosses a certain threshold, alerts can be sent to phones, radios, schools, transportation systems, and hospitals. Even a short warning can help. A few seconds of earthquake warning may be enough to stop trains, shut off gas lines, or let people move away from windows.
Engineering also reduces damage. Buildings in earthquake-prone regions may be designed to bend without collapsing. Coastal barriers and elevated structures can reduce flood damage. Volcano observatories track gas, heat, and ground deformation to warn nearby communities. Fire-resistant materials and controlled burns can lower wildfire risk. These are all examples of mitigation in action.
Technology is not only about machines. Hazard-resistant land-use planning is also a form of protection. If maps show that a place floods often, building a school there is a poor choice. If a slope has a history of landslides, roads and houses should be placed elsewhere or engineered very carefully.
Later decisions about safety still connect back to [Figure 4], because the figure shows that protection is a chain: sensing, analyzing, communicating, and responding. If one part fails, the whole system becomes weaker.
Some earthquake early warning systems detect fast-moving seismic waves and send alerts before the strongest shaking arrives. People farther from the epicenter may receive warning before they feel the quake.
Communities also need drills, trusted communication, and clear evacuation routes. The best technology works only if people know how to respond when an alert arrives.
In California, active faults such as the San Andreas Fault create long-term earthquake risk. Scientists map fault movement, measure tiny ground shifts using satellites, and record many small earthquakes to better understand stress along the fault system. Engineers use these data to improve building standards.
In Japan, subduction zones create earthquake, tsunami, and volcanic hazards in the same region. Because the country has a long hazard history and advanced monitoring systems, scientists can compare modern data with detailed records from past events. This has led to strong warning systems, tsunami defenses, and public drills, although extremely large events can still exceed expectations.
Along the Gulf Coast and Atlantic Coast of the United States, warm ocean water can feed hurricanes. Meteorologists monitor sea-surface temperatures, wind patterns, and storm pressure to forecast paths and intensity. Communities use evacuation maps and storm surge models to decide who should leave and when.
In mountainous regions, landslides often follow heavy rainfall or earthquakes. Scientists examine slope angle, rock type, vegetation, and drainage patterns. If repeated slides happen in the same area, hazard maps can guide road construction and slope stabilization projects.
Scientists rely on the same core practices across many fields: ask questions, gather evidence, look for patterns, build explanations, and revise ideas when new data appear. Natural hazard forecasting uses all of these practices together.
These examples show that no single solution works everywhere. Each region needs technologies and plans that match its own history, geology, climate, and population.
Earth scientists focus on understanding what is happening and why. They collect hazard data, study processes, and build models. Engineers use that knowledge to solve practical problems. They design stronger bridges, safer schools, better drainage systems, stronger communication networks, and more reliable warning devices.
After each major event, both groups learn more. If a bridge fails during an earthquake, engineers examine why. If a flood model underestimated water levels, scientists improve the model using new measurements. Progress often comes from carefully studying what went wrong.
This teamwork is especially important because human activities can increase hazard risk. Removing vegetation from hillsides may raise landslide danger. Paving large areas can increase runoff and worsen flooding. Building homes in fire-prone forests or on barrier islands can place more people in harm's way. Understanding where natural processes are strongest helps communities make wiser choices.
Some hazards are becoming more damaging because more people live in exposed areas. In addition, climate change can affect the intensity of some weather-related hazards by changing rainfall patterns, drought conditions, heat, and sea level. Scientists continue to collect long-term data so they can detect new trends as conditions change.
The goal is not to eliminate natural hazards; that is impossible. Earth will keep shifting, storms will keep forming, rivers will keep rising, and slopes will keep eroding. The goal is to reduce risk by understanding patterns, forecasting carefully, and designing smart responses.
When students learn to analyze hazard data, they are doing the same kind of thinking used by geologists, meteorologists, emergency planners, and engineers. They are learning how evidence from the past can protect people in the future.