Why does a metal spoon get hot in soup faster than a wooden one, and why does a small mug of cocoa warm up faster than a big pot? Questions like these lead to an important scientific idea: when energy is transferred to matter, particles move differently, and the temperature can change. Scientists investigate these patterns by planning careful tests, controlling variables, and looking for evidence instead of guessing.
To plan an investigation well, you need to connect what you can measure to what is happening on the particle level. In this topic, the main idea is that when energy is transferred into a sample, the particles in that sample may gain motion. That increased motion is connected to temperature. But the amount of temperature change does not depend on only one thing. It can depend on the type of matter, the amount of matter, and how much energy is transferred.
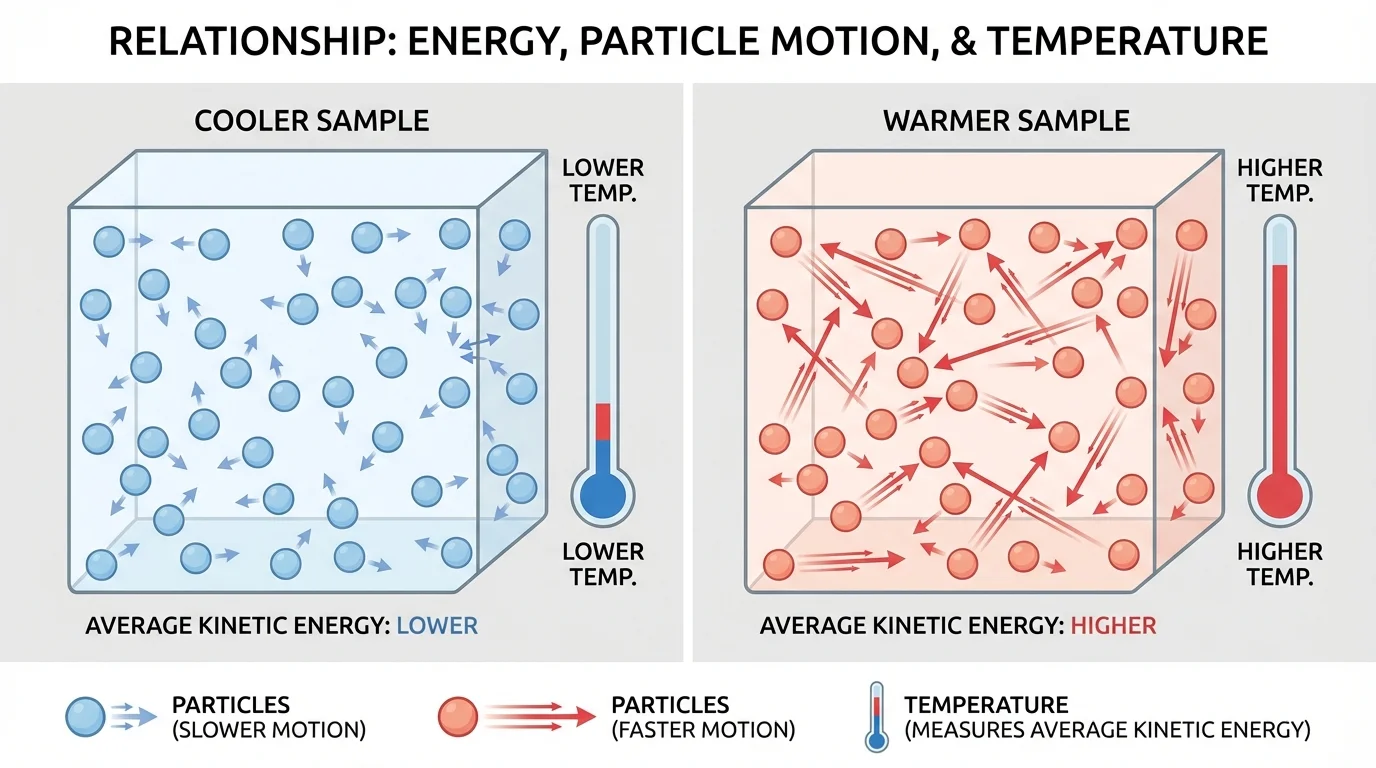
Temperature is related to the average motion of particles, as [Figure 1] shows. When a sample becomes warmer, the particles in it usually move faster on average. This means the sample's average kinetic energy increases.
Particles in solids vibrate, particles in liquids slide past one another, and particles in gases move freely. Even though these forms of matter behave differently, they all contain moving particles. A thermometer does not directly measure each particle's speed. Instead, it gives a temperature reading that helps us describe the average kinetic energy of the particles in the sample.
When energy moves from one place to another because of a temperature difference, we often describe this as thermal energy transfer. For example, if a hot plate warms a beaker of water, energy is transferred from the hot plate to the water. If the water's temperature rises from \(20 \textrm{ ^\circ C}\) to \(30 \textrm{ ^\circ C}\), the temperature change is \(10 \textrm{ ^\circ C}\).
Notice that temperature is not the same thing as total energy. A bathtub of warm water and a cup of warm water might have the same temperature, but they do not contain the same total amount of thermal energy. In this lesson, the focus is on planning an investigation and identifying relationships. You do not need to calculate the total amount of thermal energy transferred.
Temperature is a measure related to the average kinetic energy of the particles in a sample.
Mass is the amount of matter in a sample.
Energy transfer means energy moves from one object or system to another.
Change in temperature is the difference between the final and initial temperature: \(\Delta T = T_{final} - T_{initial}\).
If a sample starts at \(18 \textrm{ ^\circ C}\) and ends at \(26 \textrm{ ^\circ C}\), then \(\Delta T = 26 - 18 = 8 \textrm{ ^\circ C}\). This number tells you how much the temperature changed during the investigation. It does not tell you every detail about the energy transfer, but it gives useful evidence for comparing trials.
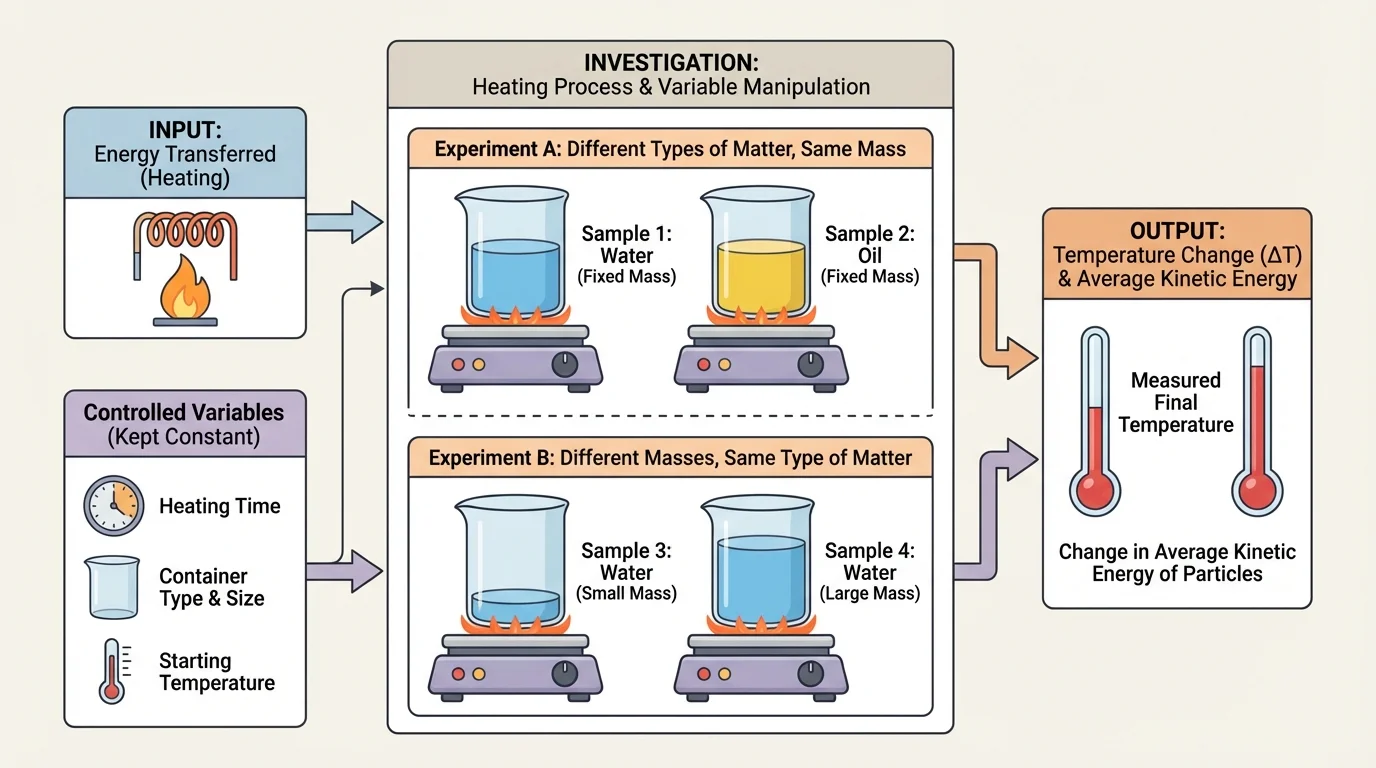
Scientists organize an investigation by identifying variables, and [Figure 2] helps show how these fit together. A variable is any factor that can change in an experiment.
The independent variable is the factor you choose to change on purpose. The dependent variable is what you measure in response. Controlled variables are the factors you keep the same so the test is fair.
In this topic, you are investigating relationships among four important ideas: energy transferred, type of matter, mass, and change in average kinetic energy as measured by temperature. Since temperature is what you can measure directly, the dependent variable is often the temperature change, \(\Delta T\).
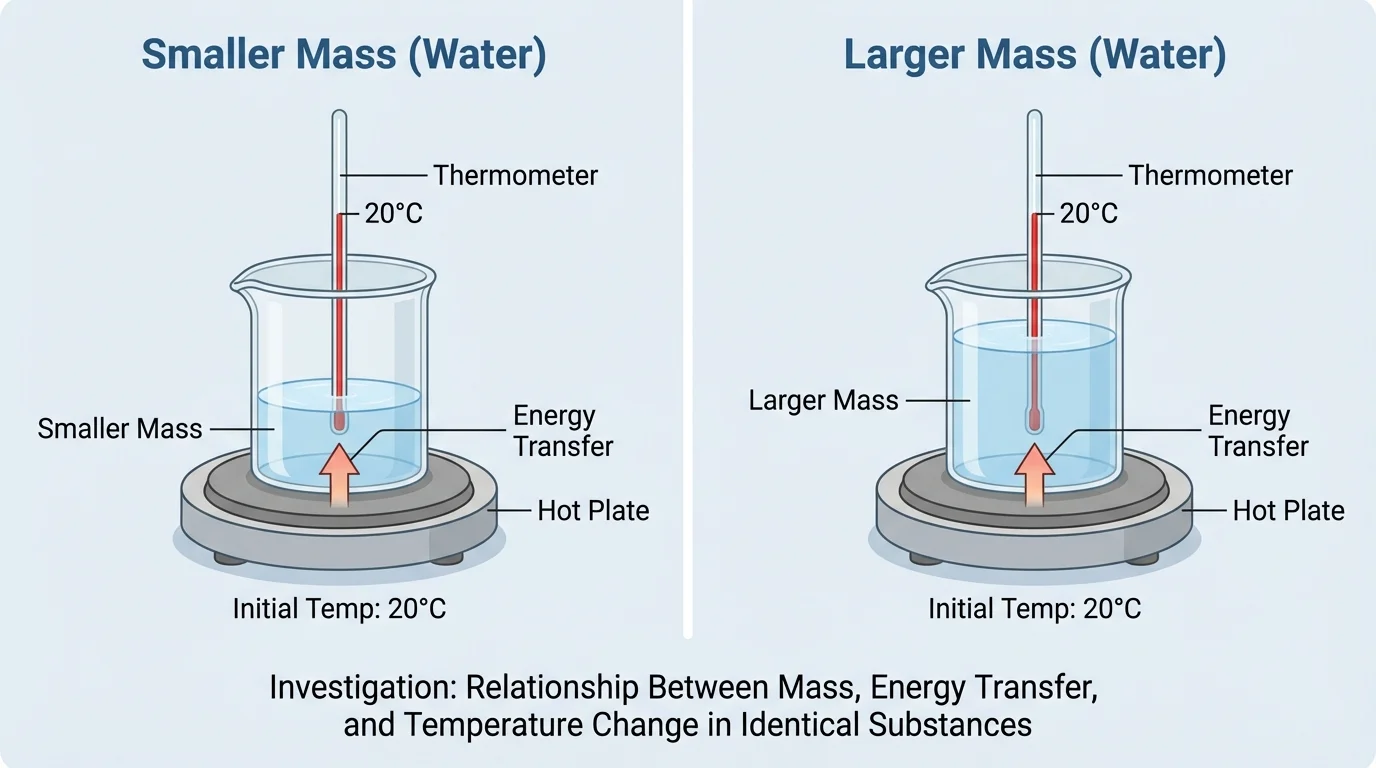
Suppose you want to know how mass affects temperature change. Then mass is the independent variable. You might keep the type of matter the same by using only water, keep the starting temperature the same, use the same container, and transfer energy in the same way for each trial. If the smaller mass warms more than the larger mass, that pattern suggests a relationship between mass and temperature change.
If you want to know how the type of matter affects temperature change, then the type of matter becomes the independent variable. You could compare equal masses of water, cooking oil, and sand while keeping the same starting temperature and the same heating conditions. Then you would measure how much each sample's temperature changes.
| Question being tested | Independent variable | Dependent variable | Examples of controlled variables |
|---|---|---|---|
| How does mass affect warming? | Mass | Temperature change | Type of matter, container, starting temperature, heater setting |
| How does matter type affect warming? | Type of matter | Temperature change | Mass, container, starting temperature, heater setting |
| How does energy transferred affect warming? | Amount of energy transferred | Temperature change | Mass, type of matter, container, starting temperature |
Table 1. Examples of independent, dependent, and controlled variables for three versions of the investigation.
As shown in [Figure 3], a good investigation changes one main factor at a time. If you change both mass and type of matter together, you cannot tell which one caused the temperature change. Fair tests are powerful because they make the evidence more trustworthy.
In a fair setup, the equipment and conditions should be as similar as possible. Use the same size container if possible, the same heating device, the same starting temperature, and the same measuring tools. If one beaker is glass and the other is foam, the container itself may affect the results.
You also need a clear procedure. For example, you might use a hot plate set to the same level for every trial, heat each sample for the same amount of time, and measure the temperature immediately after heating stops. Repeating each trial at least \(3\) times helps reduce the effect of accidental errors.
What makes an investigation fair? A fair investigation controls conditions so that the effect of one changing factor can be seen clearly. If the only planned difference between two trials is mass, then any pattern in temperature change is more likely to be caused by mass rather than by different containers, different start times, or different starting temperatures.
Safety matters too. Hot plates, hot water, hot glass, and heated materials can burn skin. Wear goggles if your teacher requires them, use heat-resistant gloves when needed, and never touch heated containers directly without checking whether they are safe to handle.
There are several related questions inside this big investigation. One way to keep the work organized is to test one relationship at a time.
Testing mass: Use the same substance, such as water. Prepare samples with masses of \(50 \textrm{ g}\), \(100 \textrm{ g}\), and \(150 \textrm{ g}\). Start them all at the same temperature and heat them using the same setup. If the \(50 \textrm{ g}\) sample shows a larger temperature increase than the \(150 \textrm{ g}\) sample, then a smaller mass reaches a greater temperature change under those conditions.
Testing type of matter: Use equal masses, such as \(100 \textrm{ g}\) each, of water, sand, and cooking oil. Start them at the same temperature and heat them the same way. If one material warms more than another, that shows matter type affects the relationship between energy transfer and temperature change.
Testing energy transferred: Use the same mass and same substance, but change the heating time or heater setting in a controlled way. For example, keep the mass at \(100 \textrm{ g}\) of water and heat for \(1\), \(2\), and \(3\) minutes using the same device. If the temperature change increases as heating time increases, the data suggest that more energy transferred leads to a greater increase in average kinetic energy.
Water is well known for changing temperature more slowly than many other materials. That is one reason oceans warm and cool more slowly than land, which strongly affects weather and climate near coasts.
These tests help reveal patterns, but the relationships are not always simple if you change many conditions at once. That is why scientists isolate variables. The clearer the design, the clearer the evidence.
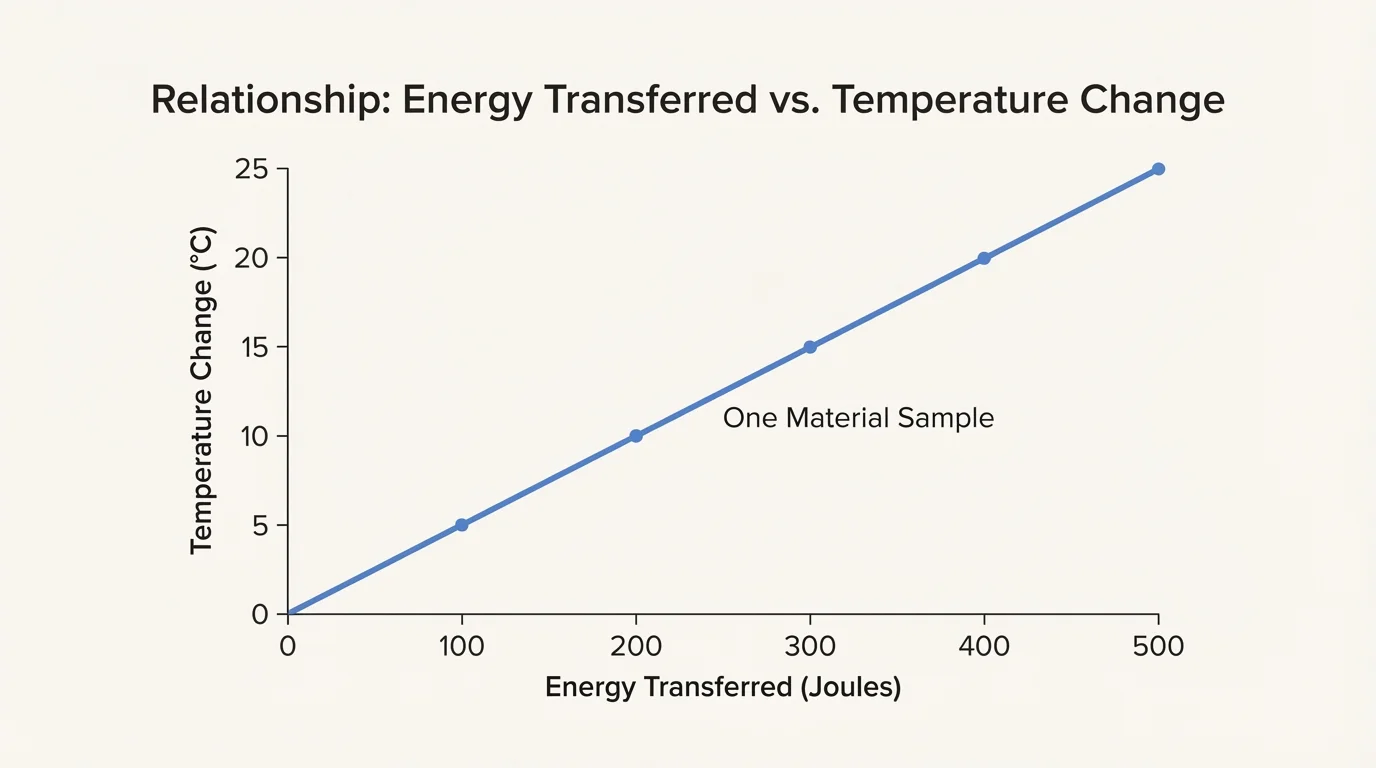
Once you collect measurements, look for patterns in tables and graphs, as [Figure 4] illustrates for an increasing trend. You are not trying to compute the total thermal energy transferred. Instead, you are using temperature changes to compare how samples respond.
A basic data table should include the sample type, mass, starting temperature, final temperature, and temperature change. Since \(\Delta T = T_{final} - T_{initial}\), if a sample starts at \(22 \textrm{ ^\circ C}\) and ends at \(29 \textrm{ ^\circ C}\), then \(\Delta T = 7 \textrm{ ^\circ C}\).
You can graph your results to make patterns easier to see. For example, if energy transferred increases along the horizontal axis and temperature change increases along the vertical axis, an upward trend suggests that larger energy transfers produce larger temperature changes for the same mass and same material.
When you compare different masses of the same substance, you may notice that larger masses often show smaller temperature changes under the same heating conditions. When you compare different substances with equal masses, the temperature changes may still differ. That evidence tells you the type of matter matters, not just the amount.
Later, if you revisit the graph in [Figure 4], you can use it to describe relationships in words such as increases, decreases, stays the same, or changes at a different rate. Middle school science often focuses on recognizing these patterns instead of doing advanced calculations.
Consider a simple set of trials using equal heating conditions. Trial A uses \(50 \textrm{ g}\) of water and the temperature changes from \(20 \textrm{ ^\circ C}\) to \(32 \textrm{ ^\circ C}\). The temperature change is \(12 \textrm{ ^\circ C}\). Trial B uses \(100 \textrm{ g}\) of water and the temperature changes from \(20 \textrm{ ^\circ C}\) to \(26 \textrm{ ^\circ C}\). The temperature change is \(6 \textrm{ ^\circ C}\). This suggests the larger mass warmed less under the same conditions.
Example: Comparing two masses of the same material
A student heats two water samples with the same heater for the same amount of time.
Step 1: Record the starting and final temperatures.
Sample \(A\): \(18 \textrm{ ^\circ C}\) to \(28 \textrm{ ^\circ C}\)
Sample \(B\): \(18 \textrm{ ^\circ C}\) to \(23 \textrm{ ^\circ C}\)
Step 2: Find each temperature change.
For sample \(A\), \(\Delta T = 28 - 18 = 10 \textrm{ ^\circ C}\).
For sample \(B\), \(\Delta T = 23 - 18 = 5 \textrm{ ^\circ C}\).
Step 3: Compare the trials.
If sample \(A\) had less mass than sample \(B\), the evidence supports the pattern that smaller mass can show a greater temperature increase when other conditions stay the same.
The conclusion comes from comparing patterns, not from calculating the total thermal energy.
Now compare different materials. Suppose \(100 \textrm{ g}\) of water changes by \(5 \textrm{ ^\circ C}\), \(100 \textrm{ g}\) of sand changes by \(9 \textrm{ ^\circ C}\), and \(100 \textrm{ g}\) of cooking oil changes by \(7 \textrm{ ^\circ C}\) under the same heating conditions. These results suggest the type of matter affects how much the temperature changes.
The particle explanation matters here. Different substances have particles arranged and interacting in different ways. Because of that, the same energy transfer can produce different temperature changes in different materials. This connects the visible measurement on a thermometer to the invisible behavior of particles.
From earlier study, remember that matter is made of tiny particles that are always moving. Heating usually increases particle motion, while cooling usually decreases it.
Real investigations are rarely perfect. Some energy may escape to the air instead of warming the sample. A thermometer may be read a little too early or too late. A hot plate may not heat every spot equally. If the starting temperatures are not exactly the same, the comparison becomes less fair.
Scientists improve investigations by reducing these errors. They may use lids to reduce energy loss, stir liquids gently before taking a temperature, use digital temperature probes for more precise readings, and repeat trials. If three trials give temperature changes of \(6 \textrm{ ^\circ C}\), \(7 \textrm{ ^\circ C}\), and \(6 \textrm{ ^\circ C}\), the pattern is more convincing than a single trial alone.
The setup in [Figure 3] remains useful here because it reminds us that matching equipment and starting conditions helps reduce hidden differences. Good science is not just about getting data; it is about getting dependable data.
These ideas matter far beyond the classroom. In cooking, a small potato cooks faster than a large one because mass affects how quickly temperature changes. A metal pan handle can become dangerously hot because energy is transferred efficiently through the metal. Soup, oil, and water may heat differently because they are different kinds of matter.
Engineers use these ideas when designing car engines, home insulation, and electronics. A phone or laptop must release extra energy so it does not overheat. Medical workers also think about heat transfer when using ice packs or warming blankets. In Earth science, land and water heat at different rates, helping create winds near oceans and lakes.
"The important thing in science is not so much to obtain new facts as to discover new ways of thinking about them."
— William Lawrence Bragg
Planning an investigation about energy transfer teaches more than one topic at a time. It builds scientific habits: asking a clear question, changing one variable at a time, collecting evidence carefully, and connecting measurements to particle motion. That is how scientists make sense of patterns in the natural world.