A small pond can look peaceful one week and completely different a month later. After heavy rain, plants may grow quickly, insects may become more common, and frogs may seem to be everywhere. After a dry period, the same pond can shrink, fish may struggle, and some animals may move away. These changes happen because life in an ecosystem depends on resources, and when resource availability changes, organisms and populations change too.
Scientists do not just guess what is happening in an ecosystem. They collect data such as rainfall amounts, plant height, fish counts, or the number of nests in an area. Then they look for patterns and evidence. When students analyze and interpret data, they are acting like scientists by using observations, measurements, and comparisons to explain what is happening in the natural world.
In ecology, resource availability refers to how much of an important resource is present and usable in an ecosystem. Resources include food, water, sunlight, oxygen, nutrients in soil, shelter, and space. Different organisms need different combinations of resources. A cactus needs water, but much less than a water lily. A hawk needs food and nesting space. Grass needs sunlight, water, and soil nutrients.
Resource refers to anything an organism needs to live, grow, and reproduce. Ecosystem refers to all the living organisms in an area and the nonliving parts of their environment interacting together. Population refers to all the members of one species living in the same area at the same time.
Some resources are connected to abiotic factors, which are nonliving parts of the environment such as temperature, water, sunlight, soil, and air. Others involve biotic factors, which are living things such as plants, prey, predators, parasites, and competitors. For example, rainfall is an abiotic factor, but grass growing after rainfall becomes a biotic resource for rabbits and deer.
Resource availability is not always about scarcity. Sometimes there is plenty of one resource but too little of another. A forest may have abundant sunlight at the top of the trees but very little on the forest floor. A lake may have lots of water but not enough dissolved oxygen for certain fish. That is why scientists look at multiple variables before drawing conclusions.
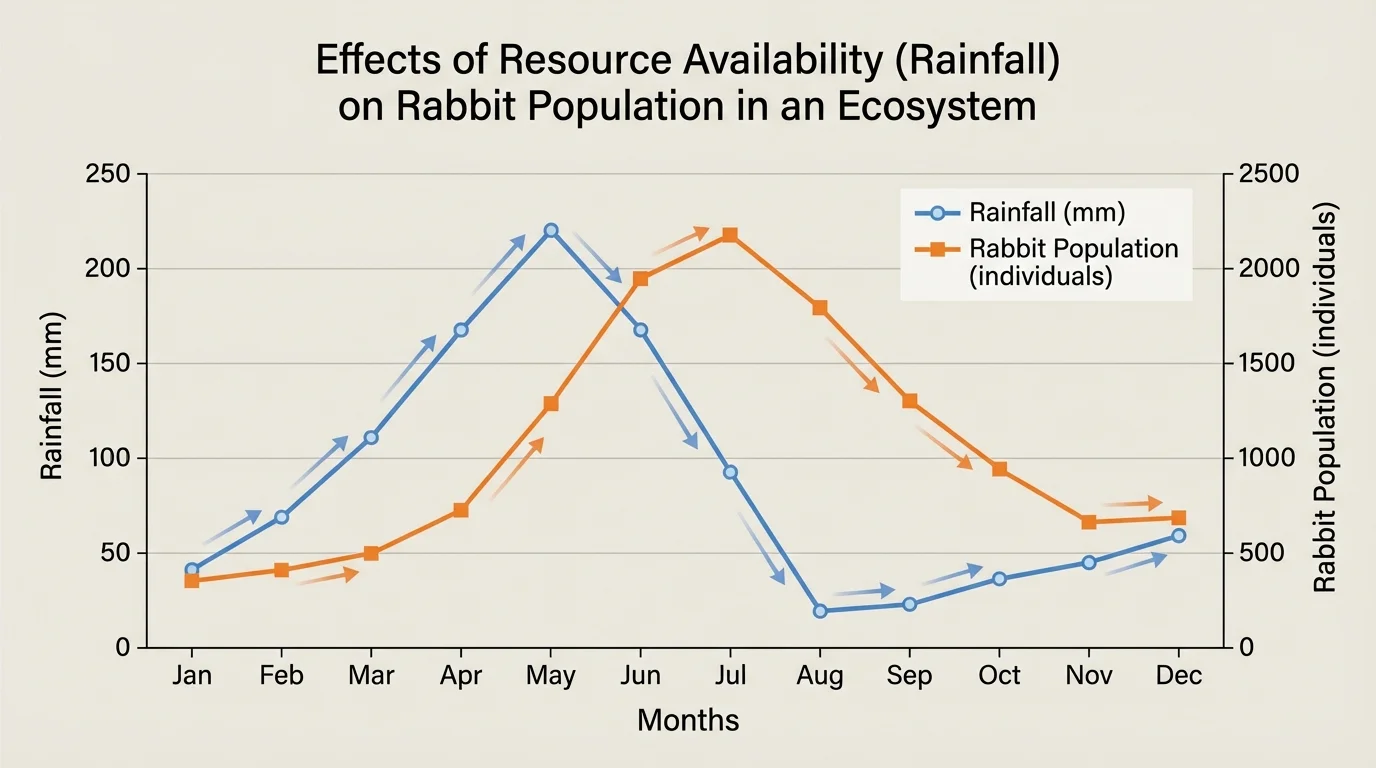
When scientists study ecosystems, they often compare two or more sets of information to see whether changes happen at the same time or in a sequence. A graph can reveal a pattern quickly, as shown in [Figure 1] for changing rainfall and population numbers. A table can help with exact values. Good analysis asks questions such as: What changed? When did it change? Did another variable change too? Is the relationship direct or indirect?
Suppose rainfall increases from one month to the next. If plant growth increases soon after, and rabbit numbers rise later, that pattern suggests a chain of effects. Rain does not directly create rabbits. Instead, more rain can lead to more plant growth, and more plants can provide more food for rabbits. Interpreting data means connecting evidence carefully instead of jumping to conclusions.
Scientists also watch for exceptions. A graph might show that rainfall increased, but a rabbit population still dropped. Why? Perhaps disease spread, predators increased, or a fire damaged shelter. Data interpretation is strongest when it considers more than one possible cause and uses evidence to support the best explanation.
From earlier life science study, you may remember that organisms must survive long enough to grow and reproduce. Resources affect all three of these: survival, growth, and reproduction.
Another useful idea is that population changes are often measured over time. If a bird population changes from \(40\) to \(55\) individuals in one season, the change is \(15\) birds. If it later drops to \(35\), the change from \(55\) to \(35\) is \(20\) birds. The numbers themselves matter, but the direction of change matters too.
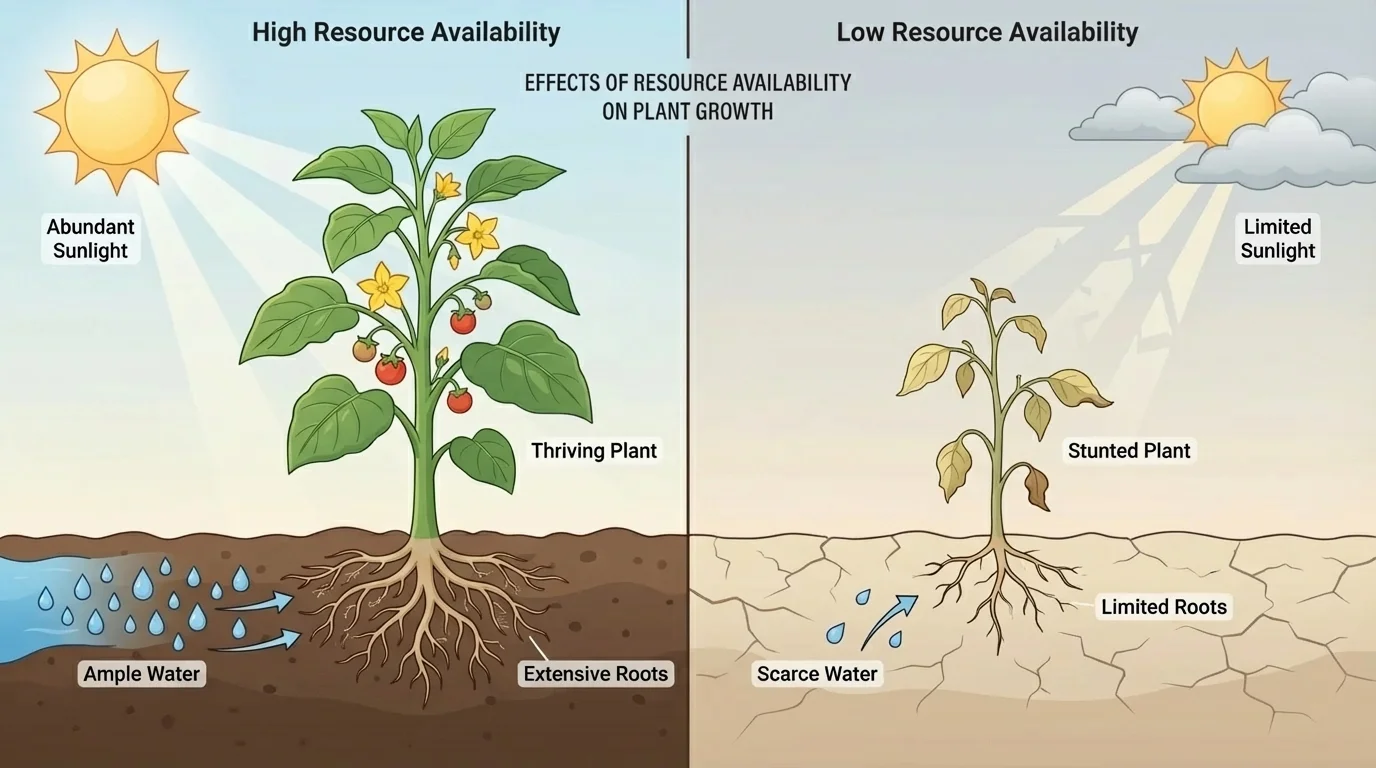
As shown in [Figure 2], an individual organism responds to resource changes in ways that can often be measured. If a plant gets enough sunlight, water, and nutrients, it can grow taller, produce more leaves, and make more seeds. If one of those resources becomes limited, the same kind of plant may stay small, wilt, or produce fewer seeds.
Animals also show measurable changes when resources differ. A squirrel with enough food stores is more likely to survive winter. A bird that cannot find enough insects may lay fewer eggs. A fish in warm water with low oxygen may become stressed and less active. The effect of resource availability is not just whether an organism is alive or dead. It can also influence body size, health, energy use, and ability to reproduce.
Plants provide especially clear examples because they cannot move to a new place easily. If seedlings grow in crowded shade, some may become thin and weak because they are competing for light. If two identical groups of bean plants receive different amounts of water, the group with less water often has shorter average height. Students can collect data such as average height, number of leaves, or mass to support this conclusion.
Resource effects can sometimes be calculated simply to compare evidence. For example, if one set of plants grows from \(6\) centimeters to \(18\) centimeters, the increase is \(12\) centimeters. If another set grows from \(6\) centimeters to \(10\) centimeters, the increase is only \(4\) centimeters. Since \(12\) is greater than \(4\), the first set shows stronger growth under its conditions. In math notation, the growth differences are \(18 - 6 = 12\) and \(10 - 6 = 4\).
Using plant data as evidence
A class grows two groups of radish plants for two weeks. Group A receives regular water. Group B receives half as much water.
Step 1: Record the average heights.
Group A average height: 14 centimeters. Group B average height: 9 centimeters.
Step 2: Compare the values.
The difference is \(14 - 9 = 5\) centimeters.
Step 3: Make a claim supported by evidence.
The plants with more water grew 5 centimeters taller on average, so the data provide evidence that greater water availability increased growth.
This does not prove water is the only factor that matters, but it does provide evidence that water availability affected those organisms under those conditions.
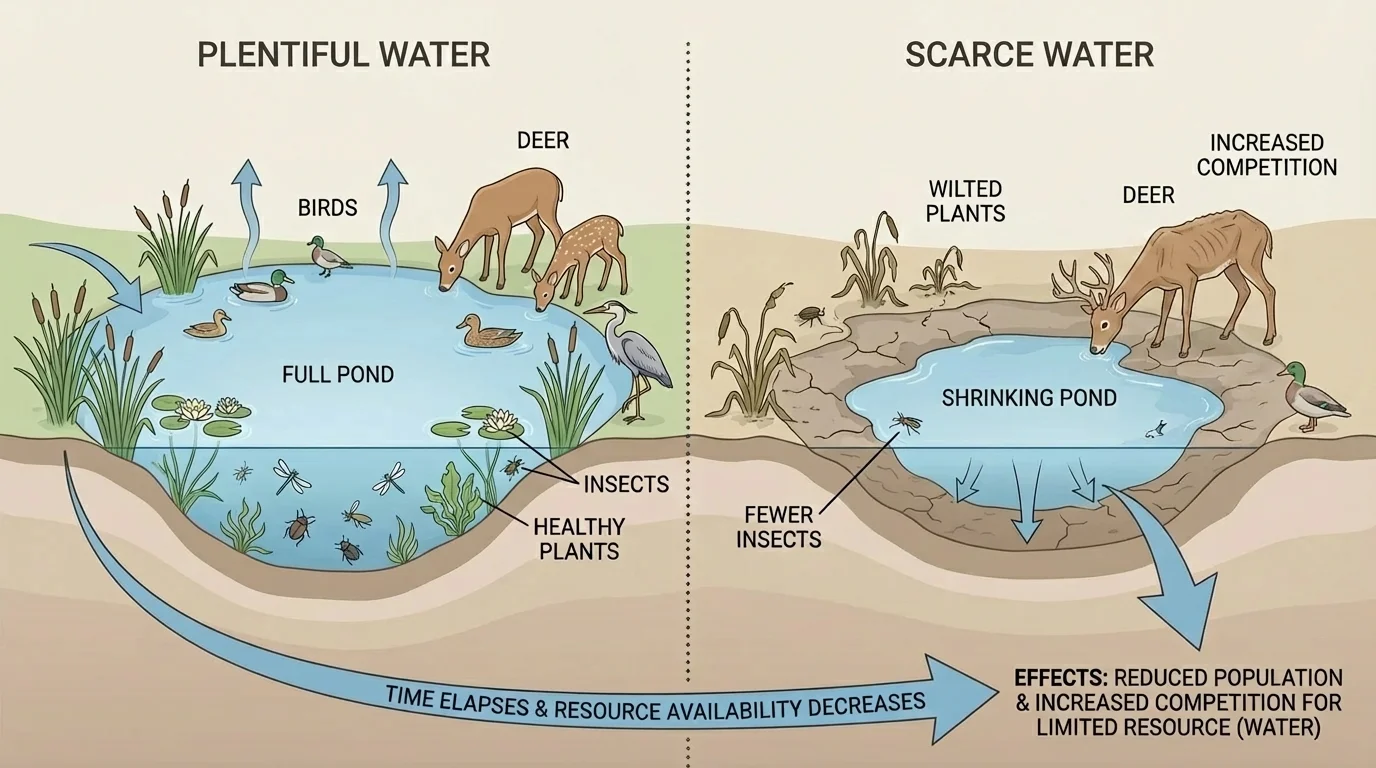
At a shrinking water source, as shown in [Figure 3], competition occurs when many organisms depend on the same limited resource. When food, water, space, or shelter becomes harder to get, not every member of a population can access what it needs. As a result, some individuals may die, some may reproduce less, and some may leave the area. Over time, the population size can decrease.
When resources become more available, populations may increase. After a rainy season, desert annual plants can sprout quickly. More plants can support more insects. More insects can support more lizards or birds. In this way, one abiotic change can cause several population changes through a food web.
Competition can happen within the same species and between different species. Deer in the same meadow compete with each other for grass. Deer and rabbits may also compete if both eat the same young plants. If one species uses a resource more effectively, the other species may decrease in number in that area.
Population data often appear as counts taken at regular times. If a fish population is 120 in spring, 98 in summer, and 70 by late summer during a drought, the downward trend suggests that reduced water or oxygen may be affecting survival. This pattern becomes stronger evidence if the drought data are combined with measurements of lower water depth and higher water temperature.
As we saw earlier in [Figure 1], a change in one resource may be followed by a delayed response in a population. Populations do not always respond instantly. Plants may need time to grow after rain, and herbivores may need more time before their numbers rise.
More resources do not always mean healthier ecosystems
Some resources help only up to a point. Too much of a substance, especially when it enters the wrong part of an ecosystem, can cause problems. For example, extra nutrients washing into a pond can trigger rapid algae growth that harms other organisms.
This is why interpreting ecosystem data requires careful thinking about both amount and balance. Organisms need resources, but ecosystems function best when resources are available in suitable amounts and places.
Consider a grassland where scientists measured rainfall, average grass height, and the number of grazing insects each month. If rainfall rose in April and May, grass height rose in May and June, and insect numbers rose in June and July, the sequence suggests that rainfall increased plant growth, which then supported a larger insect population.
Here is a simple data table showing how evidence can be organized.
| Month | Rainfall | Average Grass Height | Grazing Insects Counted |
|---|---|---|---|
| March | 2 centimeters | 5 centimeters | 18 |
| April | 6 centimeters | 7 centimeters | 21 |
| May | 9 centimeters | 11 centimeters | 29 |
| June | 8 centimeters | 14 centimeters | 41 |
From this table, one claim could be: increased rainfall is associated with taller grass, and taller grass is associated with more grazing insects. The evidence comes from the upward pattern across the months. Students should notice that the insect count rises from 18 to 41 while grass height rises from 5 centimeters to 14 centimeters.
Interpreting the grassland table
Step 1: Identify the changing resource.
Rainfall increases from 2 centimeters in March to 9 centimeters in May.
Step 2: Identify organism responses.
Grass height increases from 5 centimeters to 14 centimeters from March to June. Grazing insects increase from 18 to 41.
Step 3: Connect the pattern.
More rainfall likely supported more plant growth, and more plant growth likely provided more food for insects.
This is an evidence-based explanation, not just a guess. However, scientists would still stay open to other factors, such as temperature or predator numbers.
Changes in resource availability can also have indirect effects in a pond affected by nutrient runoff. Nutrients such as nitrogen and phosphorus can help plants and algae grow. But when too much fertilizer from farms or lawns washes into a pond, algae may grow very rapidly. This event is called an algal bloom.
As [Figure 4] shows, it may at first seem like extra nutrients should help the ecosystem. Yet large algae growth can block sunlight from underwater plants. When algae die, decomposers break them down and use oxygen from the water. Fish and other aquatic organisms may then have too little oxygen available.
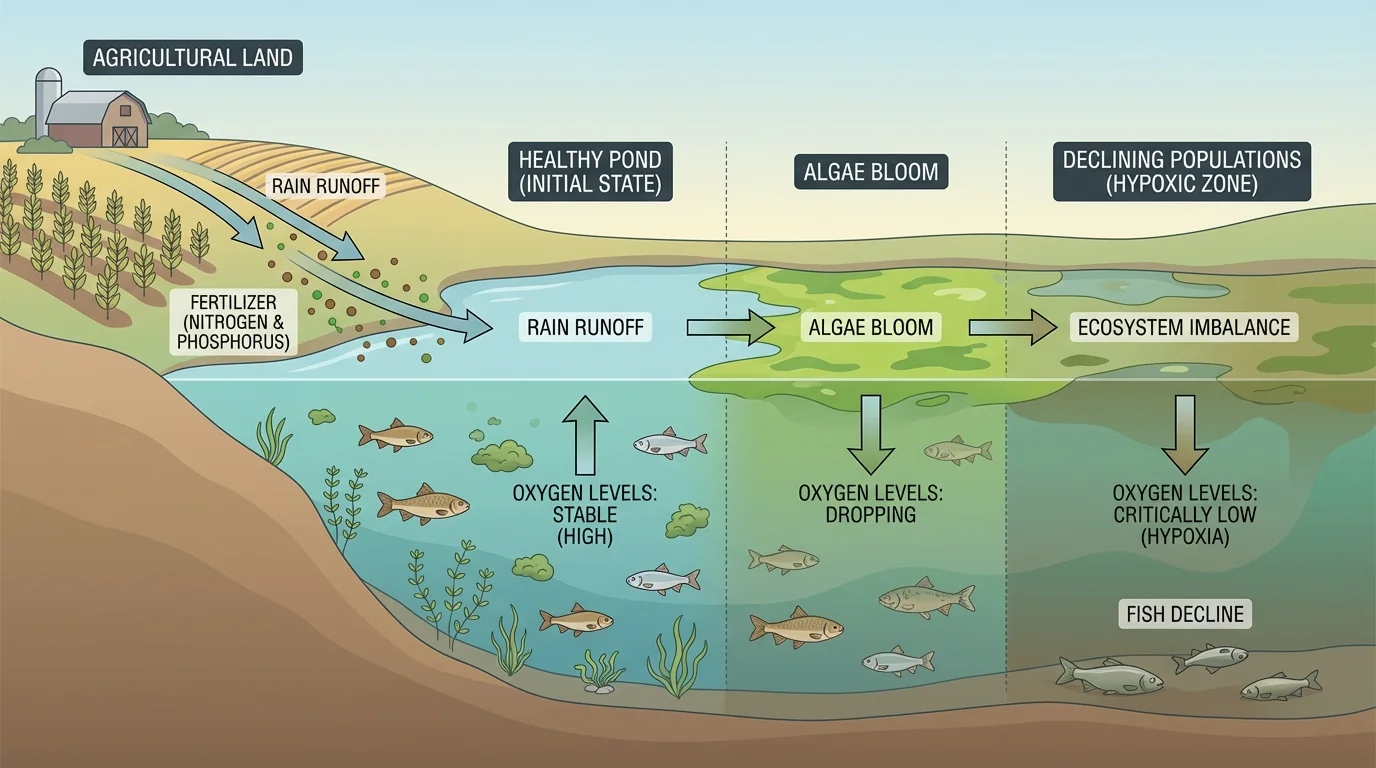
Suppose oxygen measurements in a pond fall from \(8\) milligrams per liter to \(3\) milligrams per liter after a bloom, while fish counts drop from \(52\) to \(19\). The data support the claim that changing nutrient availability affected other resources, especially oxygen, and that this harmed the fish population.
Some harmful algal blooms produce toxins that can affect fish, birds, pets, and even humans. A resource that seems helpful in one place, such as fertilizer on crops, can cause major ecosystem problems in another place.
This example shows an important idea: resource effects can be direct or indirect. Nutrients do not attack fish directly, but they can trigger changes that reduce fish survival.
Ecosystems work through constant interaction between living and nonliving factors. Rainfall, temperature, and sunlight influence plant growth. Plant growth influences herbivores. Herbivores influence predators. Disease, decomposition, and shelter availability also matter. When analyzing data, it is useful to ask whether a change started with an abiotic factor, a biotic factor, or both.
For example, a colder winter may reduce insect survival. Fewer insects may then lead to fewer nesting birds in spring. On the other hand, if an invasive plant spreads, it may reduce the space or nutrients available to native plants even without a weather change. In both cases, population changes can be traced back to resource availability.
The shrinking pond shown earlier in [Figure 3] is a good reminder that one abiotic change, reduced water, can reshape many biotic interactions at the same time. Organisms may compete more strongly, move away, or reproduce less.
Understanding resource availability helps people make decisions in agriculture, wildlife management, and conservation. Farmers monitor soil nutrients and water because crops need enough resources to grow well. Wildlife biologists study food and habitat availability when protecting animal populations. City planners consider green space and water flow because human construction changes access to resources for many species.
In fisheries, scientists track oxygen, temperature, and food supply to understand why fish populations rise or fall. In forests, researchers examine how drought affects tree growth and how that change influences insects and birds. In restoration projects, people may plant native species, reduce pollution, or improve water flow to bring back needed resources.
"Everything is connected to everything else."
— A key principle of ecology
This principle matters whenever we interpret ecosystem data. A change in one resource can ripple through an entire system, sometimes in ways that are not obvious at first.
When you analyze data about ecosystems, look for several common patterns. First, there may be a trend, which is a general direction of change over time, such as increasing plant height or decreasing fish counts. Second, there may be a time lag, where one variable changes first and another changes later. Third, there may be indirect effects, where one change triggers another through several steps.
Students should also compare evidence carefully. If two variables rise together, that can suggest a relationship, but more evidence is needed before proving cause. Scientists strengthen explanations by using multiple measurements. For example, low rainfall plus dry soil plus shorter plants is stronger evidence than rainfall data alone.
One more important skill is separating observation from interpretation. An observation might be: "The rabbit population decreased from 34 to 20." An interpretation might be: "Reduced plant growth likely lowered food availability, causing the rabbit population to decrease." Good science uses observations as evidence for interpretations.
As shown earlier in [Figure 4], resource changes can cause chain reactions. A single set of data is useful, but connected data sets are often much more powerful because ecosystems are made of linked relationships.