Why are there peppered moths with different colors, bacteria that survive antibiotics, and animals whose body features seem to match their environments so well? The answer cannot be explained by luck alone. Over many generations, small differences can add up, and math helps us see those changes clearly. When scientists count traits in a population and track how the numbers change, they can support explanations of how natural selection shapes life over time.
A population is a group of organisms of the same species living in the same area. In any population, individuals are not exactly alike. Some may be faster, darker, taller, better at holding water, or more able to survive cold or heat. These differences matter because environments create challenges.
If a trait helps an organism survive long enough to reproduce, that trait may become more common in later generations. If a trait makes survival or reproduction harder, it may become less common. The key idea is that the population changes over time, not because organisms try to change, but because some inherited traits are passed on more often than others.
Natural selection is the process in which individuals with inherited traits that help them survive and reproduce in a certain environment leave more offspring than others.
Trait means a characteristic of an organism, such as fur color, beak shape, or resistance to a disease.
Generation is one step in a line of descent, such as parents and their offspring.
For natural selection to happen, three big conditions must be present: there must be variation in traits, some of those traits must be inherited, and the environment must affect which individuals survive and reproduce more successfully.
[Figure 1] Natural selection works on variation within a population. Suppose a group of mice lives on dark volcanic rock. Some mice have dark fur and some have light fur. Birds hunting from above can more easily spot the light mice. In that environment, dark fur is more helpful because it provides better camouflage and reduces visibility to predators.
Over time, more dark-fur mice survive and reproduce. Their offspring are more likely to inherit dark fur. After many generations, the population may include a larger fraction of dark-fur mice than before. A trait such as dark fur is considered an adaptation when it is inherited and improves survival or reproduction in that environment.
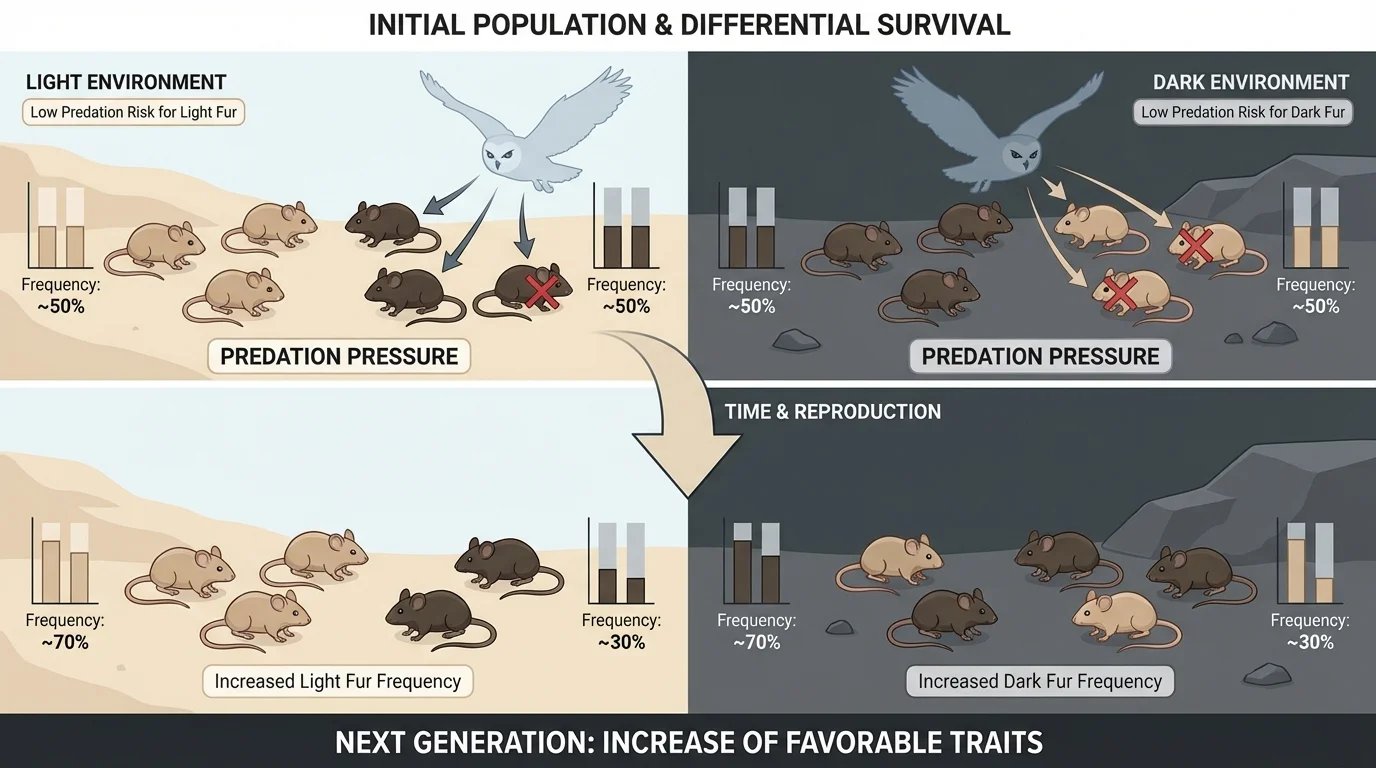
The environment provides selection pressures. Predators, temperature, water availability, disease, food sources, and even pollution can act as selection pressures. A trait that is helpful in one place or time may not help in another.
Natural selection is not a choice
Organisms do not change because they need to. Instead, some individuals already have inherited traits that fit the environment better. Those individuals are more likely to survive and reproduce, so the trait becomes more common in the population.
Scientists often describe success in natural selection using the idea of fitness. In evolution, fitness does not mean strongest or most athletic. It means how well an organism survives and produces offspring in its environment.
One mouse cannot evolve dark fur during its own lifetime because predators are present. But if dark-fur mice survive more often and have more offspring, then the population changes generation by generation.
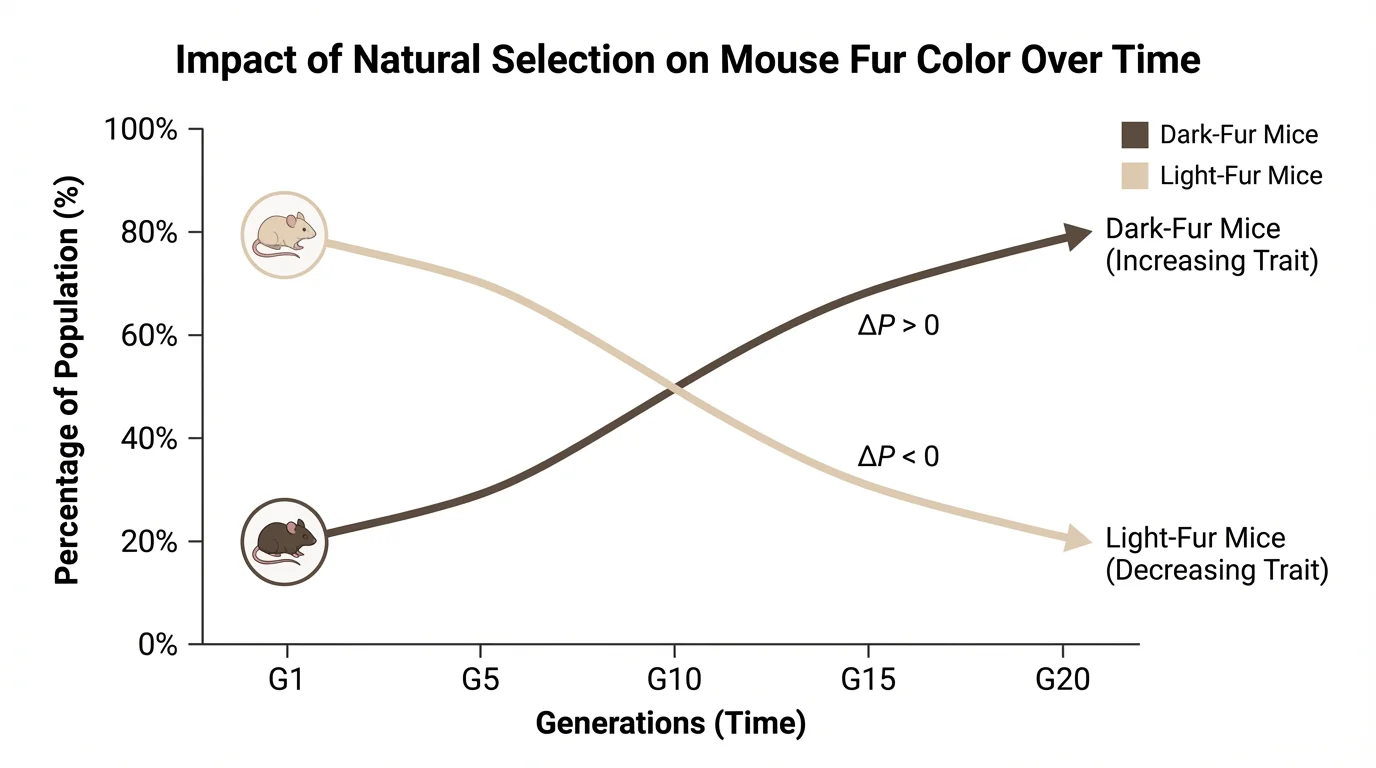
[Figure 2] This is where math becomes powerful. Instead of saying, "There seem to be more dark mice now," scientists count the numbers. They may compare how many individuals have each trait, calculate fractions, convert them to percentages, and make graphs. These mathematical representations turn observations into evidence.
Suppose a population starts with 20 mice: 8 dark and 12 light. The fraction of dark mice is \(\dfrac{8}{20} = \dfrac{2}{5}\), and the percentage of dark mice is \(\dfrac{8}{20} \times 100 = 40\%\). The percentage of light mice is \(\dfrac{12}{20} \times 100 = 60\%\). If later generations show different percentages, that supports the explanation that trait frequencies are changing.
Scientists use several simple math tools to track natural selection. Tables organize data, fractions show part-to-whole relationships, ratios compare groups, percentages make comparisons easier, and graphs reveal trends across generations. A graph is especially useful for seeing whether a trait is increasing or decreasing over time.
Here are common mathematical representations:
| Representation | What it shows | Example |
|---|---|---|
| Count | How many individuals have a trait | 12 dark mice, 18 light mice |
| Fraction | Part of the whole population | \(\dfrac{12}{30}\) dark |
| Ratio | Comparison between two groups | \(12:18 = 2:3\) |
| Percentage | Portion out of \(100\) | \(\dfrac{12}{30} \times 100 = 40\%\) |
| Line graph | How a trait changes over generations | Dark fur rises from \(40\%\) to \(70\%\) |
Graphs make trends easier to notice. If the line for one trait goes upward over several generations, that trait is becoming more common. If the line goes downward, the trait is becoming less common.
A graph does more than display numbers. It helps scientists support a cause-and-effect explanation: if the environment consistently favors one trait, the proportion of that trait may rise over time.
We can use numbers to build a scientific explanation. A mouse population lives on dark lava rock, where dark fur helps mice blend in.
Worked example: increase of a helpful trait
A population is counted over four generations.
Step 1: Record the data.
Generation \(1\): \(10\) dark mice and \(15\) light mice, for a total of \(25\).
Generation \(2\): \(13\) dark and \(12\) light, total \(25\).
Generation \(3\): \(16\) dark and \(9\) light, total \(25\).
Generation \(4\): \(18\) dark and \(7\) light, total \(25\).
Step 2: Convert the dark-fur counts to percentages.
Generation \(1\): \(\dfrac{10}{25} \times 100 = 40\%\)
Generation \(2\): \(\dfrac{13}{25} \times 100 = 52\%\)
Generation \(3\): \(\dfrac{16}{25} \times 100 = 64\%\)
Generation \(4\): \(\dfrac{18}{25} \times 100 = 72\%\)
Step 3: Describe the trend.
The dark-fur trait rises from \(40\%\) to \(72\%\). That is an increase of \(72\% - 40\% = 32\%\).
The data support the explanation that dark fur is favored in the dark-rock environment, so dark-fur mice survive and reproduce more often.
Notice what the math does here. It does not say dark fur is "better" in every place. It shows that dark fur is more successful in this environment. If the ground were light-colored sand, the pattern might reverse.
The trend in this example matches the pattern shown earlier in [Figure 1]: camouflage can change which individuals are more likely to survive long enough to reproduce.
Natural selection can also make a trait less common. Suppose a plant population includes some plants with very thick leaves and some with thinner leaves. Thick leaves help save water during drought. But then the environment changes and rainfall becomes more common year after year. Thick leaves may no longer provide a strong advantage, and if thinner leaves help plants grow faster, the thick-leaf trait may decrease.
Worked example: decrease of a once-helpful trait
A population of \(40\) plants is counted across three generations after the climate becomes wetter.
Step 1: Record thick-leaf plants.
Generation \(1\): \(24\) thick-leaf plants
Generation \(2\): \(18\) thick-leaf plants
Generation \(3\): \(12\) thick-leaf plants
Step 2: Convert to percentages.
Generation \(1\): \(\dfrac{24}{40} \times 100 = 60\%\)
Generation \(2\): \(\dfrac{18}{40} \times 100 = 45\%\)
Generation \(3\): \(\dfrac{12}{40} \times 100 = 30\%\)
Step 3: Explain the change.
The thick-leaf trait drops from \(60\%\) to \(30\%\), a decrease of \(30\%\).
The data support the idea that after the environment changed, thick leaves were less favored than before.
This is an important pattern in evolution: whether a trait increases or decreases depends on environmental conditions. There is no permanently best trait for every situation.
Some species can show different favored traits in nearby environments. A trait that helps in a dry valley may not help on a wet mountain slope only a short distance away.
Because environments change, natural selection can push populations in different directions over time. This helps explain both the unity and diversity of life: related organisms share common ancestry, but different environments can shape them differently.
[Figure 3] Natural selection is not only about fur, leaves, or beaks. It also affects human health. In a bacterial population, some bacteria may already have a trait that makes them resistant to an antibiotic. When the antibiotic is used, most non-resistant bacteria die, but resistant bacteria survive and reproduce.
This does not mean the antibiotic causes bacteria to "decide" to become resistant. Instead, resistant bacteria were already present in the population. The antibiotic acts as a selection pressure by killing bacteria without that trait.
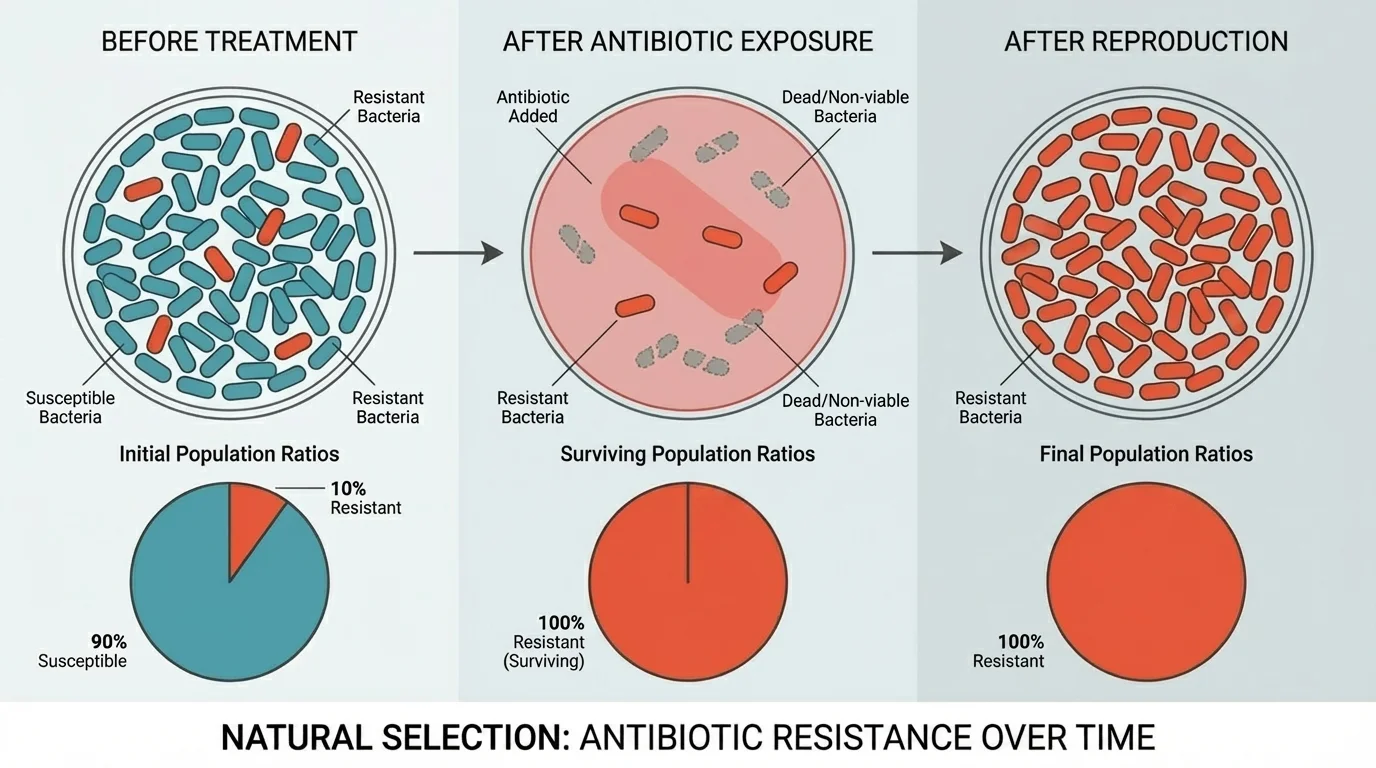
Suppose a sample starts with \(100\) bacteria: \(90\) are not resistant and \(10\) are resistant. Before treatment, the resistant fraction is \(\dfrac{10}{100} = 10\%\).
After the antibiotic is used, imagine that the \(90\) non-resistant bacteria die, but the \(10\) resistant bacteria survive. If those \(10\) resistant bacteria reproduce and the population grows back to \(100\) bacteria, then the resistant trait could make up nearly \(100\%\) of the new population.
This is one reason doctors warn against misusing antibiotics. If antibiotics are used when they are not needed, they can increase the chance that resistant bacteria become more common. The population changes, and treating infections becomes harder.
The same pattern appears here as in [Figure 1] and [Figure 3]: a trait already present in a population can spread when the environment favors individuals that have it.
Math helps scientists describe and support explanations, but it does not work alone. A graph or percentage tells what is changing. Scientists still need observations and experiments to explain why it is changing.
For example, if a trait rises from \(25\%\) to \(55\%\) over five generations, the numbers show a change. To explain the cause, scientists ask questions such as: Was there a new predator? Did the climate become drier? Was a new disease present? Did food sources change?
Math can also reveal that changes are sometimes small or uneven. A trait might increase one generation, stay almost the same the next, and then rise again later. Natural selection is a process over generations, not usually an instant transformation.
Fractions, ratios, and percentages all describe comparisons. A fraction shows part of a whole, a ratio compares quantities, and a percentage tells how much out of \(100\). These tools make biological patterns easier to compare across populations and generations.
Scientists often organize data in a table first and then graph it. This makes trends clearer, especially when comparing several generations or different environments.
A common mistake is saying that organisms get traits because they need them. Need alone does not create inherited traits. Natural selection works on inherited differences that already exist in a population.
Another mistake is thinking every trait that becomes common is perfect. A trait only needs to improve survival or reproduction enough to spread in a certain environment. Also, if the environment changes, the same trait may no longer be favored.
It is also wrong to think natural selection always leads to more complex organisms. Selection favors traits that fit the environment, not a ladder of progress. Sometimes a simpler structure is more useful.
Why evidence matters
A scientific explanation should connect a pattern in data to a biological cause. If the percentage of a trait changes over generations and there is a clear selection pressure, scientists can explain how natural selection may have caused the change.
That is why mathematical representations are so important. They let us move from opinions to evidence-based explanations.
When you read a table or graph about natural selection, look for four things. First, identify the trait being measured. Second, note whether its frequency is increasing or decreasing. Third, identify the environmental factor that may act as a selection pressure. Fourth, connect the trait to survival and reproduction.
For example, if a graph shows a bird population with large-beak individuals increasing from \(35\%\) to \(65\%\) after a drought, a strong explanation would say that harder seeds became more common, large beaks helped birds crack those seeds, and birds with large beaks survived and reproduced more often.
The explanation becomes stronger when it includes specific math. Instead of saying "the trait increased a lot," say "the trait increased by \(65\% - 35\% = 30\%\)." Specific numbers make the evidence clearer.
Building a complete explanation from data
Suppose \(50\) fish are counted in a pond. In generation \(1\), \(20\) have a stripe pattern. In generation \(5\), \(35\) have stripes.
Step 1: Find the starting percentage.
\(\dfrac{20}{50} \times 100 = 40\%\)
Step 2: Find the ending percentage.
\(\dfrac{35}{50} \times 100 = 70\%\)
Step 3: State the change.
The stripe trait increases by \(70\% - 40\% = 30\%\).
Step 4: Link the math to biology.
If striped fish are harder for predators to see among underwater plants, then the data support the explanation that natural selection favored the stripe trait.
When scientists compare populations in different places, they may find different patterns. One habitat may favor one trait, while another habitat favors a different trait. This helps explain why organisms in the same species can look different across regions.
Natural selection is one of the major processes that drives biological evolution. By using counts, fractions, percentages, tables, and graphs, scientists can support explanations for how and why specific traits increase or decrease in populations over time.