A hot drink left on a desk cools down. Ice dropped into juice melts while the drink gets colder. A car engine warms the air under the hood after running. These are ordinary events, but they point to a very deep idea in physics: when parts of a system begin at different temperatures, energy tends to spread out. The result is not random chaos but a predictable shift toward a more even distribution of thermal energy.
When two objects with different temperatures come into contact, the warmer one does not "lose coldness," and the cooler one does not "gain hotness." Instead, thermal energy moves from the warmer component to the cooler component. This transfer continues until the temperature difference becomes much smaller or disappears.
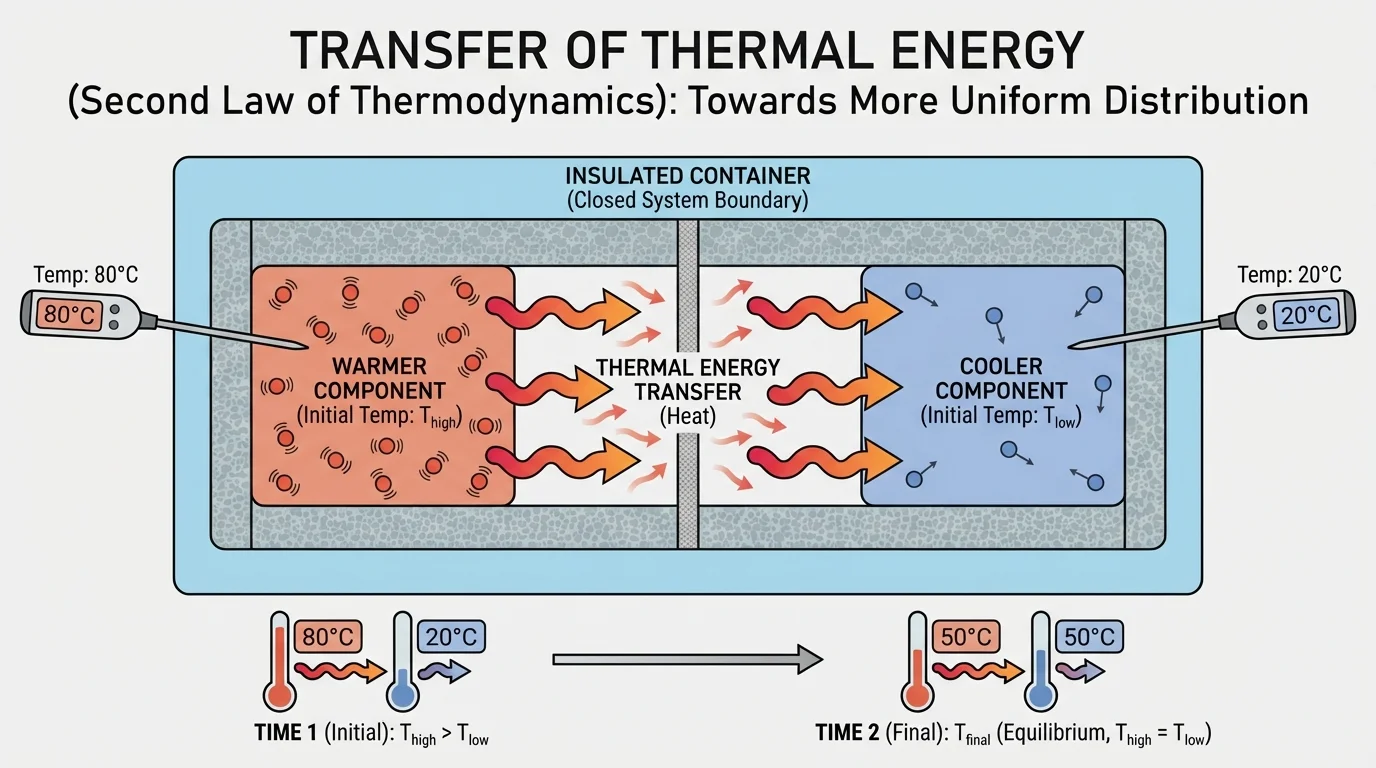
[Figure 1] Temperature tells us about the average kinetic energy of particles in a substance. Faster-moving particles usually mean a higher temperature. When faster particles interact with slower ones, collisions and interactions transfer energy. Over time, those particle energies become more evenly shared.
This idea connects directly to the second law of thermodynamics in a form you can investigate in class: in a closed system, thermal energy transfer tends to produce a more uniform energy distribution among the components. The system moves toward thermal equilibrium, not toward bigger temperature differences.
Thermal energy is the energy associated with the motion and interactions of particles in matter.
Temperature is a measure related to the average kinetic energy of particles in a substance.
System means the object or group of objects being studied.
Closed system means matter does not enter or leave the system, even though energy transfer may still happen among components inside it.
In this topic, the most important situation is a closed system made of two components at different temperatures. The important boundary surrounds both components together. Energy is transferred inside that boundary from the warmer part to the cooler part, so the total energy of the system is conserved even while its distribution changes.
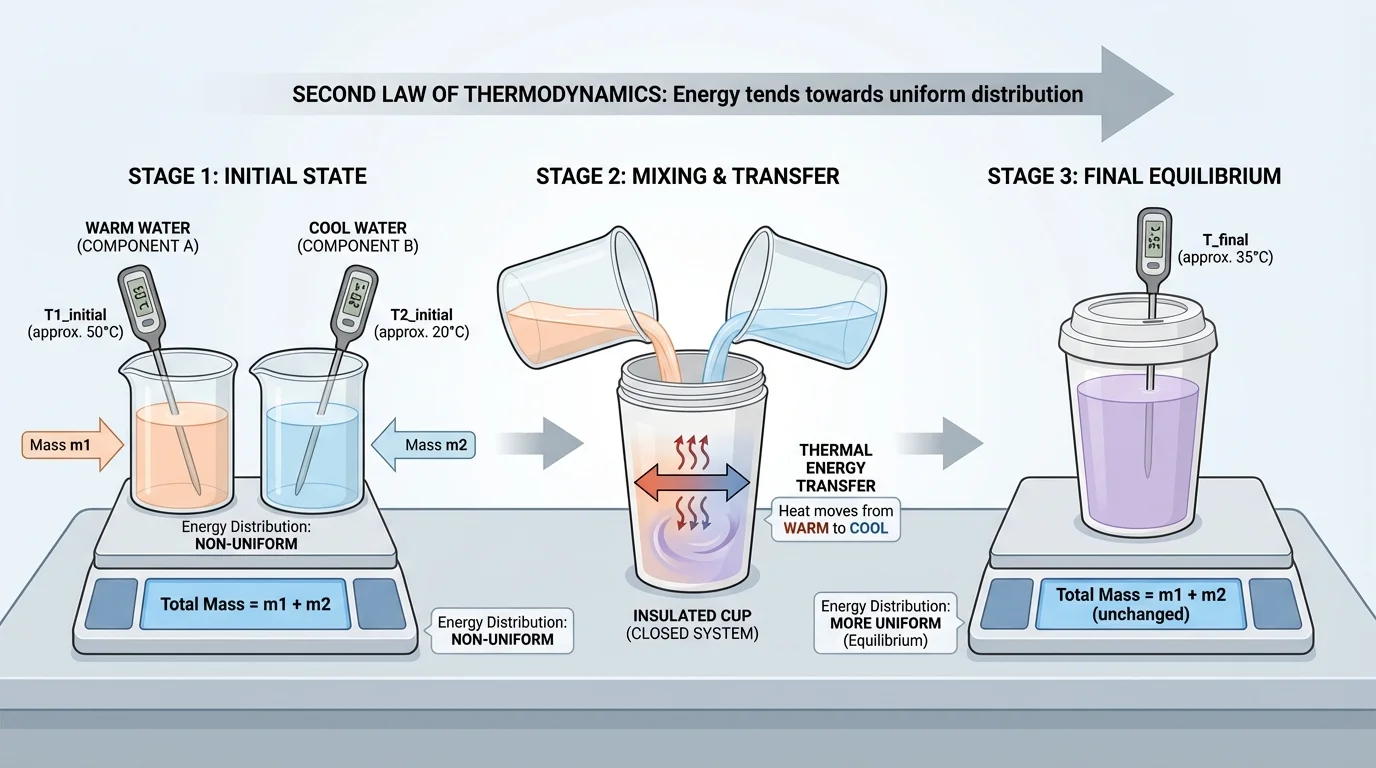
For example, if warm water and cool water are mixed in an insulated container, the warm water transfers energy to the cool water. If a warm metal block is placed in cooler water inside an insulated cup, the metal transfers energy to the water. In both cases, the final state is more uniform than the initial state.
The second law of thermodynamics is often stated in advanced ways, but here the key idea is practical: natural thermal processes tend to spread energy out. If one part of a system is much warmer than another, that uneven distribution does not stay that way on its own. It becomes more even.
This does not mean every particle has exactly the same energy. It means the overall distribution becomes more uniform, and the temperatures of the components move closer together. In many classroom investigations, the components eventually reach the same final temperature, which is evidence that the system has reached thermal equilibrium.
A common mistake is to think that "energy disappears" when a hot object cools. It does not. In a well-designed closed system, the energy lost by the warmer component is approximately equal to the energy gained by the cooler component. That is why this topic also reinforces the idea that energy cannot be created or destroyed.
"Energy cannot be created or destroyed, but it can change form and move between parts of a system."
The second law adds something important beyond conservation: conserved energy also becomes more spread out. The total amount remains, but its concentration changes. That is why a hot spot and a cold spot tend to even out rather than become more extreme.
[Figure 2] A strong investigation begins with a clear question. One useful question is: When two components with different initial temperatures are combined in a closed system, what evidence shows that thermal energy transfer leads to a more uniform energy distribution? A good classroom setup keeps the system simple enough to measure while limiting energy exchange with the surroundings.
Because assessment is limited to investigations based on materials and tools provided to students, the best designs use common classroom equipment such as insulated cups, lids, thermometers or temperature probes, balances, water, and small metal samples. These tools are enough to generate valid evidence.
You might investigate one of these setups:
In any design, identify the variables clearly. The independent variable is what you intentionally change, such as the initial temperature of one component or the mass of water used. The dependent variable is what you measure, such as the final equilibrium temperature or the temperature change over time. Controlled variables are factors kept the same, such as the container type, measurement intervals, and total mass.
Safety matters even in a simple thermal investigation. Use water that is warm, not dangerously hot. Handle metal objects carefully. Clean spills quickly, and make sure thermometers or probes are used properly.
A clear procedure might look like this: measure the masses of the two components, record each initial temperature, combine them quickly in an insulated container, cover the container, stir gently if appropriate, and record temperature at regular intervals until the temperature stabilizes. Repeating trials improves reliability.
Investigation design example: mixing warm and cool water
Step 1: Measure the mass of warm water and cool water.
For instance, use equal masses such as \(50 \textrm{ g}\) and \(50 \textrm{ g}\).
Step 2: Record initial temperatures.
Suppose the warm water is at \(40 \textrm{ ^\circ C}\) and the cool water is at \(20 \textrm{ ^\circ C}\).
Step 3: Combine them in an insulated cup, place the lid on, and measure temperature every \(30 \textrm{ s}\).
Step 4: Look for the temperature to level off near a final value.
If the final temperature settles near \(30 \textrm{ ^\circ C}\), that supports the claim that energy has been redistributed more uniformly.
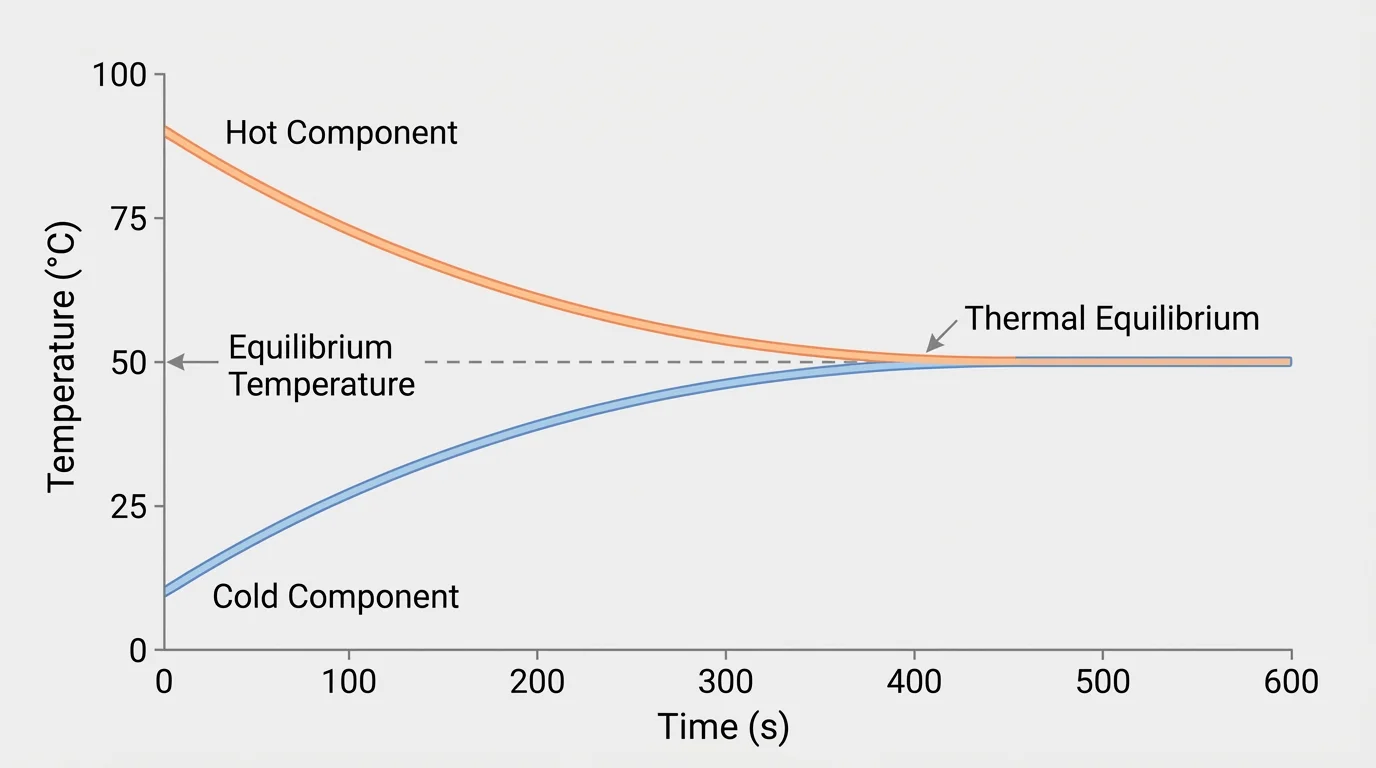
[Figure 3] Evidence in this investigation comes from data, not guesses. The strongest sign of a more uniform energy distribution is that the temperatures of the two components move toward the same final value over time. One curve decreases while the other increases until they meet or nearly meet.
Record data in a table with columns for time, temperature of component A, and temperature of component B if both can be measured separately, or initial temperatures and final mixture temperature if the components are combined fully. Regular measurement intervals help reveal the pattern clearly.
| Time | Warm component temperature | Cool component temperature |
|---|---|---|
| \(0 \textrm{ s}\) | \(40 \textrm{ ^\circ C}\) | \(20 \textrm{ ^\circ C}\) |
| \(30 \textrm{ s}\) | \(35 \textrm{ ^\circ C}\) | \(24 \textrm{ ^\circ C}\) |
| \(60 \textrm{ s}\) | \(32 \textrm{ ^\circ C}\) | \(27 \textrm{ ^\circ C}\) |
| \(90 \textrm{ s}\) | \(30.5 \textrm{ ^\circ C}\) | \(29.5 \textrm{ ^\circ C}\) |
| \(120 \textrm{ s}\) | \(30 \textrm{ ^\circ C}\) | \(30 \textrm{ ^\circ C}\) |
Table 1. Sample temperature data showing a warm and cool component approaching the same final temperature.
Graphing the data makes the trend easier to see. A temperature-versus-time graph reveals whether the components approach equilibrium smoothly and whether the final temperatures become equal or nearly equal.
Notice that the key evidence is not just that one component cools. The evidence must show a relationship: the warmer component loses thermal energy while the cooler component gains it. When viewed together, the data support a claim about transfer within the system.
Later, when you interpret data, the meeting point of the curves represents equilibrium, where the temperature difference has essentially vanished and the distribution is more uniform than it was at the start.
Remember that a fair test changes one major factor at a time and keeps other conditions as constant as possible. That principle is just as important in thermal investigations as it is in biology, chemistry, or engineering experiments.
Temperature evidence is often enough to show the pattern, but simple calculations strengthen the explanation. A useful model for thermal energy transfer is:
\[q = mc\Delta T\]
Here, \(q\) is thermal energy transferred, \(m\) is mass, \(c\) is specific heat capacity, and \(\Delta T\) is the temperature change. The specific heat capacity tells how much energy is needed to change the temperature of \(1 \textrm{ g}\) of a substance by \(1 \textrm{ ^\circ C}\).
For water, a common value is about \(4.18 \textrm{ J/(g \, ^\circ C)}\). Suppose \(50 \textrm{ g}\) of warm water cools from \(40 \textrm{ ^\circ C}\) to \(30 \textrm{ ^\circ C}\). Then \(\Delta T = 10 \textrm{ ^\circ C}\), so the energy lost is \(q = 50 \cdot 4.18 \cdot 10 = 2,090 \textrm{ J}\).
If \(50 \textrm{ g}\) of cool water warms from \(20 \textrm{ ^\circ C}\) to \(30 \textrm{ ^\circ C}\), then its energy gain is also \(q = 50 \cdot 4.18 \cdot 10 = 2,090 \textrm{ J}\). In the ideal case, the energy lost by one part equals the energy gained by the other part.
Numeric example: predicting final temperature for equal masses of water
Step 1: Identify the initial conditions.
Warm water: \(50 \textrm{ g}\) at \(40 \textrm{ ^\circ C}\). Cool water: \(50 \textrm{ g}\) at \(20 \textrm{ ^\circ C}\).
Step 2: Use symmetry.
Because the masses are equal and both substances are water, the final temperature is halfway between the two starting temperatures.
Step 3: Calculate the result.
\[T_f = \frac{40 + 20}{2} = 30 \textrm{ ^\circ C}\]
The final temperature of \(30 \textrm{ ^\circ C}\) matches the idea of a more uniform energy distribution.
Now consider unequal masses. If \(80 \textrm{ g}\) of water at \(40 \textrm{ ^\circ C}\) is mixed with \(20 \textrm{ g}\) of water at \(20 \textrm{ ^\circ C}\), the final temperature will be closer to \(40 \textrm{ ^\circ C}\) because the warmer portion contains more thermal energy. For equal substances, a weighted average works well:
\[T_f = \frac{m_1T_1 + m_2T_2}{m_1 + m_2}\]
Substituting gives \(T_f = \dfrac{80 \cdot 40 + 20 \cdot 20}{100} = \dfrac{3,200 + 400}{100} = 36 \textrm{ ^\circ C}\). Again, the final temperature lies between the initial temperatures, showing a move toward greater uniformity.
When different materials are involved, the final temperature depends on both mass and specific heat capacity. A metal object may change temperature quickly because many metals have lower specific heat capacities than water.
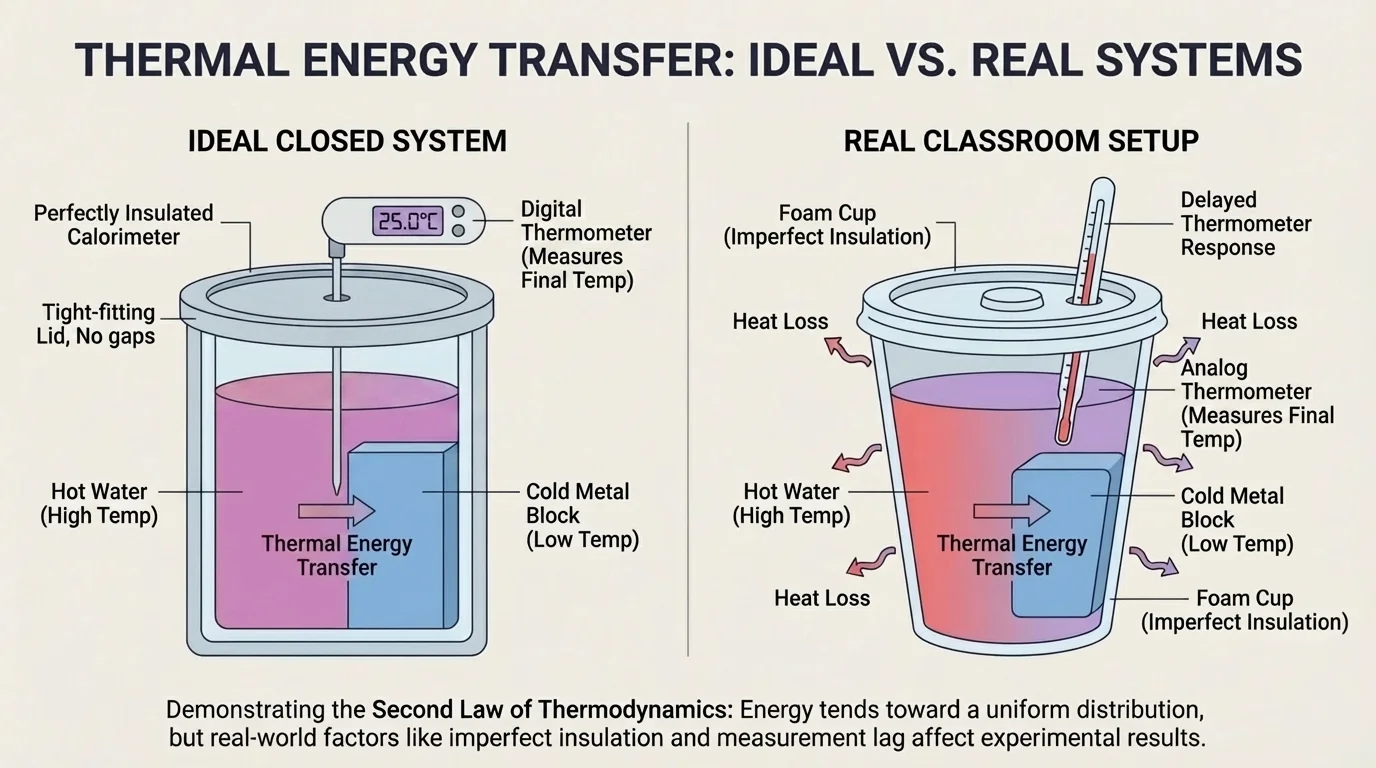
No classroom setup is perfectly isolated. Some thermal energy may escape to the surroundings through the cup walls, lid, air, or thermometer itself. That means the measured final temperature may differ slightly from the ideal prediction.
Another issue is measurement lag. A thermometer or probe may take time to reach the actual temperature of the substance. If students stir inconsistently, read scales late, or leave the lid off too long, the data can shift.
There is also the heat capacity of the container. If the cup or metal probe absorbs some energy, then not all of the transferred energy moves only between the two intended components. This is one reason real investigations rarely produce perfectly matching numbers.
Still, imperfect data can support a strong scientific claim if the overall pattern is clear. If repeated trials consistently show temperatures moving toward the same value, then the evidence supports the conclusion that thermal energy transfer produced a more uniform distribution.
Looking back at [Figure 1], the system boundary is the key idea for interpreting these errors. If energy leaks across that boundary, the system is less perfectly closed, and the final data will drift away from the ideal model.
Why "more uniform" is the right phrase
In real systems, equilibrium does not mean every microscopic particle has identical energy. Instead, it means the system has moved away from large-scale temperature differences. The evidence students collect is macroscopic: temperatures becoming equal or nearly equal, which indicates a more uniform distribution of energy among the components.
The same principle appears in engineering and daily life. Car radiators transfer thermal energy from hot engine components to cooler fluid and then to the air. Heat exchangers in buildings move energy between fluids so indoor spaces can be warmed or cooled efficiently. Medical cold packs and warm compresses work because energy naturally transfers from warmer regions to cooler ones.
Cooking gives another clear example. A cold pan placed on a hot stove warms because energy transfers from the hotter burner to the cooler metal. Food in the pan then warms as energy spreads further. The process continues until the temperatures become more uniform than they were at the start.
Climate control also depends on this principle. Insulation in homes does not create warmth. It slows down thermal energy transfer, reducing the rate at which energy spreads from warmer regions to cooler ones. Understanding that distinction helps explain why insulated containers keep drinks hot or cold longer.
Modern spacecraft and satellites must carefully manage thermal energy. In space, there is no air for convection, so engineers rely on conduction through materials and radiation to prevent some components from overheating while others become too cold.
Even in advanced technology, the core idea is the same one tested in a classroom cup: energy moves in ways that reduce temperature differences and create a more even distribution within the system.
A complete scientific explanation includes claim, evidence, and reasoning. A strong claim might say: When two components of different temperature are combined in a closed system, thermal energy transfers from the warmer component to the cooler component until the energy distribution becomes more uniform.
The evidence comes from measurements: initial temperatures, final temperatures, graphs, and repeated trials. The reasoning connects those measurements to particle motion, energy conservation, and the second law of thermodynamics.
For example, if warm water cools from \(40 \textrm{ ^\circ C}\) to \(30 \textrm{ ^\circ C}\) while cool water warms from \(20 \textrm{ ^\circ C}\) to \(30 \textrm{ ^\circ C}\), then the data show that the temperature difference decreased from \(20 \textrm{ ^\circ C}\) to \(0 \textrm{ ^\circ C}\). That is direct evidence of a more uniform distribution.
What makes this powerful is that the investigation does not rely on abstract theory alone. It uses materials students can handle, temperatures they can measure, and results they can repeat. That is exactly how science turns an invisible process into reliable evidence.