A hospital can use an antibiotic that kills millions of bacteria in a patient, yet a few days later the infection may return with bacteria that are harder to kill. That sounds almost like the medicine "caused" stronger bacteria, but the real explanation is more powerful and more scientific: variation already existed, and statistics help us see what happened. When a heritable trait gives some organisms even a small survival advantage, the numbers in a population can shift over time until that trait becomes much more common.
Evolution is often described in words, but it is supported by evidence in numbers. If a population contains organisms with different inherited traits, and one trait helps organisms with that trait survive or reproduce more successfully, then the proportion of organisms with that trait usually rises over generations. This pattern is the core of natural selection.
To support that explanation scientifically, biologists do not just say that one organism "did better." They collect data from many organisms, compare groups, calculate percentages, and look for trends over time. These tools make it possible to show that a trait is not merely present, but increasing in the population in a way that matches the idea of selection.
Natural selection is the process in which organisms with heritable traits that improve survival or reproduction tend to leave more offspring, causing those traits to become more common in a population over time.
Heritable trait means a characteristic that can be passed from parents to offspring.
Advantageous trait means a trait that increases success in a particular environment. A trait is not "good" in every setting; its advantage depends on conditions.
A key idea is that evolution acts on populations, not individuals. An individual organism may survive or die partly by chance, but if enough individuals with one trait survive and reproduce more often than others, the population changes. Statistics lets us detect that larger pattern.
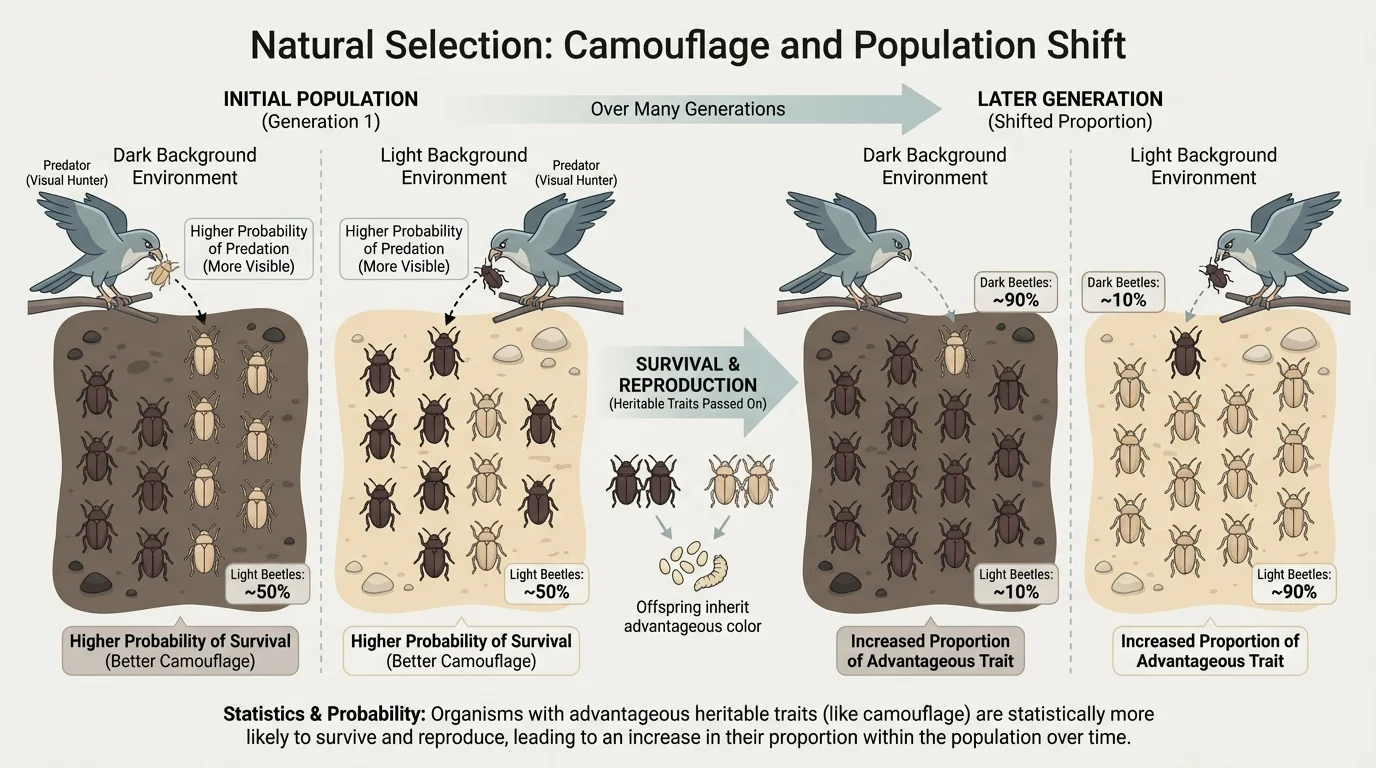
[Figure 1] Populations contain genetic variation, and this variation produces differences in traits such as coloration, body size, disease resistance, or tolerance to temperature. If predators can easily spot one color of insect but not another, the less visible insects are more likely to survive and reproduce. Over generations, this changes the proportion of each trait in the population.
For natural selection to occur, three conditions are especially important. First, individuals in a population differ in traits. Second, at least some of those traits are heritable. Third, those differences affect survival or reproduction. If all three are present, then an environmental pressure such as predation, disease, climate, or competition can lead to differential success.
Notice what this does not mean. It does not mean organisms try to change because they need to. It does not mean all members of the population change at once. Instead, organisms already differ, and the environment "filters" those differences. The organisms with the advantageous heritable trait leave, on average, more offspring.
That phrase "on average" is important. Biology at the population level is deeply statistical. Some organisms with the advantageous trait may still die, and some without it may still survive. But if the trait improves the odds, then repeated across many individuals and many generations, the population pattern becomes visible.
From earlier studies of genetics, recall that offspring inherit DNA from their parents. This is why a survival advantage can matter over generations: if the helpful trait is inherited, descendants are more likely to show it too.
Selection can affect either survival or reproduction. A trait may help an organism avoid predators, resist a disease, attract mates, or produce more offspring. Any of these can increase that trait's representation in the next generation.
Statistics turns observations into evidence. Suppose a field biologist counts two forms of a beetle population: green beetles and brown beetles. If a population initially contains \(40\) green beetles out of \(100\) total beetles, the proportion of green beetles is \(\dfrac{40}{100} = 0.40\), or \(40\%\). If several generations later there are \(70\) green beetles out of \(100\), the proportion is \(\dfrac{70}{100} = 0.70\), or \(70\%\). That increase supports the claim that green coloration may be advantageous under those conditions.
Biologists often compare counts, proportions, and percentages. A proportion is the part divided by the whole. A percentage is that proportion multiplied by \(100\). These are simple tools, but they are powerful because they let scientists compare populations of different sizes.
Why proportions matter more than raw counts
If one sample contains \(20\) dark mice out of \(40\) total and another contains \(50\) dark mice out of \(100\), both samples have the same proportion: \(\dfrac{20}{40} = 0.50\) and \(\dfrac{50}{100} = 0.50\). The raw counts differ, but the trait proportion in the observed population is the same.
Statistics also reminds us to think about sample size. If you observe only \(4\) organisms, chance can strongly affect what you see. If you observe \(400\), the pattern is more reliable. A scientist is much more confident in a consistent trend across a large sample than in a dramatic result from only a few individuals.
Repeated observations matter too. A single season may include unusual weather or random events. When the same pattern appears again and again, it becomes stronger evidence that the trait actually provides an advantage.
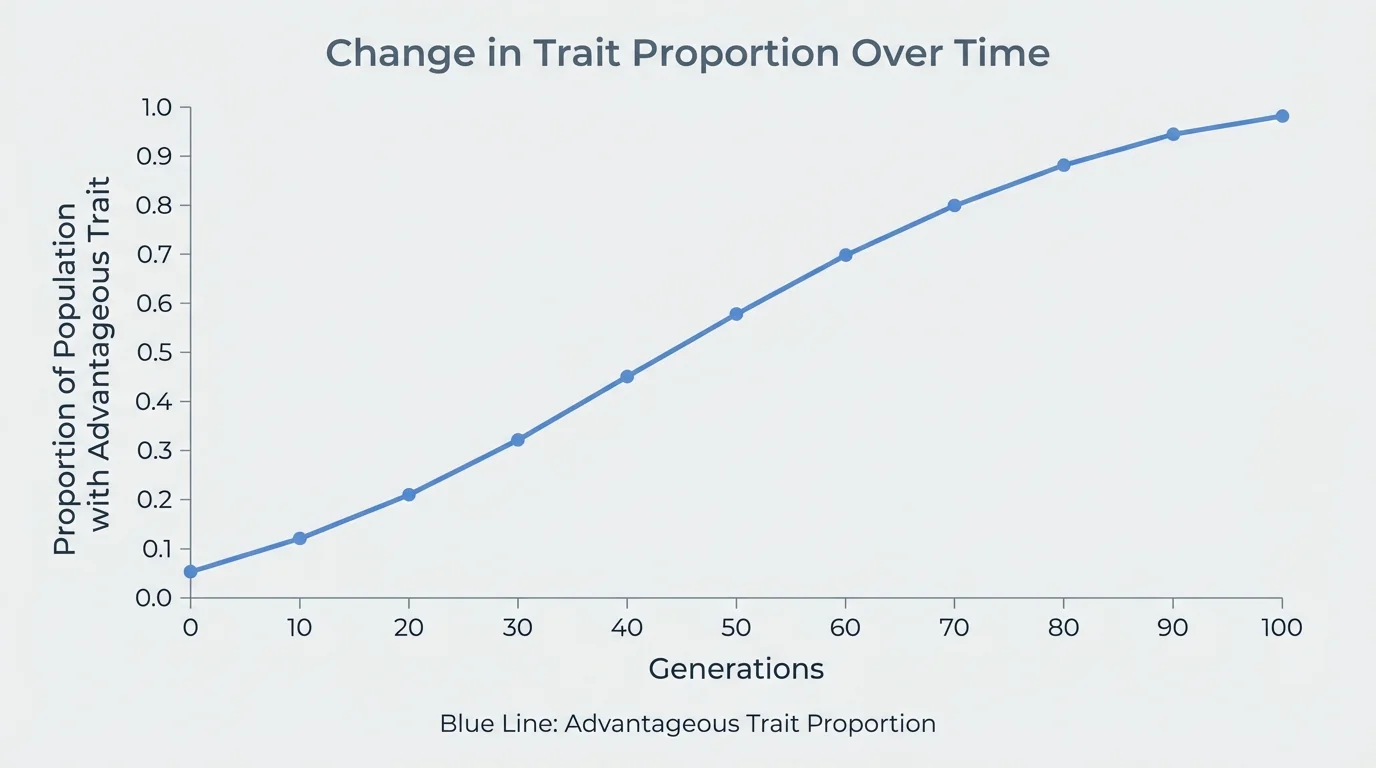
[Figure 2] Graphs are useful because they display change over time. When students examine biological data, the first question should be: what are the axes measuring? In natural selection studies, the horizontal axis often shows time or generations, while the vertical axis shows the proportion or percentage of a population with a certain trait.
If the graph rises, the trait is becoming more common. If it falls, the trait is becoming less common. If it stays about the same, there may be little selective advantage, or the environment may not be favoring one form over another. The pattern matters more than any single point.
Tables can also organize evidence clearly.
| Generation | Individuals with advantageous trait | Total individuals observed | Proportion | Percentage |
|---|---|---|---|---|
| \(1\) | \(18\) | \(60\) | \(\dfrac{18}{60} = 0.30\) | \(30\%\) |
| \(2\) | \(24\) | \(60\) | \(\dfrac{24}{60} = 0.40\) | \(40\%\) |
| \(3\) | \(33\) | \(60\) | \(\dfrac{33}{60} = 0.55\) | \(55\%\) |
| \(4\) | \(42\) | \(60\) | \(\dfrac{42}{60} = 0.70\) | \(70\%\) |
Table 1. A sample data set showing an advantageous heritable trait increasing in proportion over four generations.
This table does not prove the cause by itself, but it provides evidence consistent with natural selection. To make the explanation stronger, biologists connect the trend to a known environmental pressure and to a trait that can be inherited.
Some of the best evidence for evolution comes from tiny organisms with very short generation times. Bacteria can reproduce so quickly that scientists can observe population changes in the laboratory over days instead of centuries.
The upward trend in [Figure 2] represents a population-level pattern. It does not mean every individual with the trait survives or every individual without it dies. It means the trait gives a statistical advantage that becomes visible over many births, deaths, and reproductive events.
[Figure 3] The population of peppered moths in England provides a famous example. Moths with lighter coloring were harder to see on lichen-covered tree bark, while darker moths stood out more clearly. When industrial pollution darkened many tree trunks with soot, the visual background changed.
In the darker environment, dark moths were less visible to birds and therefore more likely to survive and reproduce. Light moths were eaten more often. Over time, observations showed that the proportion of dark moths rose in polluted areas. Later, as air quality improved and tree bark became lighter again, the trend shifted.
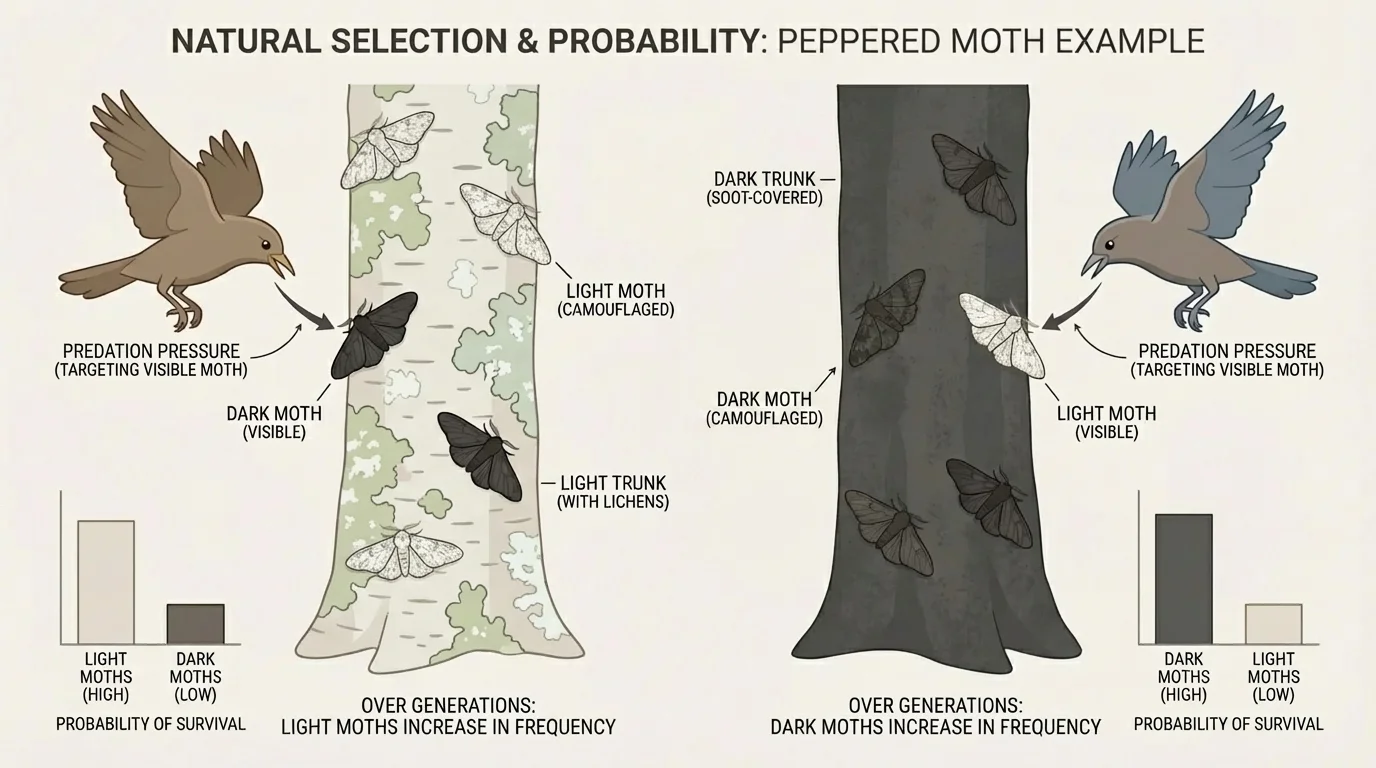
This case is important because it connects trait variation, environmental change, and measurable population trends. Scientists were not simply telling a story; they were comparing observed numbers of light and dark moths across time and location.
Worked case study with simple statistical analysis
Suppose researchers observed moths in one forest before and after major pollution.
Step 1: Record the counts.
Before pollution, dark moths numbered \(12\) out of \(100\). After pollution, dark moths numbered \(68\) out of \(100\).
Step 2: Convert counts to proportions and percentages.
Before pollution: \(\dfrac{12}{100} = 0.12 = 12\%\).
After pollution: \(\dfrac{68}{100} = 0.68 = 68\%\).
Step 3: Interpret the trend.
The dark form increased from \(12\%\) to \(68\%\). This supports the explanation that dark coloration became advantageous in the soot-darkened environment.
The data fit natural selection because the color difference is heritable and the environment changed which moths were easier for predators to find.
Like the beetles in [Figure 1], the moth example shows that camouflage can shift survival probabilities. A small difference in visibility, repeated across many predation events, can produce a large change in trait proportion.
[Figure 4] Antibiotic resistance is one of the clearest modern examples of resistance evolving in a population. A bacterial population may already include a few individuals with heritable traits that help them survive exposure to a drug. The antibiotic does not create the need-based change; instead, it kills susceptible bacteria and leaves resistant ones more likely to survive and reproduce.
After treatment, the surviving bacteria represent a larger proportion of resistant individuals than before. If those survivors multiply, the next bacterial generation contains more resistant bacteria. This is a direct example of selection changing trait proportions in a population.
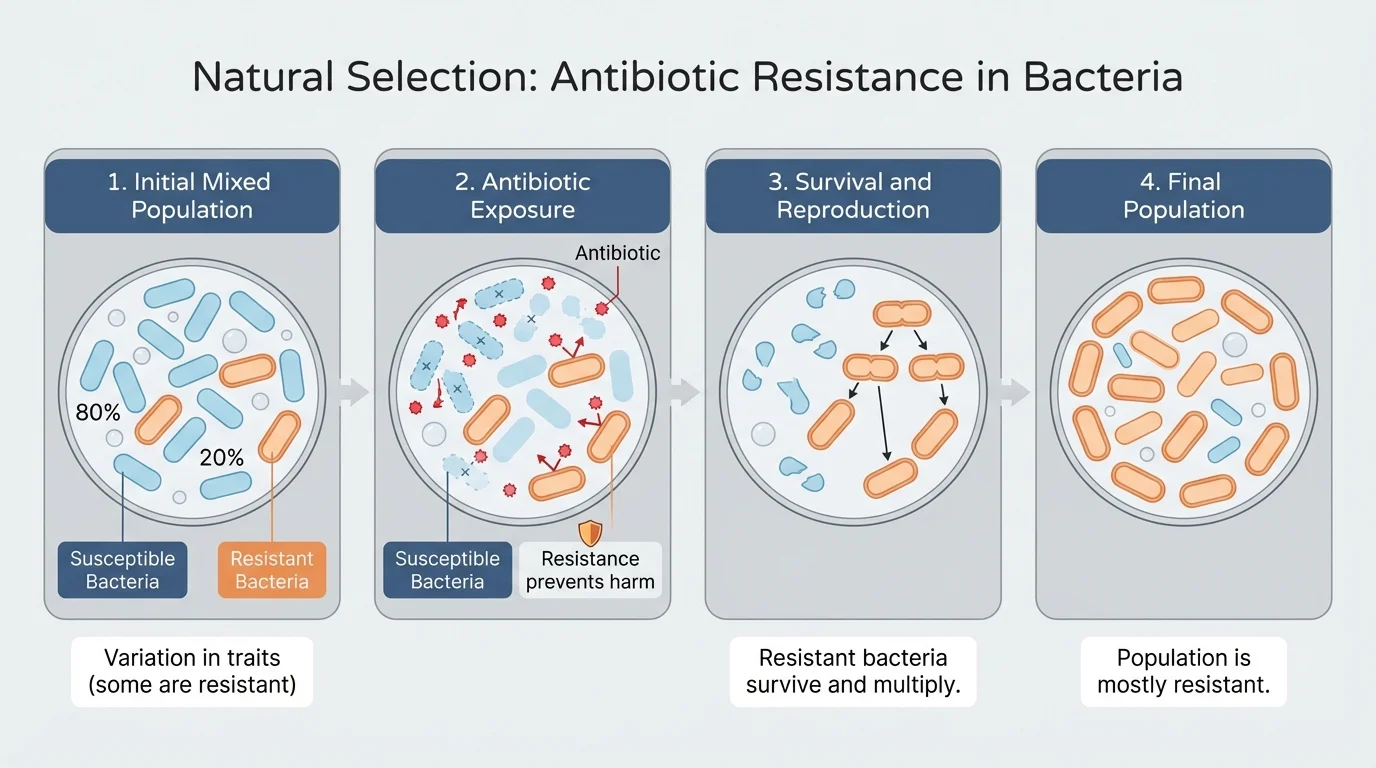
Probability is central here. Before treatment, a resistant bacterium may be rare. But if the antibiotic creates an environment where susceptible bacteria have a very low chance of survival and resistant bacteria have a much higher chance, the statistical outcome is predictable at the population level even though the fate of each individual cell is not.
Numerical example with bacteria
A culture begins with \(1{,}000\) bacteria: \(950\) are susceptible and \(50\) are resistant.
Step 1: Find the starting percentage of resistant bacteria.
\(\dfrac{50}{1{,}000} = 0.05 = 5\%\).
Step 2: Apply a simplified survival scenario.
Suppose the antibiotic kills all \(950\) susceptible bacteria, but the \(50\) resistant bacteria survive.
Step 3: Interpret the result.
Immediately after treatment, the surviving population is \(50\) resistant bacteria out of \(50\) total survivors, so resistance now makes up \(\dfrac{50}{50} = 1.00 = 100\%\) of the surviving population.
This does not mean resistance suddenly appeared. It means the environment changed which bacteria survived.
The same logic helps explain why doctors emphasize taking antibiotics exactly as prescribed. Incomplete treatment can leave more survivors and increase the chance that resistant bacteria become common.
Rock pocket mice live in habitats with different ground colors, including light desert rock and dark volcanic rock. Mice with fur color that matches the ground are less visible to predators such as owls and hawks. In dark rocky habitats, dark fur can be advantageous; in light habitats, light fur can be advantageous.
When scientists compare the proportions of dark and light mice in these habitats, they find patterns consistent with natural selection. The environment does not "prefer" a color in any abstract sense. Instead, camouflage affects the probability of being eaten, and that affects how many offspring different mice leave behind.
This example is especially useful because it shows that an advantageous trait depends on context. A dark coat may be helpful in one habitat and harmful in another. Advantage is always tied to the environment.
A probability is the likelihood that a particular event will happen. In natural selection, probability does not predict the fate of one specific organism with certainty. It predicts patterns when many organisms are considered together.
Suppose in one environment a light mouse has a \(0.70\) chance of surviving to reproduce, while a dark mouse has a \(0.30\) chance. That does not guarantee that every light mouse survives or every dark mouse dies. But across many mice, light fur is expected to become more common because it is associated with greater reproductive success.
Individual chance versus population trend
Chance matters for individuals, but large populations reveal patterns. If a coin is fair, one flip could be heads or tails. But many flips usually approach a \(50\%\) to \(50\%\) pattern. Natural selection works in a similar way: individual outcomes vary, yet trait-related differences in survival or reproduction appear statistically across populations.
This is why scientists use the phrase tend to. Organisms with an advantageous heritable trait tend to increase in proportion to organisms lacking that trait. The statement is not absolute for every generation or every individual, but it is strongly supported by data when the trait consistently improves success.
The graph in [Figure 2] and the bacterial sequence in [Figure 4] both show this idea clearly: probability shapes outcomes one event at a time, while statistics reveals the long-term direction of change.
Good scientific explanations are careful. A change in proportion does not automatically prove natural selection. Scientists ask whether the trait is heritable, whether the environment creates a plausible advantage, whether the sample is large enough, and whether the trend is repeated across observations.
They also avoid confusing random events with directional change. A storm, fire, or accident may suddenly reduce a population, but that does not necessarily mean one trait was advantageous. Natural selection specifically involves non-random differences in survival or reproduction linked to heritable traits.
Another important caution is that this level of analysis does not require calculating allele frequencies. You can support explanations using basic counts, proportions, percentages, and graphs without going into more advanced population genetics.
"Nothing in biology makes sense except in the light of evolution."
— Theodosius Dobzhansky
What makes evolution especially convincing is that the same reasoning works across many examples: insects on leaves, moths on trees, mice on lava rock, and bacteria facing antibiotics. Different organisms, same statistical logic.
In medicine, understanding natural selection helps researchers track drug resistance in bacteria, viruses, and cancer cells. If resistant forms increase in proportion after treatment, scientists can revise treatment strategies and monitor how quickly resistance spreads.
In agriculture, farmers and biologists study pesticide resistance in insect populations and herbicide resistance in weeds. If a few individuals survive treatment because of heritable traits, repeated use of the same chemical can increase the proportion of resistant organisms over time.
In conservation biology, population data can reveal whether environmental changes favor certain traits over others. This matters when habitats warm, dry out, become polluted, or are fragmented by human activity. Statistical patterns in trait frequencies can provide early evidence that a population is under strong selective pressure.
The visual comparisons in [Figure 3] and [Figure 1] connect directly to these modern problems: when environmental conditions change, what was once neutral may become advantageous, and populations may shift accordingly.