If a doctor tracks your heart rate, blood pressure, and temperature over time, that doctor can spot a trend before you feel seriously sick. Climate scientists do something similar for Earth. They do not make predictions by guessing; they use measurements collected over decades to centuries, compare those measurements with physical laws, and test computer models against the real world. That is why a climate forecast is best understood as an evidence-based scientific conclusion, not an opinion.
Climate affects food production, water supplies, coastlines, ecosystems, and where people can safely live. For students today, climate forecasting is not about some distant future disconnected from everyday life. It connects to stronger heat waves in cities, changing snowpack that supplies drinking water, rising costs for coastal protection, and shifting habitats for plants and animals. Understanding how these forecasts are made helps you judge evidence and separate trustworthy science from unsupported claims.
Climate is the long-term pattern of weather in a region or across the globe. Weather asks what happens today or this week; climate asks what happens over many years. A rainy day does not prove climate change, and a cold day does not disprove it. Scientists look for long-term patterns, averages, and rates of change.
Climate change is a long-term shift in average climate conditions, such as temperature, precipitation, or sea level.
Forecast in climate science means a scientifically based projection of future conditions using data, physical laws, and models.
Rate of change describes how fast a quantity changes over time, such as temperature increasing by a certain number of degrees per decade.
One key idea runs through the entire topic: Earth is a connected system. Changes in the atmosphere affect the oceans; changes in the oceans affect ice; changes in ice affect sea level; and all of these changes influence living things and human societies.
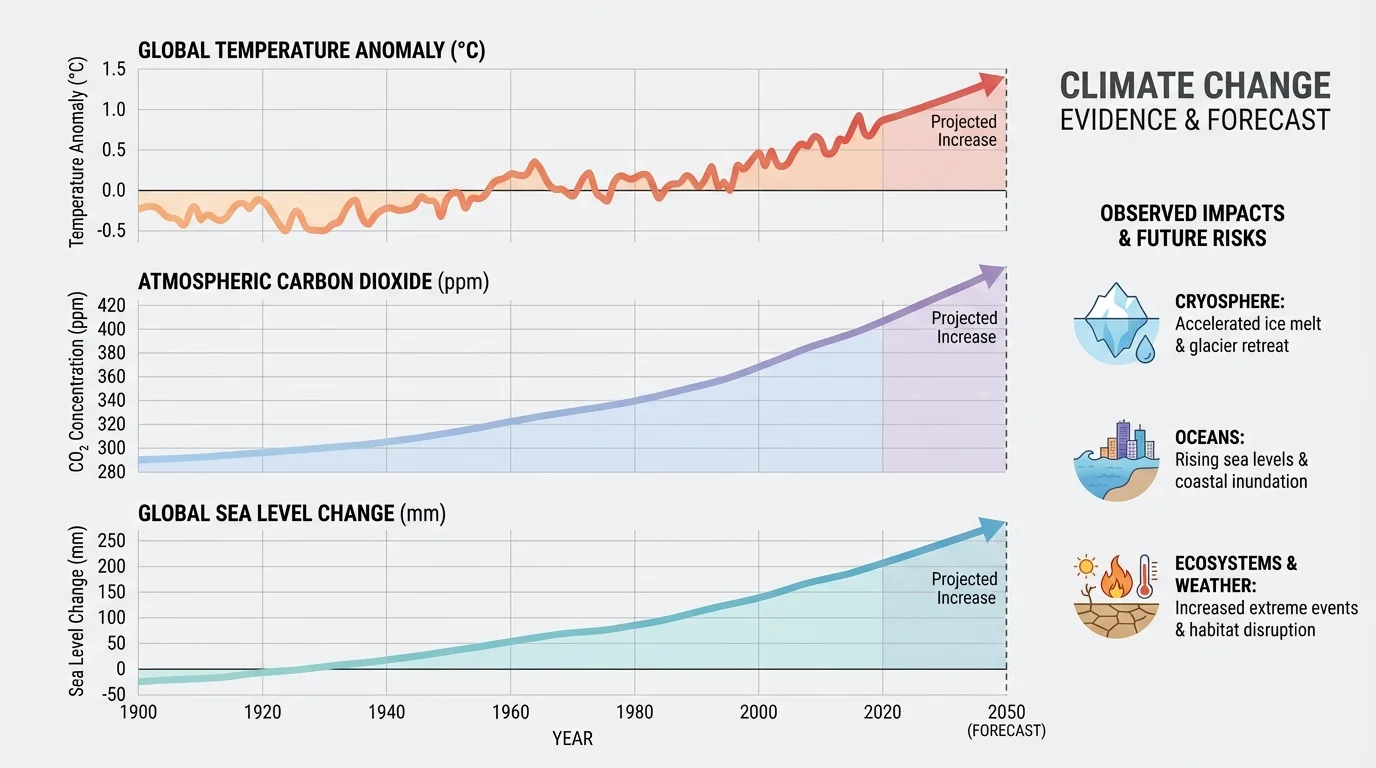
Scientists rely on geoscience data from many sources, and the power of climate science comes from comparing those independent lines of evidence, as [Figure 1] shows. Surface thermometers record air temperature. Ocean instruments measure water temperature. Tide gauges and satellites track sea level. Ice cores preserve clues about past atmospheres. Satellites monitor cloud cover, ice extent, and energy entering and leaving Earth. Atmospheric observatories measure gases such as greenhouse gases, including carbon dioxide, represented chemically as \(\textrm{CO}_2\).
No single dataset tells the whole story. A thermometer record alone could be questioned if it stood by itself. But when land temperatures, ocean temperatures, shrinking ice, and rising sea level all point in the same direction, the evidence becomes much stronger. Scientists call this convergence of evidence. Independent measurements agree that Earth has been warming in recent decades.
Some records go back only a few decades, while others stretch much farther. Ice cores drilled from Greenland and Antarctica trap tiny bubbles of ancient air. Those bubbles let scientists estimate past concentrations of gases such as \(\textrm{CO}_2\). Tree rings, lake sediments, and coral growth layers also provide information about earlier climate conditions. These records do not replace modern instruments, but they help scientists compare current change with past natural variations.
Measurements can also be expressed as rates. Suppose the average global sea level rose \(8 \textrm{ cm}\) over \(20\) years. The average rate would be \(\dfrac{8 \textrm{ cm}}{20 \textrm{ yr}} = 0.4 \textrm{ cm/yr}\). If later measurements show the rate rising to \(0.5 \textrm{ cm/yr}\), scientists infer that sea-level rise is accelerating. This is one way climate science turns observations into evidence-based forecasts.
Ice cores can preserve climate information from hundreds of thousands of years ago. That means scientists can compare today's atmospheric composition with ancient atmospheres rather than relying only on modern records.
Because climate is measured over long periods, scientists often average data over decades. This reduces short-term ups and downs caused by volcanic eruptions, ocean cycles, or year-to-year weather differences.
Climate change is not just an atmosphere problem. It involves the atmosphere, hydrosphere, cryosphere, biosphere, and geosphere. These systems constantly exchange energy and matter. For example, the ocean absorbs heat from the air, ice reflects sunlight, plants take in \(\textrm{CO}_2\), and soils store carbon. A change in one part of the system can trigger changes elsewhere.
The atmosphere contains gases that trap some outgoing heat. The hydrosphere includes oceans, lakes, rivers, and groundwater. The cryosphere includes glaciers, sea ice, and ice sheets. The biosphere includes living organisms. The geosphere includes rocks, soils, and landforms. When climate scientists make forecasts, they must consider these interactions instead of treating Earth as separate pieces.
Feedbacks in the climate system
A feedback happens when a change causes effects that either amplify or reduce the original change. For example, warming can melt reflective ice, exposing darker ocean water that absorbs more sunlight. That leads to more warming, which is a positive feedback. Other processes can slow change, acting as negative feedbacks. Global climate models include many of these interactions.
This systems view matters because future impacts are rarely caused by one isolated change. A warmer atmosphere can warm the ocean, and a warmer ocean can contribute to sea-level rise. That means climate forecasts are really forecasts about linked Earth systems.
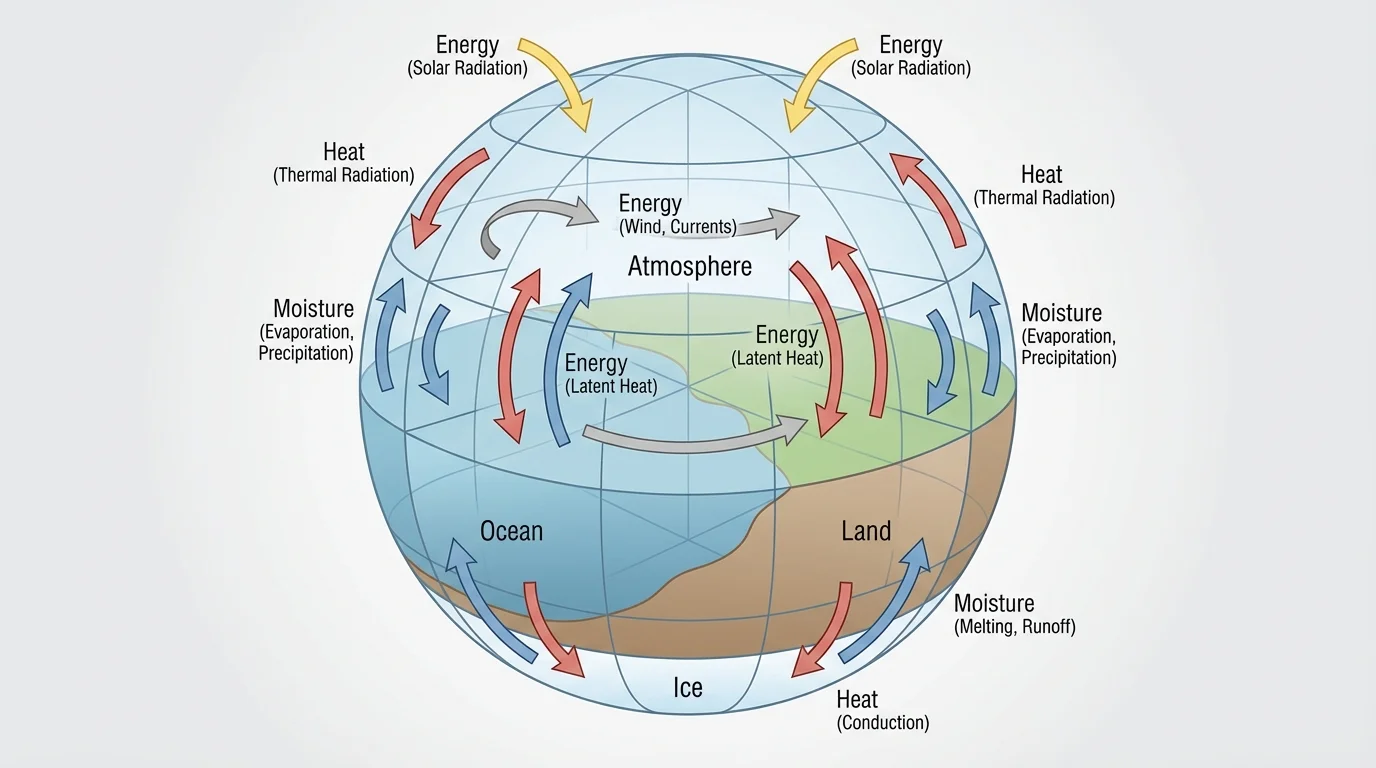
A global climate model is a computer-based representation of Earth's climate system that uses physical laws to simulate how energy and matter move, as [Figure 2] illustrates. Scientists divide Earth into many three-dimensional sections called grid cells. For each cell, the model calculates changes in temperature, pressure, wind, moisture, and energy transfer over time.
These models are based on principles such as conservation of energy, fluid motion, and radiation balance. Incoming solar energy warms Earth, while Earth also emits energy back to space. If more energy is retained than released, the planet warms. Greenhouse gases affect this energy balance by absorbing and re-radiating some outgoing infrared energy.
Models need input data. These include atmospheric gas concentrations, solar energy, volcanic particles, land cover, ocean conditions, and ice cover. The model then calculates how these variables interact. Because the climate system is so complex, no model captures every detail perfectly. Instead, scientists test many models and compare their results with actual observations.
Global climate models have improved because computers have become more powerful and because scientists have better data. Smaller grid cells allow more detail. Better satellite observations improve model starting points and testing. More accurate representation of clouds, ocean circulation, and ice processes makes forecasts stronger than they were decades ago.
This does not mean models are magic. They are tools. Their value comes from whether they reproduce known climate patterns and whether their future projections are consistent with established physics and observed trends. When multiple models give similar results under similar conditions, confidence increases.
Computer models do not replace observations. They depend on observations for inputs, testing, and improvement. The strongest climate conclusions come from agreement between measured data and model results.
Later in the lesson, the connection between linked Earth systems becomes more important again, because the exchanges shown in [Figure 2] help explain why warming air can eventually raise sea level through ocean warming and land-ice melt.
Scientists analyzing climate data ask several questions. Is there a long-term trend? How large is the change? How fast is it happening? How certain are we? These questions help turn observations into an evidence-based forecast.
A trend is the overall direction of change in data over time. If average temperature values generally rise over many decades, the trend is upward even if individual years vary. The uncertainty in a forecast describes the range of values that are scientifically plausible based on data and model limits. Uncertainty does not mean scientists know nothing; it means they state how precise their estimate is.
Suppose a region warms by \(1.2^{\circ}\textrm{C}\) over \(40\) years. The average rate of warming is \(\dfrac{1.2^{\circ}\textrm{C}}{40 \textrm{ yr}} = 0.03^{\circ}\textrm{C/yr}\). This can also be written as \(0.3^{\circ}\textrm{C}\) per decade. A rate gives more useful information than a simple statement that warming happened, because it tells how quickly conditions are changing.
Analyzing a simple climate trend
A set of sea-level measurements shows an increase from \(10 \textrm{ cm}\) above a baseline to \(16 \textrm{ cm}\) above the same baseline over \(15\) years.
Step 1: Find the total change.
The total increase is \(16 - 10 = 6 \textrm{ cm}\).
Step 2: Divide by time.
The rate is \(\dfrac{6 \textrm{ cm}}{15 \textrm{ yr}} = 0.4 \textrm{ cm/yr}\).
Step 3: Interpret the meaning.
If this average rate continued, another \(10\) years would add about \(0.4 \times 10 = 4 \textrm{ cm}\).
This is a simple forecast based on a trend. Real climate forecasts use much larger datasets and more advanced models, but the logic is similar.
Scientists also compare observations with model outputs. If observed warming and sea-level rise match the general pattern produced by models that include human greenhouse gas emissions, that supports the conclusion that human activities are contributing strongly to current climate change.
To stay within one detailed example of climate change and its associated impacts, we will focus on sea-level rise linked to current global warming. This example combines several lines of evidence and gives a clear case where observations and models support a future forecast, as [Figure 3] shows. Global warming raises sea level mainly in two ways: warmer ocean water expands, and melting land ice adds water to the oceans.
The first process is called thermal expansion. When water warms, its volume increases. Even a small expansion becomes important because the oceans contain enormous amounts of water. The second process involves glaciers and ice sheets on land. When land ice melts, the meltwater flows to the ocean, increasing total ocean volume.
Observed data show that global sea level is rising. Tide gauges provide long-term coastal records, while satellites give global measurements. At the same time, temperature records show a warming ocean and atmosphere. Global climate models that include increasing greenhouse gases also project continued warming, which supports continued sea-level rise in the future.
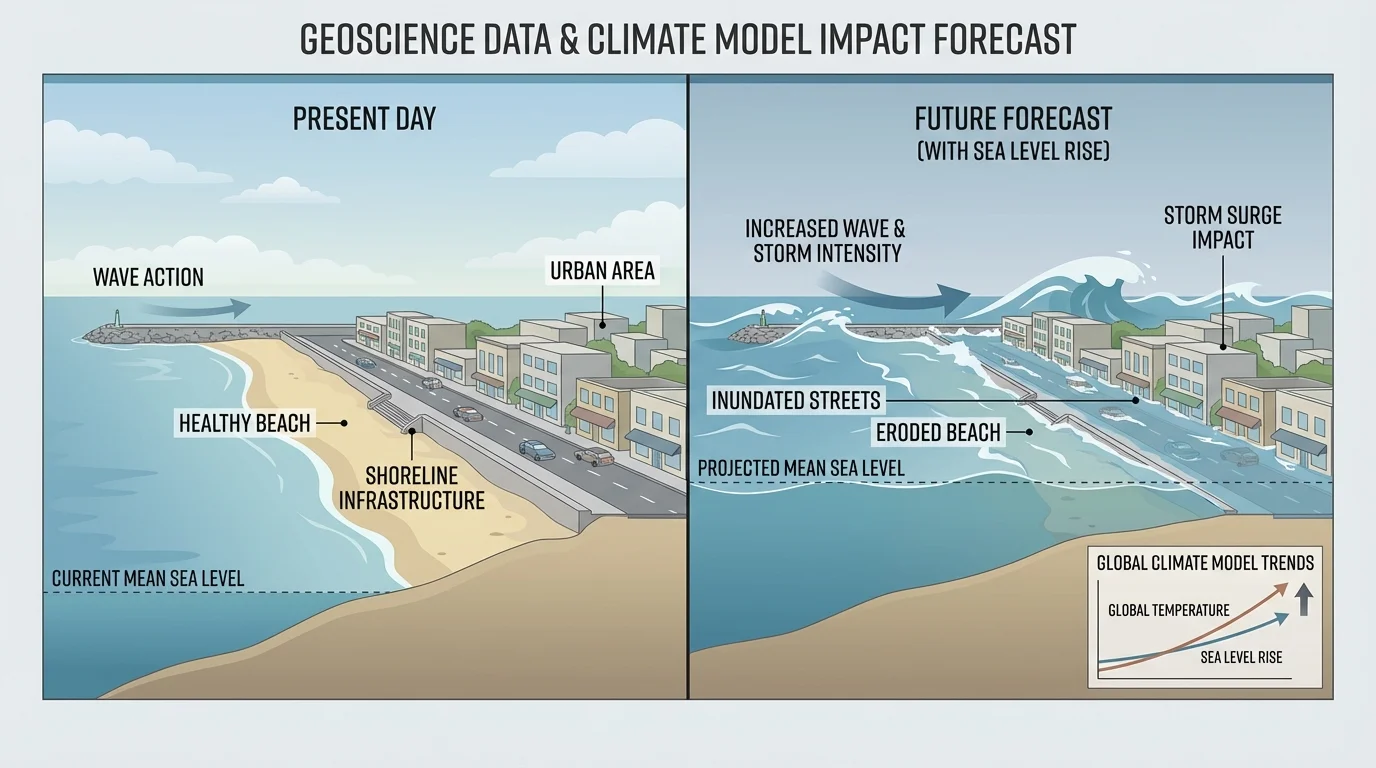
An evidence-based forecast can therefore be stated clearly: if current warming trends continue, global sea level will keep rising, and many coastal regions will face greater flooding risk in the future. This is not based on one storm or one beach photo. It is based on measured sea-level trends, measured warming, physical understanding of thermal expansion and ice melt, and repeated model results.
The impacts extend across Earth's systems. In the geosphere, coastlines can erode faster. In the hydrosphere, saltwater can move farther into estuaries and some groundwater systems. In the biosphere, coastal wetlands may be submerged or forced inland if space is available. Human systems are affected too: roads, ports, homes, and wastewater systems near the coast become more vulnerable.
Forecasting from a current rate
Suppose a coastal monitoring record shows sea level rising at an average of \(0.45 \textrm{ cm/yr}\), and a city planner wants a rough estimate for the next \(20\) years if the rate stayed the same.
Step 1: Identify the rate and time.
Rate: \(0.45 \textrm{ cm/yr}\). Time: \(20 \textrm{ yr}\).
Step 2: Multiply rate by time.
Projected rise is \(0.45 \times 20 = 9 \textrm{ cm}\).
Step 3: Explain the limitation.
This estimate assumes the rate stays constant. Real forecasts may differ because rates can increase or decrease, so scientists use models and uncertainty ranges.
A simple trend estimate gives \(9 \textrm{ cm}\), but professional forecasts include more processes than this basic calculation.
Later effects build on one another. A higher average sea level means storm surge starts from a higher baseline. That means a storm of the same strength can cause worse flooding than it did in the past. The coastal vulnerability shown in [Figure 3] is one reason sea-level rise matters even before land is permanently underwater.
Human activities influence climate mainly by changing the composition of the atmosphere. Burning fossil fuels transfers carbon that was stored underground into the atmosphere as \(\textrm{CO}_2\). Deforestation can reduce the number of plants available to absorb some atmospheric carbon. Agriculture and industry also add other greenhouse gases.
These gases do not create energy, but they change how energy moves through the atmosphere. More greenhouse gases generally mean more heat retained in the climate system. Climate models can test different future scenarios by changing greenhouse gas concentrations and observing how temperatures, ice, and sea level respond.
Why human influence appears in climate forecasts
If models include only natural factors such as volcanic activity and changes in solar energy, they do not fully reproduce the warming observed in recent decades. When models include human-caused increases in greenhouse gases, they match observed long-term warming much better. That agreement strengthens the evidence that human activities are a major driver of current climate change.
This is one of the most important uses of climate models: they let scientists test explanations, not just produce numbers. A model is useful because it asks, in effect, "What happens if this factor changes?" and then compares the result with the real world.
Scientists improve climate forecasts the same way engineers improve designs: by testing, measuring errors, and revising models. New satellites provide better data. Ocean instruments reach greater depths. Ice measurements become more detailed. Computing power increases. As each of these improves, models become better at representing Earth's systems.
Still, some uncertainty remains. Clouds are complex. Regional forecasts are often harder than global ones. Human choices about energy use and land use also affect future conditions. But uncertainty is not a weakness unique to climate science. In every field, from medicine to economics, better evidence narrows uncertainty without removing it entirely.
"The measure of a scientific idea is not whether it is perfectly certain, but whether it is supported by evidence and survives testing."
That principle explains why climate forecasts are taken seriously. Scientists do not claim exact certainty about every local outcome. They show what the evidence strongly supports, what range of outcomes is plausible, and which impacts are likely if current trends continue.
Evidence-based climate forecasts help societies plan ahead. Coastal communities may raise roads, redesign drainage systems, restore wetlands, or change building rules in areas vulnerable to sea-level rise. These choices depend on scientific forecasts, not on waiting until damage is severe.
For students, the most important skill is learning how to evaluate a scientific claim. Ask what data were used, whether multiple datasets agree, whether the explanation follows physical laws, whether models were tested against observations, and whether uncertainty was reported honestly. Those are the habits of evidence-based reasoning.
Climate science is powerful because it combines observation, mathematics, computing, and systems thinking. By analyzing geoscience data and comparing those data with global climate model results, scientists can make a justified forecast: the current climate is warming, sea level is rising, and continued warming is expected to increase coastal impacts in the future.