A single graph can convey information more quickly than a paragraph. A company's profit can rise in a straight-line pattern, a basketball shot can arc in a parabola, and the height of a thrown object can climb to a highest point before falling back down. When you graph functions, you turn symbols into something you can see, and features such as where the graph crosses an axis or where it reaches its highest or lowest point become much easier to understand.
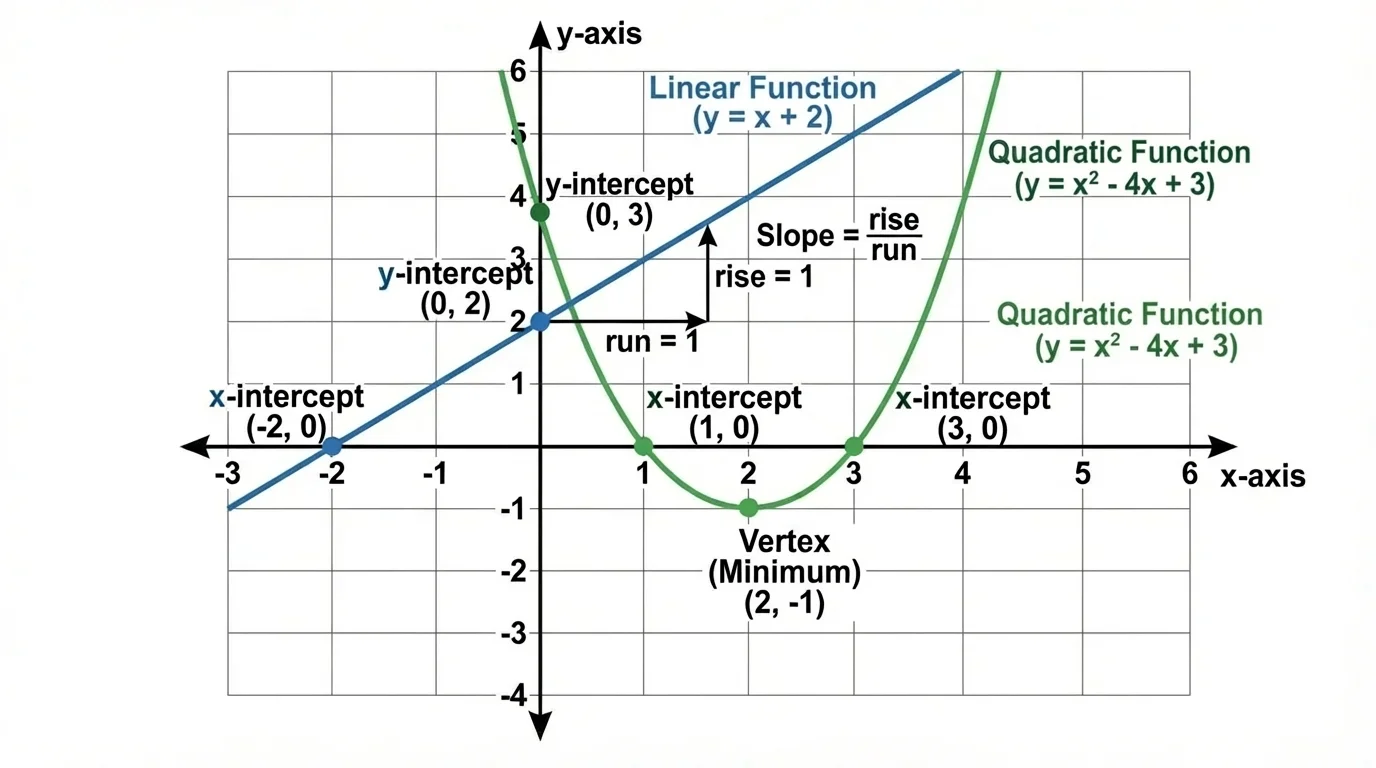
[Figure 1] In algebra, graphs help us move between different representations of the same idea: an equation, a table of values, and a picture on the coordinate plane. For linear and quadratic functions, these representations are especially important because they reveal patterns in change, symmetry, and turning points.
A function describes how one quantity depends on another. If you know the equation, you can calculate outputs. If you know the graph, you can often estimate important values quickly. For example, a graph can show whether a quantity is increasing, decreasing, or reaching a peak. That is why graphing is not just a drawing skill. It is a way to interpret mathematical behavior.
For this topic, the most important features are intercepts, the points where a graph crosses the axes, and the highest or lowest points of quadratic graphs. Linear functions do not turn, so they do not have maxima or minima over all real numbers. Quadratic functions do turn, and that turning point is one of their most important features.
On the coordinate plane, the x-axis is horizontal and the y-axis is vertical. A point is written as \(x, y\). The y-intercept occurs where \(x = 0\), and the x-intercept occurs where \(y = 0\).
Before graphing, it helps to ask: What type of function is this? A linear function has a constant rate of change. A quadratic has a changing rate of change and creates a curved graph called a parabola.
A linear function produces a straight-line graph. A common form is \(y = mx + b\), where \(m\) is the slope and \(b\) is the \(y\)-intercept. The slope tells how steep the line is and whether it rises or falls from left to right.
If \(m > 0\), the line rises. If \(m < 0\), the line falls. If \(m = 0\), the graph is horizontal. The value of \(b\) tells where the line crosses the \(y\)-axis, because when \(x = 0\), the equation becomes \(y = b\).
To find the y-intercept of a linear function, substitute \(x = 0\). To find the x-intercept, substitute \(y = 0\) and solve for \(x\). Sometimes a line has no \(x\)-intercept, such as a horizontal line above or below the \(x\)-axis.
When graphing a line by hand, the easiest method is often to plot the \(y\)-intercept first and then use the slope. For example, if the slope is \(\dfrac{2}{3}\), start at the intercept, move up \(2\) units, and right \(3\) units to find another point. Then draw the line through the points.
Slope is the rate of change of a linear function. It can be calculated by \(m = \dfrac{y_2 - y_1}{x_2 - x_1}\). Intercepts are the points where a graph crosses the axes: the \(x\)-intercept has \(y = 0\), and the \(y\)-intercept has \(x = 0\).
Linear graphs are powerful because they model constant change. If a tank is filled at a steady rate or a worker earns the same amount per hour, a linear function is often a good model.
[Figure 2] A quadratic function has the general form \(y = ax^2 + bx + c\), and its graph is a parabola. Unlike a line, a parabola bends. It has a turning point called the vertex, which is the highest or lowest point on the graph.
If \(a > 0\), the parabola opens upward, so the vertex is a minimum. If \(a < 0\), it opens downward, so the vertex is a maximum. This one coefficient tells you a lot about the graph's overall shape.
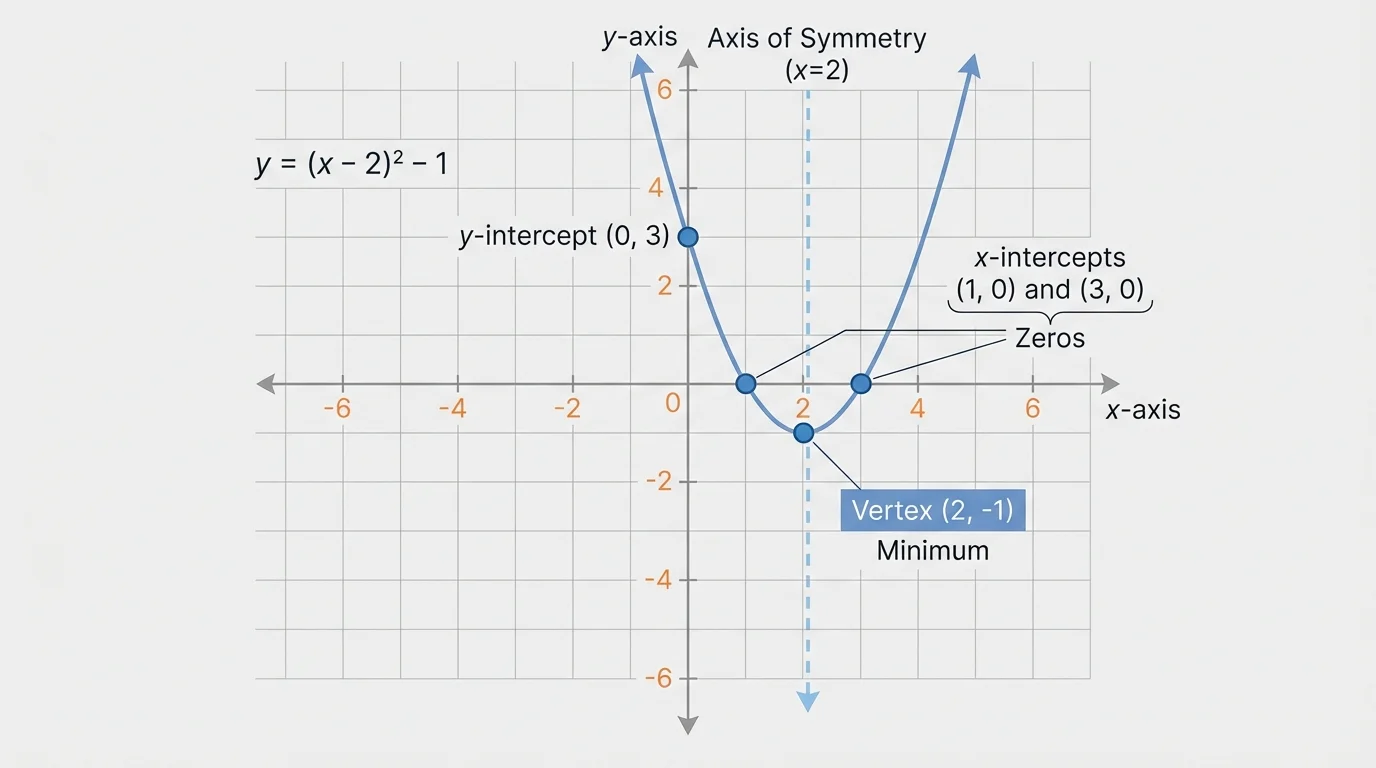
Every parabola has an axis of symmetry, a vertical line that passes through the vertex and splits the graph into two mirror-image halves. For the quadratic \(y = ax^2 + bx + c\), the axis of symmetry is
\[x = -\frac{b}{2a}\]
Once you know this \(x\)-value, you can substitute it into the function to find the \(y\)-value of the vertex.
The \(y\)-intercept of a quadratic is easy to find: let \(x = 0\), which gives \(y = c\). The \(x\)-intercepts are found by solving \(ax^2 + bx + c = 0\). A quadratic can have two \(x\)-intercepts, one \(x\)-intercept, or no real \(x\)-intercepts, depending on whether the parabola crosses, touches, or misses the \(x\)-axis.
Maximum and minimum values come from the vertex of a quadratic function. If the parabola opens downward, the vertex gives the greatest output value of the function. If it opens upward, the vertex gives the least output value. In real situations, this can represent the highest height of a projectile, the maximum profit, or the minimum material needed for a design.
Quadratic functions can be written in different forms, and each form highlights different features. In standard form, \(y = ax^2 + bx + c\), the \(y\)-intercept is easy to read. In vertex form, \(y = a(x - h)^2 + k\), the vertex is \((h, k)\). In factored form, \(y = a(x - r_1)(x - r_2)\), the \(x\)-intercepts are \((r_1, 0)\) and \((r_2, 0)\).
That is one of the big ideas in this topic: the same function can look different depending on its form, but the graph always represents the same relationship.
When reading a graph, identify where it crosses the axes, whether it increases or decreases, and whether it has symmetry or a turning point. For a line, the most important visual features are slope and intercepts, as we saw earlier in [Figure 1]. For a quadratic, the central features are the vertex, the direction of opening, and the intercepts, all organized around the axis of symmetry shown in [Figure 2]. The side-by-side comparison brings these features together.
It is also important to distinguish between an intercept and a general point. An intercept has a special location: it lies on an axis. For instance, \((3, 5)\) is a point on a graph, but it is not an intercept because neither coordinate is \(0\).
Another key idea is that a graph tells you about the function's outputs over an interval. If a parabola opens downward, the function rises up to the vertex and then falls. If it opens upward, the function falls to the vertex and then rises. This change in direction is exactly what makes maxima and minima possible for quadratics.
| Function Type | General Form | Graph Shape | Key Features |
|---|---|---|---|
| Linear | \(y = mx + b\) | Straight line | Slope, \(x\)-intercept, \(y\)-intercept |
| Quadratic | \(y = ax^2 + bx + c\) | Parabola | Vertex, axis of symmetry, intercepts, maximum or minimum |
Table 1. Comparison of the major graphical features of linear and quadratic functions.
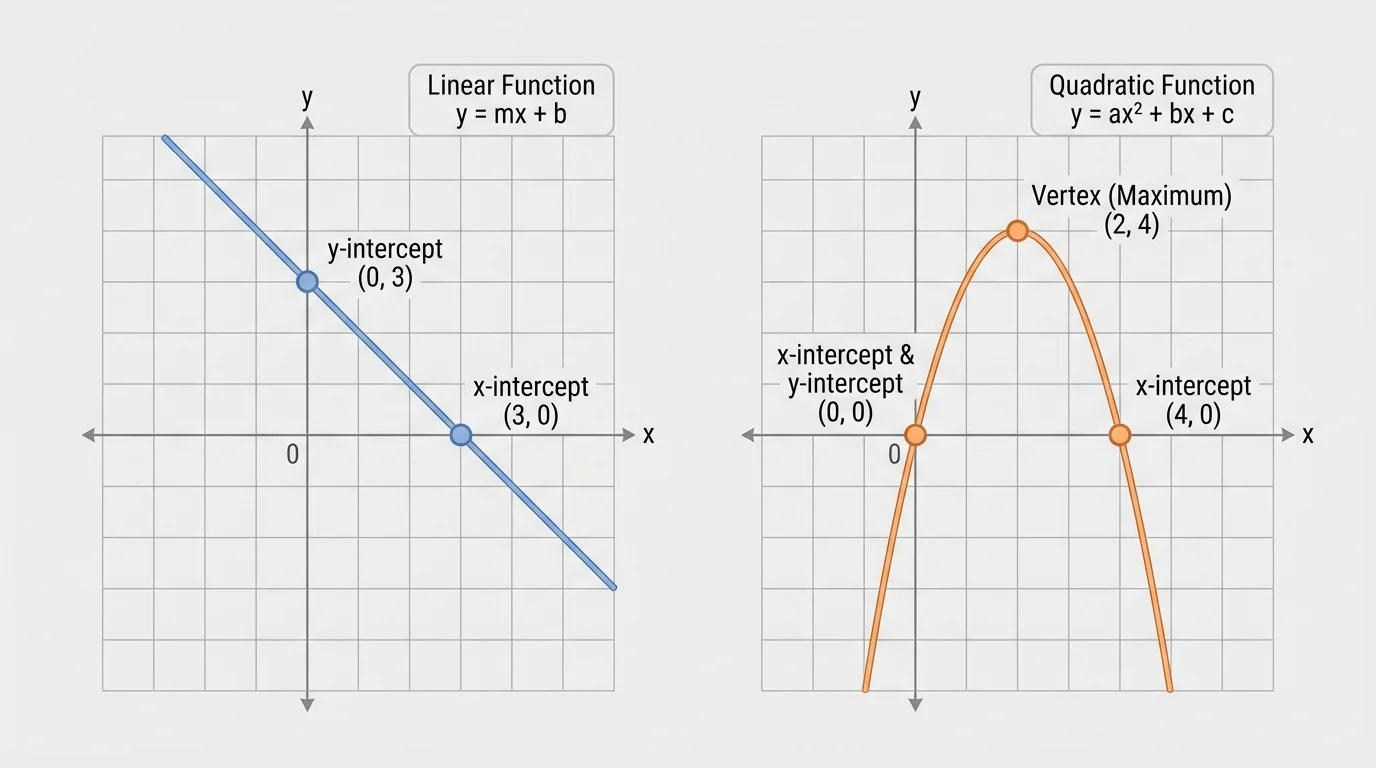
[Figure 3] Comparing the two main graph types side by side helps reveal what stays the same and what changes. Both lines and parabolas can have intercepts, while only the parabola has a turning point.
Worked Example 1: Graph a linear function and find its intercepts
Graph \(y = 2x - 4\) and identify the intercepts.
Step 1: Find the \(y\)-intercept.
Substitute \(x = 0\): \(y = 2(0) - 4 = -4\). The \(y\)-intercept is \((0, -4)\).
Step 2: Find the \(x\)-intercept.
Set \(y = 0\): \(0 = 2x - 4\). Then \(2x = 4\), so \(x = 2\). The \(x\)-intercept is \((2, 0)\).
Step 3: Graph the line.
Plot \((0, -4)\) and \((2, 0)\), then draw the straight line through them.
The graph is a rising line because the slope \(m = 2\) is positive.
Notice how efficient intercepts can be. With many linear functions, two points are enough to graph the entire line accurately.
Worked Example 2: Find the vertex and intercepts of a quadratic
Graph \(y = x^2 - 4x + 3\) and identify the intercepts and minimum.
Step 1: Find the axis of symmetry.
Here \(a = 1\) and \(b = -4\). Use \(x = -\dfrac{b}{2a}\): \(x = -\dfrac{-4}{2 \cdot 1} = 2\).
Step 2: Find the vertex.
Substitute \(x = 2\) into the function: \(y = 2^2 - 4(2) + 3 = 4 - 8 + 3 = -1\). The vertex is \((2, -1)\).
Step 3: Determine whether it is a maximum or minimum.
Since \(a = 1 > 0\), the parabola opens upward. Therefore, the vertex is a minimum.
Step 4: Find the \(y\)-intercept.
Let \(x = 0\): \(y = 3\). The \(y\)-intercept is \((0, 3)\).
Step 5: Find the \(x\)-intercepts.
Set \(y = 0\): \(x^2 - 4x + 3 = 0\). Factor: \((x - 1)(x - 3) = 0\). So \(x = 1\) or \(x = 3\). The \(x\)-intercepts are \((1, 0)\) and \((3, 0)\).
The minimum value of the function is \(-1\), occurring at \(x = 2\).
This example shows something important: the vertex does not have to be on an axis. It is often somewhere in the interior of the graph, and it controls the parabola's turning behavior.
Worked Example 3: Use vertex form to graph quickly
Graph \(y = -2(x - 1)^2 + 8\) and identify the maximum and intercepts.
Step 1: Read the vertex directly.
In vertex form \(y = a(x - h)^2 + k\), the vertex is \((h, k)\). So the vertex is \((1, 8)\).
Step 2: Determine opening direction.
Since \(a = -2 < 0\), the parabola opens downward. Therefore, the vertex is a maximum.
Step 3: Find the \(y\)-intercept.
Let \(x = 0\): \(y = -2(0 - 1)^2 + 8 = -2(1) + 8 = 6\). The \(y\)-intercept is \((0, 6)\).
Step 4: Find the \(x\)-intercepts.
Set \(y = 0\): \(0 = -2(x - 1)^2 + 8\). Then \(2(x - 1)^2 = 8\), so \((x - 1)^2 = 4\). Taking square roots gives \(x - 1 = 2\) or \(x - 1 = -2\). Thus \(x = 3\) or \(x = -1\).
The \(x\)-intercepts are \((3, 0)\) and \((-1, 0)\), and the maximum value is \(8\).
Vertex form is especially useful because it reveals the turning point immediately. That is one reason teachers and graphing tools often use this form when analyzing quadratics.
A projectile moving under constant gravity traces a path that is modeled by a quadratic function, at least in simplified physics models. That means the highest point of the path is the vertex of a parabola.
By hand, you should be able to graph simple lines and quadratics and identify their key features. For more complicated equations, technology becomes useful. A graphing calculator or graphing software can quickly display the graph, estimate intercepts, and help confirm the maximum or minimum.
When using technology, be careful about the viewing window. A poor window can hide intercepts or make a parabola look almost flat. If the graph seems incomplete, adjust the \(x\)-range and \(y\)-range. For example, a wide vertical scale can make a steep parabola seem less dramatic than it really is.
Technology is most helpful when you already know what you expect to see. If you know that \(a < 0\) means a quadratic opens downward, then you can check whether the graph matches your algebra. If it does not, the issue may be a typing error or a wrong window setting.
It is also helpful for verifying results from hand calculations. For example, after computing a vertex and intercepts, you can graph the function and see whether the plotted features match those values, just as the comparison in [Figure 3] reinforces visually.
Linear and quadratic graphs appear in many real situations. A linear function can model total earnings with an hourly wage, such as \(E = 18h\), where earnings increase at a constant rate of \(\$18\) per hour. The graph is a line through the origin because earning \(0\) hours gives \(\$0\).
A quadratic function can model height over time for an object thrown upward. For example, \(h(t) = -16t^2 + 48t + 5\) in feet can represent vertical motion. The negative coefficient of \(t^2\) tells us the graph opens downward, so there is a maximum height. The vertex gives the moment when the object reaches its highest point.
In business, a quadratic can model profit when increasing production first helps and later hurts because of rising costs. In geometry, quadratics can model area relationships, where a design has a largest possible area under certain constraints. In all these cases, the graph helps reveal the most important values quickly.
These applications are easier to interpret when you can identify the key features of the graph. The intercepts often represent starting values or break-even points, while the maximum or minimum represents an optimal outcome.
One common mistake is mixing up the \(x\)-intercept and the \(y\)-intercept. Remember: the \(x\)-intercept happens when \(y = 0\), and the \(y\)-intercept happens when \(x = 0\).
Another common error is using the wrong sign in the vertex formula \(x = -\dfrac{b}{2a}\). The negative sign matters. If \(b = -4\), then \(-b = 4\), not \(-4\).
Students also sometimes assume every quadratic has two \(x\)-intercepts. That is not true. Some touch the \(x\)-axis once, and some never cross it at all. The graph in [Figure 2] helps reinforce that the position of the parabola relative to the \(x\)-axis determines how many real \(x\)-intercepts exist.
Finally, graphing too few points can lead to a poor sketch. For a line, two points are enough, but more points can help check accuracy. For a parabola, plotting the vertex and a few symmetric points on either side of the axis of symmetry usually gives a better graph.