A streaming service, a bike ride, a recipe, and a shopping trip can all hide the same mathematical idea: if one quantity doubles, does the other also double? That question is more powerful than it looks. It helps you tell whether a situation has a steady multiplier, and that is exactly what a proportional relationship is about.
Many everyday situations involve comparing two quantities. If a car travels at a constant speed, then the distance depends on the time. If fruit costs the same amount per pound, then the total cost depends on the weight. If a recipe is doubled, each ingredient amount doubles too. In each case, the two quantities may change together in a very regular way.
That regular pattern matters because it lets you predict values quickly. If you know the relationship is proportional, then one number always tells you the other using the same multiplier. Instead of calculating from scratch every time, you can use a constant rate.
Ratios compare two quantities. For example, a ratio of \(2:3\) can also be written as \(\dfrac{2}{3}\). Two ratios are equivalent if they represent the same comparison, such as \(\dfrac{2}{3} = \dfrac{4}{6}\).
To decide whether two quantities are proportional, you usually test the relationship in more than one way. You can examine a table, think about the unit rate, graph the points, or look for an equation of the form \(y = kx\), where \(k\) is a constant.
A proportional relationship is a relationship between two quantities in which their ratio stays constant. If one quantity is \(x\) and the other is \(y\), then the relationship is proportional when there is some number \(k\) such that
\(y = kx\)
The number \(k\) is called the constant of proportionality. It tells how much \(y\) there is for each \(1\) unit of \(x\). For example, if \(y = 3x\), then \(k = 3\). That means each value of \(y\) is \(3\) times the corresponding value of \(x\).
Proportional relationship: a relationship in which two quantities have a constant ratio.
Constant of proportionality: the constant number \(k\) in an equation of the form \(y = kx\).
Equivalent ratios: ratios that are equal, such as \(\dfrac{2}{5}\) and \(\dfrac{6}{15}\).
Origin: the point \((0,0)\) on a coordinate plane.
If a relationship is proportional, several things are true at once. The ratios are equal in a table, the graph is a straight line through the origin, and the equation has the form \(y = kx\). These are different ways of seeing the same idea.
One important detail is that proportional relationships include the point \((0,0)\). If there are \(0\) items, the total cost is \(0\). If \(0\) hours pass, the distance traveled is \(0\). This is why the graph must pass through the origin.
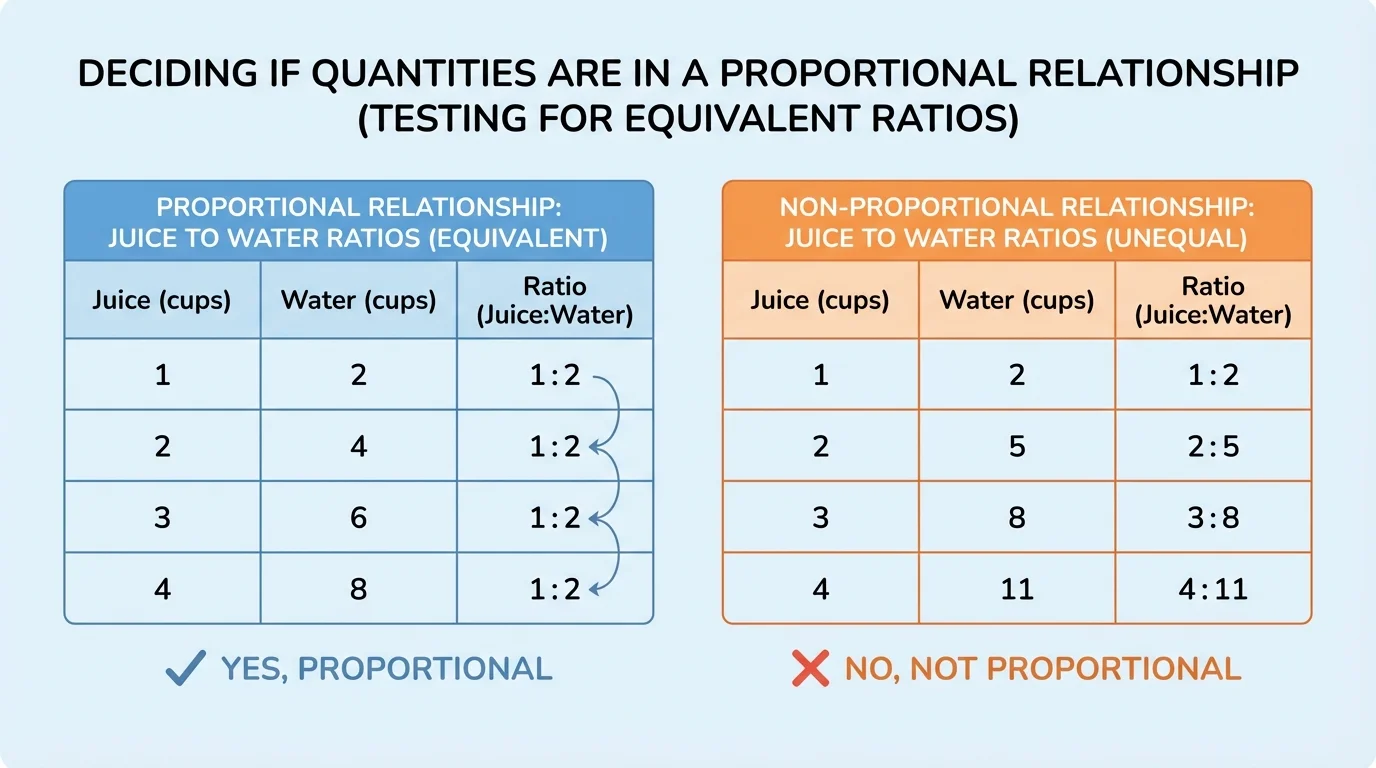
When you are given a table, the most direct test is to compare the ratio of \(y\) to \(x\) in each row. If the ratios are all equal, then the relationship is proportional. If even one ratio is different, the relationship is not proportional.
Suppose a table lists cups of flour and cups of sugar in a recipe. [Figure 1] If the ratios \(\dfrac{\textrm{sugar}}{\textrm{flour}}\) are always the same, then the recipe scales proportionally. If the ratio changes, the relationship is not proportional.
For each row, divide \(y\) by \(x\), as long as \(x \neq 0\). If the quotient stays the same, then that quotient is the constant of proportionality.
For example, consider this table:
| \(x\) | \(y\) | \(\dfrac{y}{x}\) |
|---|---|---|
| \(2\) | \(6\) | \(3\) |
| \(4\) | \(12\) | \(3\) |
| \(7\) | \(21\) | \(3\) |
Table 1. A table where the ratio \(\dfrac{y}{x}\) stays constant.
Because \(\dfrac{6}{2} = 3\), \(\dfrac{12}{4} = 3\), and \(\dfrac{21}{7} = 3\), the relationship is proportional. The constant of proportionality is \(3\), so the equation is \(y = 3x\).
Now consider a different table:
| \(x\) | \(y\) | \(\dfrac{y}{x}\) |
|---|---|---|
| \(2\) | \(6\) | \(3\) |
| \(4\) | \(13\) | \(\dfrac{13}{4}\) |
| \(7\) | \(21\) | \(3\) |
Table 2. A table where the ratio \(\dfrac{y}{x}\) is not constant.
Since \(\dfrac{13}{4} \neq 3\), the ratios are not all equal, so the relationship is not proportional.
As we saw earlier in [Figure 1], a good habit is to check every row, not just the first and last. A relationship can look proportional at first and still fail when one row breaks the pattern.
A graph gives a visual test. A relationship is proportional if its graph is a straight line that passes through the origin. Both conditions matter: it must be straight, and it must go through \((0,0)\).
If the points lie on a straight line but the line crosses the \(y\)-axis above or below \(0\), then the relationship is not proportional. [Figure 2] That kind of graph shows a linear relationship, but not a proportional one.
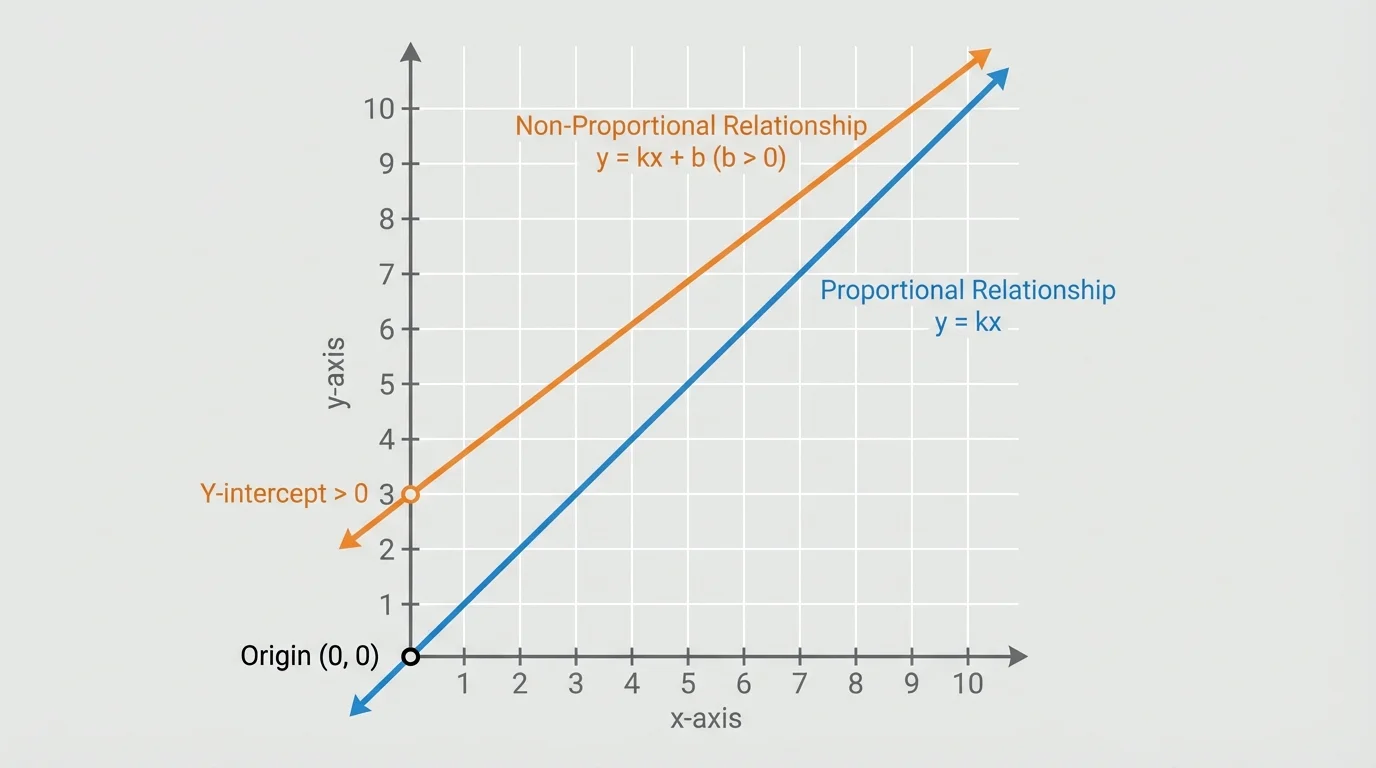
For example, the graph of \(y = 4x\) is a straight line through the origin, so it represents a proportional relationship. But the graph of \(y = 4x + 2\) is also straight and does not represent a proportional relationship because it does not pass through the origin.
This is a very common mistake: students see a straight line and think "proportional." The missing question is, "Does it go through \((0,0)\)?" If not, then the ratio is not constant for all points.
Why the origin matters
In a proportional relationship, when \(x = 0\), the equation \(y = kx\) gives \(y = 0\). That means the graph must include \((0,0)\). A line that misses the origin shows that there is some starting amount added or subtracted, so the relationship is not purely multiplicative.
Later, when you compare equations, remember that proportional relationships are based on multiplication by a constant. Adding a fixed amount changes the pattern and breaks proportionality, which is exactly what [Figure 2] helps you see.
It helps to compare different kinds of relationships side by side. A proportional relationship has a constant ratio and an equation of the form \(y = kx\). A nonproportional relationship may still have a pattern, but not one based on a constant ratio.
| Feature | Proportional | Not Proportional |
|---|---|---|
| Ratio \(\dfrac{y}{x}\) | Constant | Not constant |
| Equation | \(y = kx\) | Not of the form \(y = kx\) |
| Graph | Straight line through \((0,0)\) | Not through origin, or not straight |
| When \(x = 0\) | \(y = 0\) | May be a different value |
Table 3. A comparison of proportional and nonproportional relationships.
For instance, a taxi fare that costs \(\$3\) to start plus \(\$2\) per mile is not proportional. The equation is \(y = 2x + 3\), not \(y = 2x\). Even though the graph is straight, it does not pass through the origin because there is a starting fee.
By contrast, if apples cost $2 per pound with no starting fee, then the total cost is \(y = 2x\). That relationship is proportional because the cost is always \(2\) times the number of pounds.
Worked example 1
Determine whether the quantities in the table are proportional.
| \(x\) | \(y\) |
|---|---|
| \(3\) | \(9\) |
| \(5\) | \(15\) |
| \(8\) | \(24\) |
Table 4. A table used to test whether the relationship is proportional.
Step 1: Find the ratio \(\dfrac{y}{x}\) for each row.
\(\dfrac{9}{3} = 3\), \(\dfrac{15}{5} = 3\), and \(\dfrac{24}{8} = 3\).
Step 2: Compare the ratios.
All three ratios are equal to \(3\).
Step 3: Decide and write the equation.
Because the ratios are constant, the relationship is proportional. The constant of proportionality is \(3\), so the equation is \(y = 3x\).
The quantities are proportional.
This example works because every pair follows the same multiplier. No matter which row you test, \(y\) is always \(3\) times \(x\).
Worked example 2
Determine whether the points \((1,2)\), \((2,4)\), \((3,6)\), and \((4,9)\) form a proportional relationship.
Step 1: Test the ratio \(\dfrac{y}{x}\) for each point.
\(\dfrac{2}{1} = 2\), \(\dfrac{4}{2} = 2\), \(\dfrac{6}{3} = 2\), but \(\dfrac{9}{4} = 2.25\).
Step 2: Compare the ratios.
The first three ratios are \(2\), but the last ratio is \(2.25\).
Step 3: Decide.
Since the ratios are not all equal, the relationship is not proportional.
The points do not represent a proportional relationship.
Even one mismatched point is enough to break proportionality. A graph of these points would not all lie on the same line through the origin.
Worked example 3
A store sells granola for \(\$4\) per pound. Is the relationship between pounds \(x\) and total cost \(y\) proportional?
Step 1: Identify the unit rate.
The cost is \(\$4\) for every \(1\) pound, so the constant of proportionality is \(4\).
Step 2: Write an equation.
\(y = 4x\)
Step 3: Test a few values.
If \(x = 2\), then \(y = 8\). If \(x = 5\), then \(y = 20\). Also, if \(x = 0\), then \(y = 0\).
Step 4: Decide.
The equation has the form \(y = kx\), so the relationship is proportional.
Yes, the relationship is proportional.
Because there is no fixed starting charge, the total cost begins at \(0\) and grows by the same factor each time. That is the hallmark of a proportional relationship.
Worked example 4
A graph is a straight line through the points \((0,3)\), \((1,5)\), and \((2,7)\). Is the relationship proportional?
Step 1: Check whether the graph is straight.
Yes, the points are on a straight line.
Step 2: Check whether the graph passes through the origin.
No. When \(x = 0\), the value of \(y\) is \(3\), not \(0\).
Step 3: Decide.
A proportional graph must be a straight line through the origin. This one is not.
No, the relationship is not proportional.
This kind of example is important because it may look proportional at first. The line is straight, but the nonzero starting value changes everything.
One mistake is checking only whether a graph is a straight line. A straight line is not enough. The line must also pass through \((0,0)\).
Another mistake is comparing differences instead of ratios. In proportional relationships, the key feature is a constant multiplier, not a constant difference. For example, if \(y\) increases by \(2\) each time, that alone does not guarantee proportionality.
A third mistake is forgetting what happens when \(x = 0\). In a proportional relationship, \(y\) must also be \(0\). If a table or graph shows a different value, the relationship is not proportional.
Many real pricing systems are deliberately not proportional. Delivery fees, membership charges, and base fares add a starting amount, which turns a proportional pattern into a nonproportional one.
Finally, be careful when a table includes fractions or decimals. The same test still works. If the ratios are equal, the relationship is proportional, even if the numbers are not whole numbers.
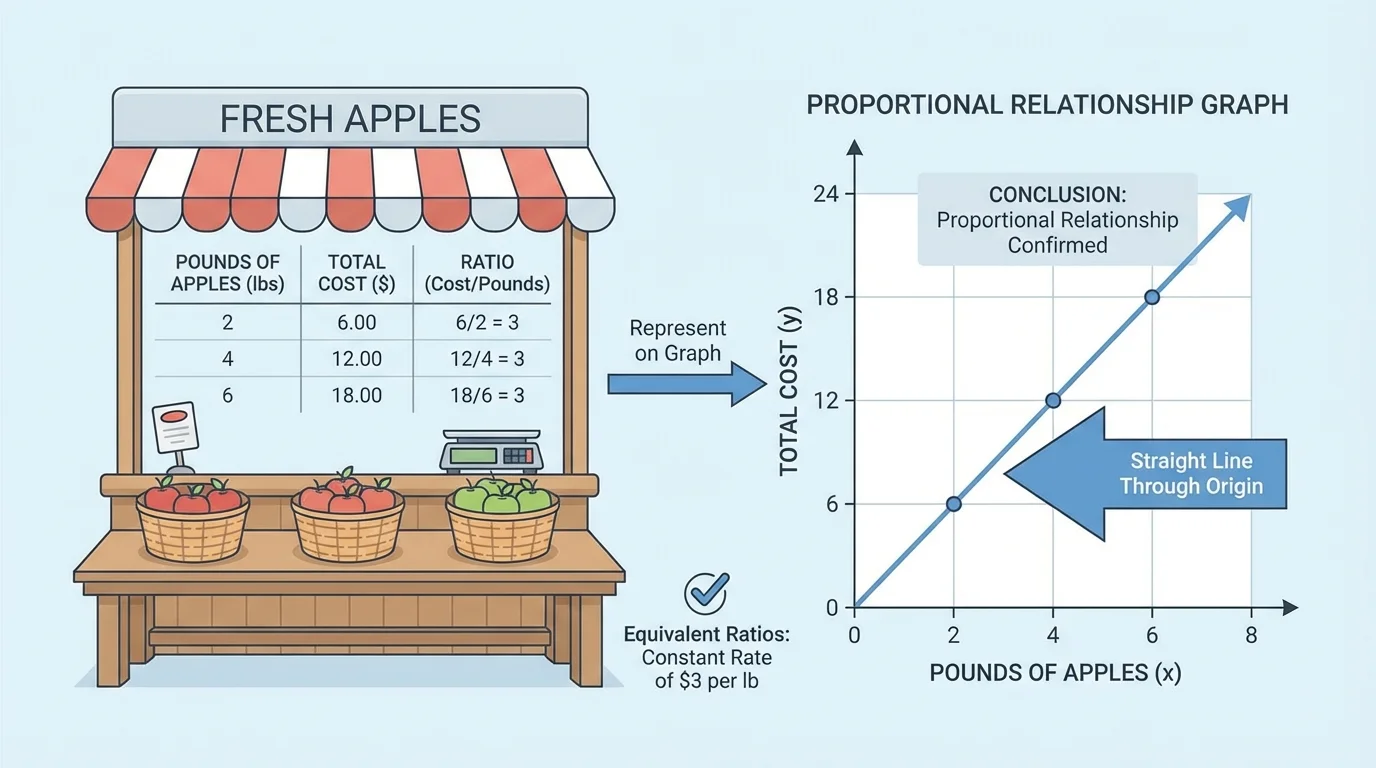
Shopping gives one of the clearest examples. [Figure 3] If oranges cost \(\$1.80\) per pound, then the total cost is proportional to the number of pounds. The cost pattern in produce pricing often follows this kind of constant rate.
Suppose \(x\) is pounds of oranges and \(y\) is total cost. Then \(y = 1.8x\). If you buy \(2\) pounds, the cost is \(\$3.60\). If you buy \(5\) pounds, the cost is \(\$9.00\). The ratio \(\dfrac{y}{x}\) always stays \(1.8\).
Constant speed is another example. If a cyclist rides at \(12\) miles per hour, then distance is proportional to time. After \(1\) hour, the cyclist travels \(12\) miles. After \(3\) hours, the cyclist travels \(36\) miles. The relationship is \(d = 12t\).
Recipes also depend on proportional thinking. If a recipe uses \(2\) cups of rice for \(5\) servings, then \(\dfrac{2}{5}\) cup of rice is needed per serving. For \(10\) servings, the amount is \(4\) cups. The ratio of rice to servings stays constant.
Later in a course, students often study slope in linear relationships. In a proportional situation, the constant of proportionality acts like the unit rate, and the graph begins at the origin. The store example in [Figure 3] connects that idea to something you can actually buy and measure.
Strong math thinking means being able to recognize the same relationship in words, a table, a graph, and an equation. For proportional relationships, all these representations tell the same story.
In words, the relationship has a constant rate such as "\(4\) dollars per pound" or "\(60\) miles per hour." In a table, the ratios are equal. In a graph, the points form a straight line through the origin. In an equation, the rule is \(y = kx\).
If even one representation breaks the pattern, then the relationship is not proportional. A graph missing the origin, a table with unequal ratios, or an equation like \(y = 5x + 2\) all indicate that something other than simple multiplication is happening.
When you are not sure, ask three questions: Is the ratio constant? Does the graph pass through the origin? Can the equation be written as \(y = kx\)? If the answer is yes each time, then the relationship is proportional.
"A proportional relationship keeps the same multiplicative pattern every time."
That single idea ties the entire topic together. Whether you are looking at a set of points, a table, or a word problem, you are really checking for one steady multiplier.