When you buy several identical items, the total cost does something very predictable: double the number of items, and the cost doubles too. Triple the number of items, and the cost triples. That kind of pattern appears in shopping, wages, recipes, speed, and even phone data plans. Mathematics has a powerful way to describe this pattern exactly, using equations such as \(t = pn\).
A relationship between two quantities is often easier to understand when you can describe it with one clear rule. In many real situations, one quantity changes by multiplying the other quantity by the same number every time. If each notebook costs $3, then buying \(n\) notebooks costs \(3n\) dollars. If a car travels at \(60\) miles per hour for \(t\) hours, then the distance is \(60t\) miles.
These situations are examples of a proportional relationship. In a proportional relationship, one quantity is always a constant multiple of the other. As [Figure 1] shows, the key idea is that the ratio between the two quantities stays the same. That fixed multiplier is what makes proportional relationships special and useful.
Instead of describing the pattern again and again in words, we can represent it with an equation. This lets us calculate quickly, make predictions, and compare situations.
Proportional relationship refers to a relationship between two quantities in which one is always equal to a constant times the other.
Constant of proportionality is the fixed ratio or multiplier that relates one quantity to the other in a proportional relationship.
An equation is a mathematical statement showing that two expressions are equal, such as \(y = 4x\).
The most common equation for a proportional relationship is:
\(y = kx\)
Here, \(x\) and \(y\) are the two quantities, and \(k\) is the constant of proportionality.
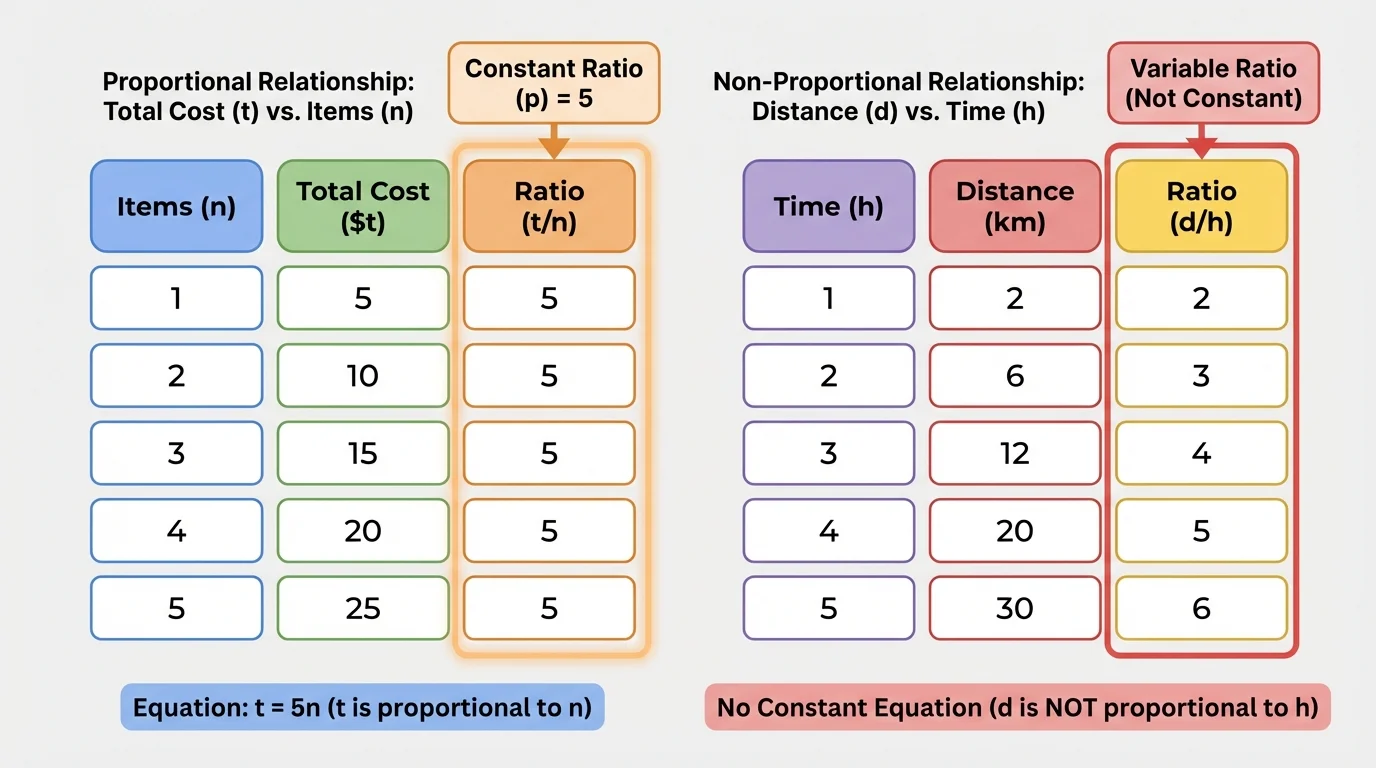
There are several ways to recognize a proportional relationship. One important sign is that the ratio \(\dfrac{y}{x}\) stays constant for all corresponding values, as long as \(x \neq 0\). If \(\dfrac{y}{x} = 5\) every time, then the relationship can be written as \(y = 5x\).
For example, consider the pairs \((1,4)\), \((2,8)\), and \((5,20)\). For each pair, \(\dfrac{4}{1} = 4\), \(\dfrac{8}{2} = 4\), and \(\dfrac{20}{5} = 4\). Since the ratio is always \(4\), the relationship is proportional, and its equation is \(y = 4x\).
Now compare that with the pairs \((1,4)\), \((2,7)\), and \((3,10)\). The ratios are \(\dfrac{4}{1} = 4\), \(\dfrac{7}{2} = 3.5\), and \(\dfrac{10}{3}\), which are not equal. Since the ratio is not constant, the relationship is not proportional.
A ratio compares two quantities using division. A unit rate is a rate for \(1\) unit, and in proportional relationships, the unit rate is the same as the constant of proportionality.
Another key feature is that a proportional relationship includes the point \((0,0)\). If you buy \(0\) items, the total cost is $0. If you work \(0\) hours, your pay is $0, assuming you only earn by the hour with no starting bonus.
In the equation \(y = kx\), each symbol has a job. The variable \(x\) usually represents the input or independent quantity, and \(y\) represents the output or dependent quantity. The number \(k\) tells how much \(y\) there is for each \(1\) unit of \(x\).
Suppose the equation is \(t = 2.50n\). This means the total cost \(t\) is found by multiplying the number of items \(n\) by $2.50. The constant of proportionality is \(2.50\), which means each item costs $2.50.
Units matter. In \(d = 55t\), if \(d\) is distance in miles and \(t\) is time in hours, then \(55\) means \(55\) miles per hour. The equation is not just symbols; it tells a real story about how quantities are connected.
The constant gives the meaning of the relationship. In a proportional equation, the number \(k\) is more than a multiplier. It often represents a price per item, miles per hour, dollars per hour, cups per batch, or another unit rate. Once you know what \(k\) means, you can interpret the whole equation in context.
To find the constant of proportionality, divide the output by the input:
\[k = \frac{y}{x}\]
For example, if \(6\) tickets cost $48, then the cost per ticket is found by dividing \(48\) by \(6\): \(\dfrac{48}{6} = 8\). So the constant of proportionality is \(8\), and the equation is \(c = 8t\), where \(c\) is total cost and \(t\) is number of tickets.
If you are given a table, compute \(\dfrac{y}{x}\) for several rows. If the value is always the same, that common value is \(k\). If the values are different, the relationship is not proportional.
| Hours \((h)\) | Pay \((w)\) | \(\dfrac{w}{h}\) |
|---|---|---|
| \(2\) | \(24\) | \(12\) |
| \(5\) | \(60\) | \(12\) |
| \(8\) | \(96\) | \(12\) |
Table 1. A pay table showing a constant ratio of \(12\), so the relationship is proportional.
From the table, \(k = 12\). The equation is \(w = 12h\). This means the worker earns $12 per hour.
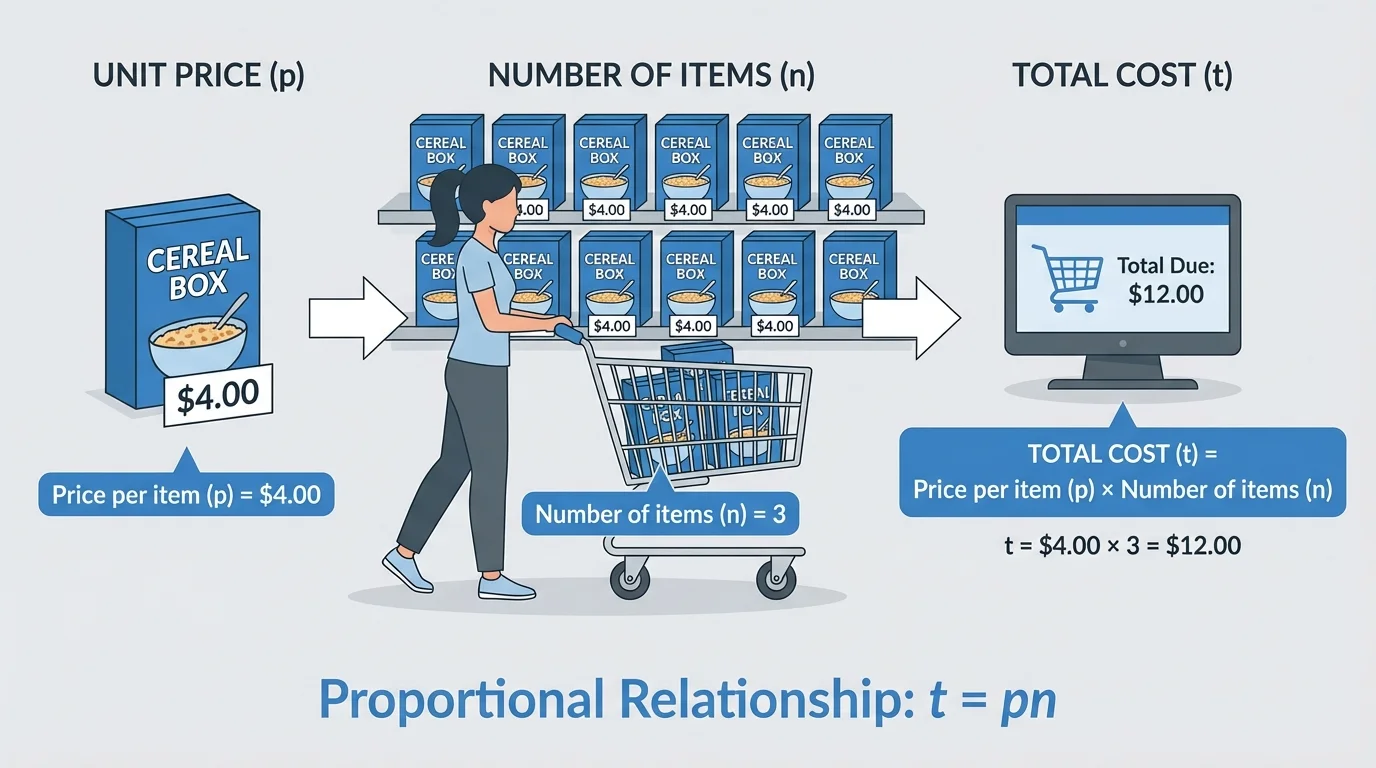
Shopping situations are one of the clearest ways to model proportional equations, as [Figure 2] illustrates. If each item has the same price, then total cost is proportional to the number of items.
If the total cost is \(t\), the number of items is \(n\), and the price per item is \(p\), then the equation is:
\(t = pn\)
This equation says that total cost equals price per item times number of items. If \(p = 4\), then \(t = 4n\). For \(3\) items, \(t = 4(3) = 12\). For \(10\) items, \(t = 4(10) = 40\).
The same pattern appears in many contexts:
The letters can change, but the structure stays the same: one variable equals a constant times the other variable.
Many scientific formulas start with the same idea as proportional relationships. When one quantity changes at a constant rate compared with another, mathematicians and scientists often model it with an equation of the form \(y = kx\).
Worked examples help show how to move from words or data to an equation and then use the equation to solve problems.
Example 1: Writing an equation for cost
Markers cost $1.75 each. Let \(t\) be the total cost and \(m\) be the number of markers. Write an equation.
Step 1: Identify the constant of proportionality.
The price for each marker is $1.75, so the constant of proportionality is \(1.75\).
Step 2: Multiply the price per item by the number of items.
\(t = 1.75m\)
Step 3: Interpret the equation.
For any number of markers, multiply that number by \(1.75\) to get the total cost.
The equation is \(t = 1.75m\)
Notice that the equation follows exactly the same pattern as \(t = pn\). The only difference is the letters chosen for the variables.
Example 2: Finding distance from a proportional equation
A cyclist rides at a constant speed of \(14\) miles per hour. Let \(d\) be distance and \(h\) be time in hours. Find the equation and then find the distance after \(3.5\) hours.
Step 1: Write the equation.
The constant of proportionality is \(14\), so \(d = 14h\).
Step 2: Substitute \(h = 3.5\).
\(d = 14(3.5)\)
Step 3: Calculate.
\(14 \cdot 3.5 = 49\)
The cyclist travels \(49\) miles.
This example shows that once you know the constant rate, the equation lets you find any matching value quickly.
Example 3: Writing an equation from a table
A table shows that \(2\) pounds of grapes cost $5, \(4\) pounds cost $10, and \(7\) pounds cost $17.50. Is the relationship proportional, and what equation represents it?
Step 1: Find the ratio of cost to pounds.
\(\dfrac{5}{2} = 2.5\), \(\dfrac{10}{4} = 2.5\), and \(\dfrac{17.5}{7} = 2.5\).
Step 2: Check whether the ratio is constant.
All three ratios are \(2.5\), so the relationship is proportional.
Step 3: Write the equation.
If \(c\) is cost and \(p\) is pounds, then \(c = 2.5p\).
The equation is \(c = 2.5p\)
When data comes in a table, the ratio test is often the fastest way to decide whether the relationship is proportional.
Example 4: Deciding whether a relationship is proportional
A gym charges a $15 sign-up fee and $8 per class. Let \(C\) be total cost and \(n\) be number of classes. Is \(C\) proportional to \(n\)?
Step 1: Write the relationship.
\(C = 8n + 15\)
Step 2: Compare with the proportional form.
A proportional relationship must have the form \(y = kx\), with no extra amount added.
Step 3: Decide.
Because of the \(+15\), the relationship is not proportional.
The relationship is not proportional.
There are three main tests you can use. First, check whether the ratio of corresponding values is constant. Second, see whether the equation can be written in the form \(y = kx\). Third, if you graph the relationship, check whether it forms a straight line through the origin.
These tests all describe the same idea in different representations. A table uses ratios, an equation uses the multiplier \(k\), and a graph uses a line through \((0,0)\).
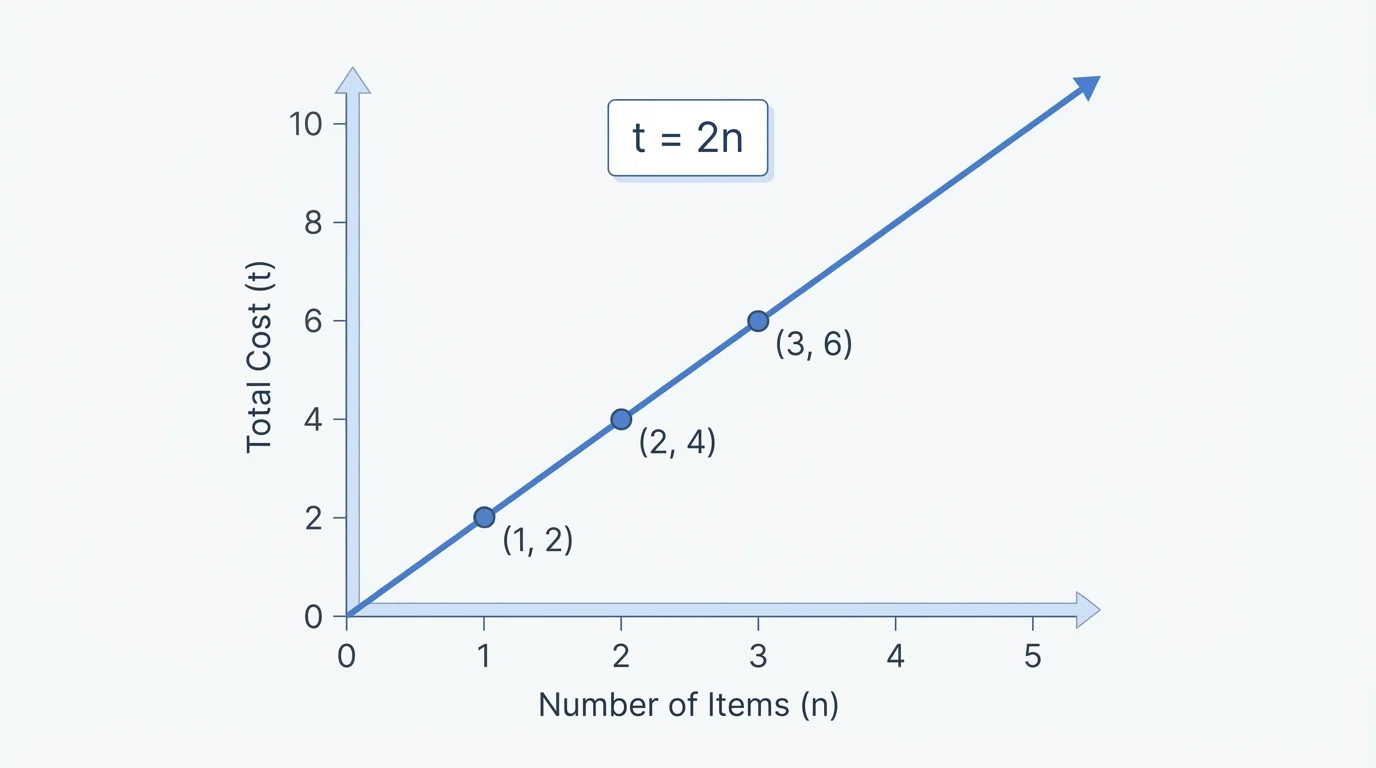
Suppose a babysitter earns $9 per hour. The table, equation \(w = 9h\), and graph all show the same proportional relationship. Later, when you see the line on a graph in [Figure 3], you can connect that picture back to the equation form \(y = kx\).
A graph gives another way to represent the same pattern. In a proportional relationship, the graph is a straight line that passes through the origin. The origin is the point \((0,0)\), which means that if one quantity is \(0\), the other is also \(0\).
For the equation \(y = 3x\), some points on the graph are \((0,0)\), \((1,3)\), \((2,6)\), and \((4,12)\). These points lie on a straight line. The constant of proportionality \(3\) tells how steep the line is and how much \(y\) increases for each increase of \(1\) in \(x\).
If a graph is a straight line but does not pass through the origin, then the relationship is not proportional. For example, \(y = 3x + 2\) is a line, but it crosses the \(y\)-axis at \(2\), not at \(0\).
One relationship, multiple representations. A proportional relationship can be shown with words, a table, an equation, or a graph. Strong understanding means being able to move from one representation to another and keep the same constant of proportionality in each form.
One common mistake is thinking that any increasing relationship is proportional. That is not true. A relationship can increase steadily and still fail to be proportional if it has a starting value other than \(0\).
Another common mistake is confusing the variables. In \(t = pn\), \(p\) is the price per item, not the total price. The variable \(n\) represents the number of items, and multiplying them gives the total cost \(t\).
Students also sometimes divide the wrong way when finding the constant. To find \(k\) in \(y = kx\), divide \(y\) by \(x\), not \(x\) by \(y\). For example, if \(x = 4\) and \(y = 20\), then \(k = \dfrac{20}{4} = 5\).
Zero deserves careful attention. In a proportional relationship, \((0,0)\) must be part of the relationship. But when checking \(\dfrac{y}{x}\), you cannot divide by \(0\). So use nonzero pairs to compute the constant, and then remember that the graph should still include the origin.
Proportional equations appear everywhere once you know how to spot them. In online shopping, total cost depends on quantity when each item has the same price. In travel, distance depends on time when speed stays constant. In jobs paid by the hour, earnings depend on hours worked if the pay rate is fixed.
Cooking gives another great example. If one batch of muffins needs \(2\) cups of flour, then \(b\) batches need \(f = 2b\) cups of flour. Doubling the recipe doubles every ingredient. That is a proportional relationship.
In science, measurements are often proportional too. If a machine uses \(5\) liters of water per minute, then after \(m\) minutes it uses \(w = 5m\) liters. The equation quickly predicts the amount used after any amount of time.
"A good equation does not just calculate; it tells the story of a relationship."
Understanding these equations helps you make decisions. You can compare prices, plan travel time, estimate wages, and check whether a situation is truly proportional or not. When you can move between words, tables, equations, and graphs, you are using mathematics the way people use it in real life.