Have you ever understood something faster by looking at a picture than by reading a whole paragraph? That happens all the time. A map can show where an animal lives in one quick look. A graph can show which month had the most rain. A speaker's voice can convey whether an important idea is exciting or serious. Good readers do more than read written words. They also pay attention to the extra information around the words and think about how it helps them understand the whole text.
Informational texts often teach about real topics such as weather, history, science, sports, or health. To help readers learn clearly, authors include more than sentences. They may add charts, diagrams, tables, timelines, photographs, videos, or spoken explanations. These are not decorations. They are part of the meaning of the text.
Authors choose different ways to share information because each way does a different job. Words are great for explaining details. Pictures are great for showing shape, size, and parts. Numbers are great for showing amounts and comparisons. Oral information, such as a recorded explanation, can help listeners hear emotion, emphasis, and pace.
When all of these parts work together, the reader gets a stronger understanding. For example, a passage about volcanoes might explain how magma rises. A labeled diagram might show the vent, crater, and lava flow. A chart might compare famous eruptions. Each part adds something important.
Visual information is information shown in pictures, diagrams, charts, graphs, maps, photographs, or other things we look at.
Oral information is information we hear, such as a speech, a read-aloud, a recording, or words spoken in a video.
Quantitative information is information shown with numbers, measurements, amounts, or data.
A strong reader asks, "What does this extra part teach me that the words alone do not?" That question helps connect every chart, image, and number to the main text.
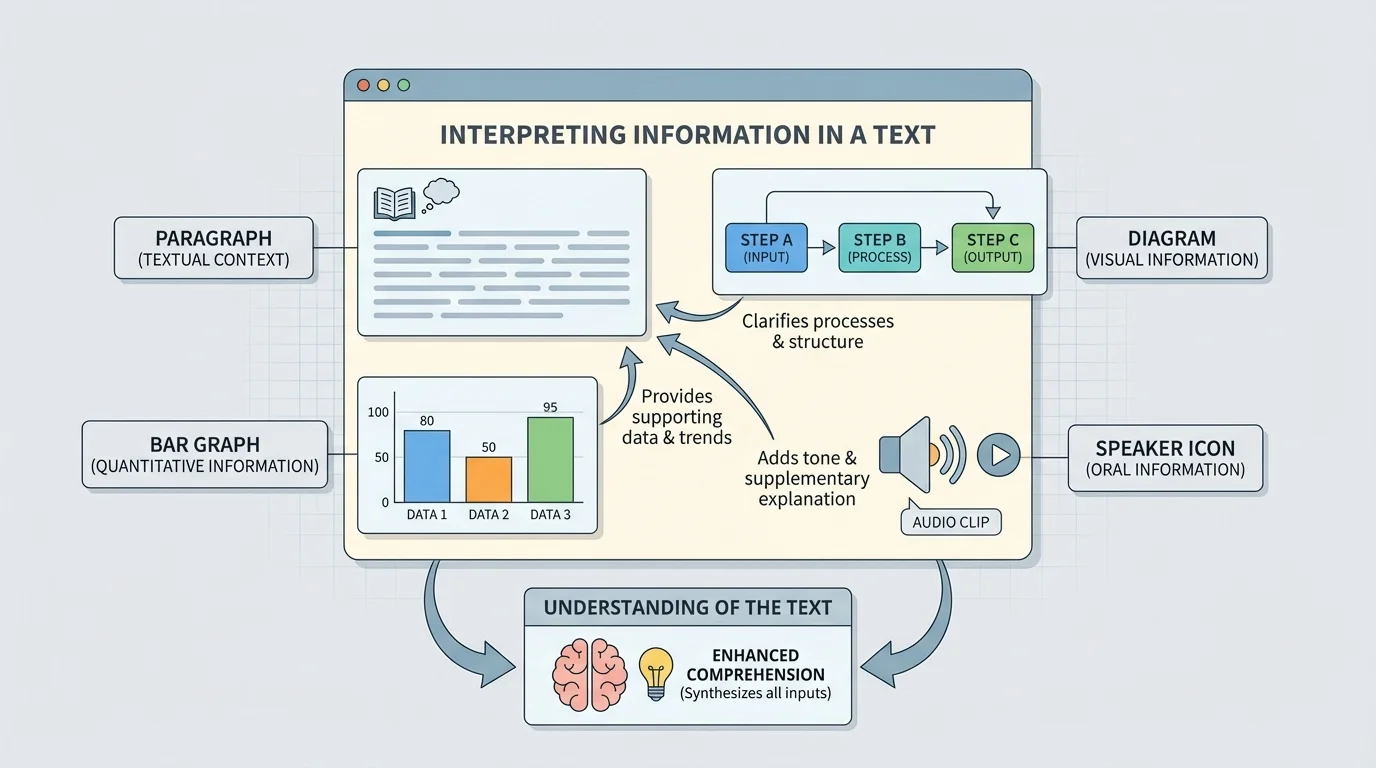
Informational texts can include several kinds of information working together, as [Figure 1] shows in a single page with a paragraph, a diagram, a graph, and audio. A diagram might label the parts of a flower. A chart might compare two planets. A map might show where a river flows. A timeline might place events in order. A video or recording might explain the same topic with spoken words.
Some information fits into more than one group. For example, a bar graph is visual because you look at it, and it is also quantitative because it uses numbers. A video is often visual and oral at the same time because you both see and hear information.
Readers should notice the special features that help explain these parts. Titles tell the topic. Labels name important pieces. Keys explain symbols. Captions give extra details. Arrows can show movement or sequence. On a graph, the axes and numbers tell what is being measured.
Without these features, a reader might see a picture but not understand what it means. With them, the visual becomes part of the text's message.
Visuals often make hard ideas easier because they show things that are difficult to picture in your mind. A science article may describe the parts of a plant, but a labeled picture helps you see where each part belongs. A history article may describe a journey, but a map helps you follow the route.
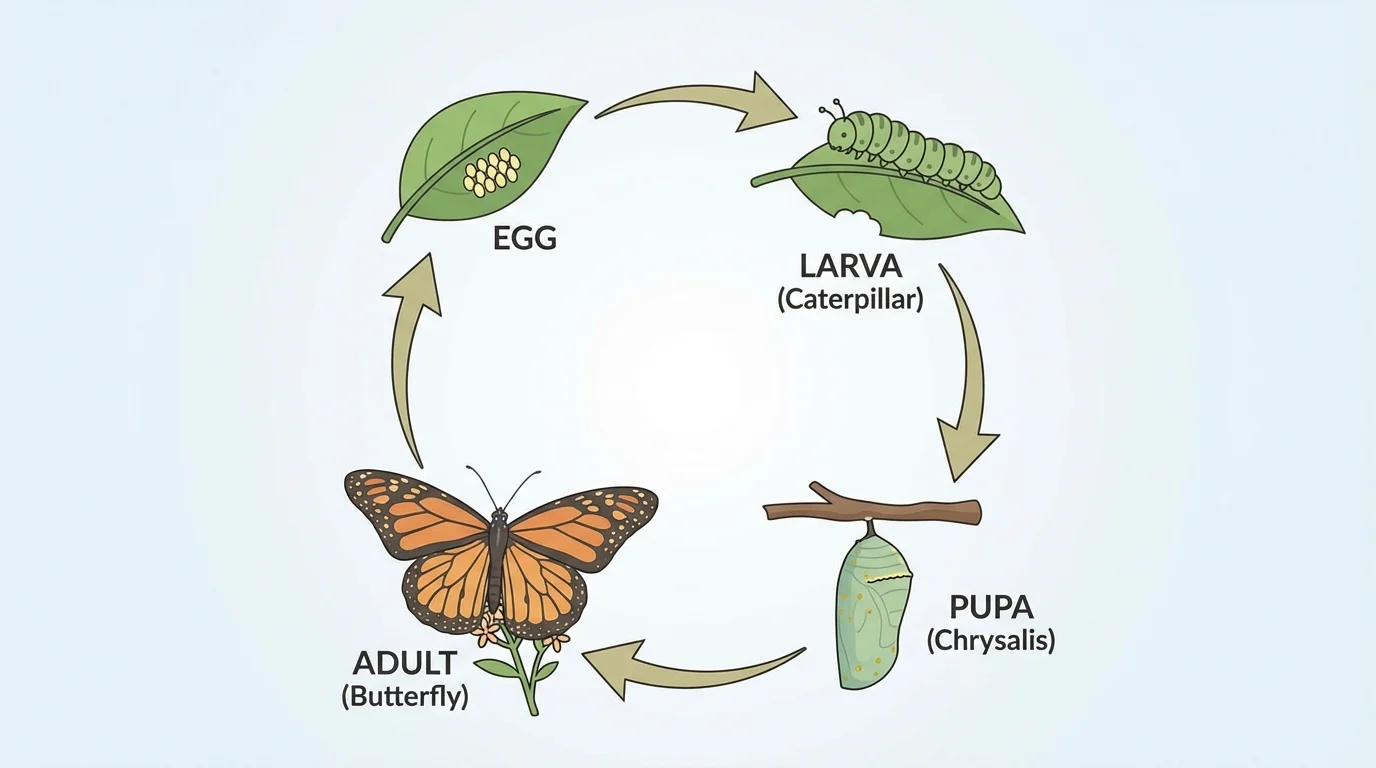
A diagram can reveal sequence and change over time, as [Figure 2] illustrates with a life cycle. Instead of reading many sentences about what happens first, next, and last, a reader can follow arrows and labels to see the order quickly. Visuals can also show relationships, such as how one part connects to another.
Suppose a text says that butterflies go through several stages before becoming adults. A life cycle diagram helps the reader see that the egg comes first, then the caterpillar, then the chrysalis, and finally the butterfly. The diagram does not replace the words. It supports them.
Visual information can also help readers compare. A chart about land animals and sea animals may show where they live, what they eat, and how they move. This helps the reader notice similarities and differences more quickly than reading a long description.
How visuals contribute to understanding
Visuals can clarify, organize, compare, and emphasize information. They clarify by making ideas easier to see. They organize by putting information into parts or steps. They compare by placing facts side by side. They emphasize by drawing attention to the most important ideas in the text.
Later, when you return to the butterfly example in [Figure 2], you can use it to explain not just the order of stages but also the idea of change over time. That is how a visual deepens understanding instead of simply decorating the page.
Not all important information is read silently. Sometimes you listen to a teacher read aloud, watch a video, or hear a person give a presentation. In those moments, your ears gather information that helps you understand the text.
Oral information includes the actual words a speaker says, but it also includes tone, volume, pacing, and emphasis. If a speaker slows down and speaks strongly when saying a key fact, that tells listeners it is important. If the speaker sounds excited, worried, or serious, that feeling can shape how listeners understand the message.
For example, suppose a video about storms says, "Take shelter immediately when you hear thunder." If the narrator uses a serious voice, the oral information helps you understand that this is a safety warning, not just an interesting fact.
When you listen, you should ask the same kind of questions you ask when reading. What is the main idea? Which details support it? What does the speaker's voice add? Sometimes oral information makes directions clearer because you can hear how the words should sound and where the speaker puts stress.
People often remember information better when they both see it and hear it. That is one reason videos, read-alouds, and presentations can be powerful learning tools when they match the written text.
Oral information should also match the text. If a speaker says one thing but a chart shows something different, a careful reader and listener notices the difference and checks both sources.
Quantitative information tells about amounts, sizes, distances, times, or changes using numbers. It often appears in tables, graphs, schedules, measurements, or labeled comparisons. To understand a text fully, readers must understand what the numbers mean.
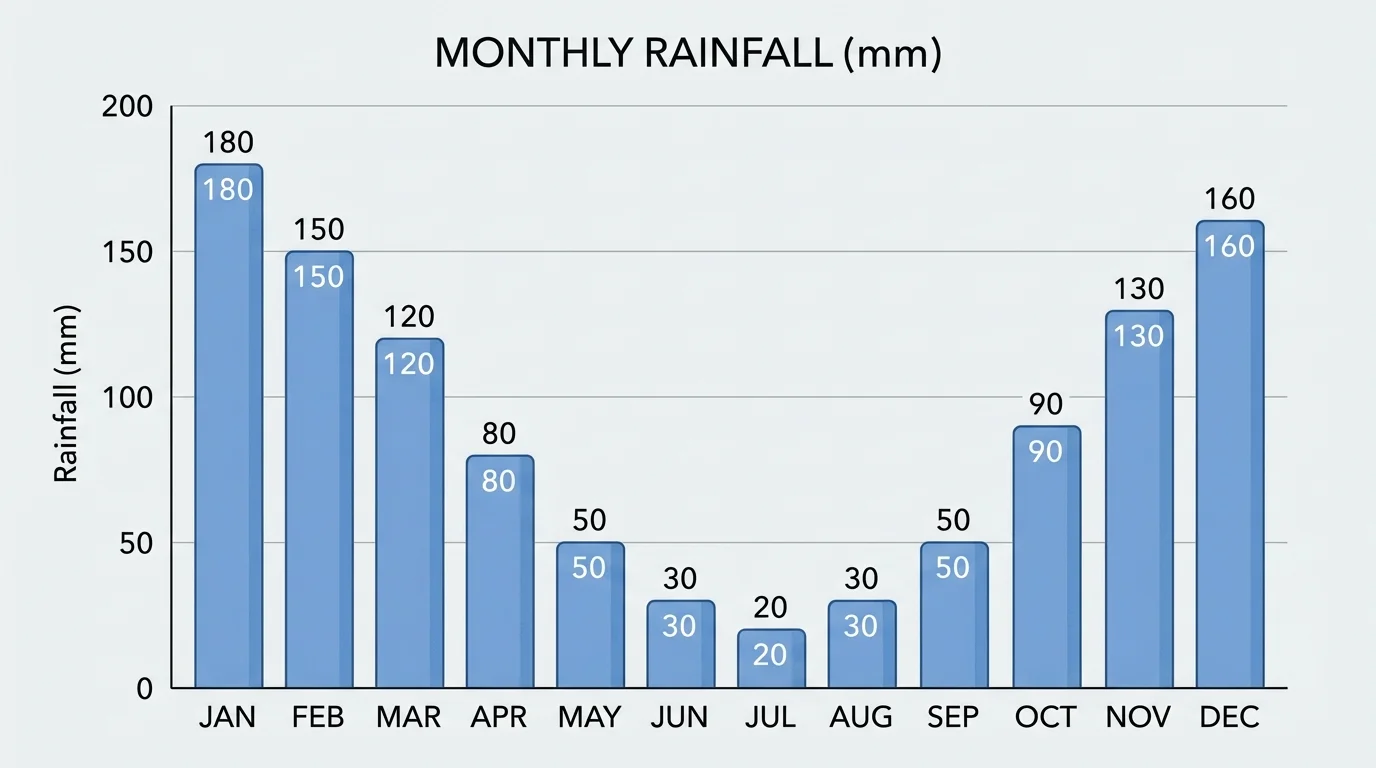
Titles, labels, and scales matter a great deal in a graph, as [Figure 3] shows with monthly rainfall data. Before looking at the bars or lines, a reader should check what is being measured and which numbers are used. A graph without careful reading can be confusing.
Suppose a bar graph shows rainfall for four months. If April has the tallest bar, that means April had the most rainfall. If June has the shortest bar, June had the least. The graph helps the reader compare values quickly.
A table can do something similar by listing exact data. Look at this example.
| Month | Rainfall |
|---|---|
| March | 2 cm |
| April | 5 cm |
| May | 7 cm |
| June | 9 cm |
Table 1. Rainfall amounts for four months.
From this table, a reader can tell that June has the greatest rainfall and March has the least. The text might say, "Rain increased through spring, with the highest amount by early summer." The numbers support that statement.
Quantitative information often helps prove a point. If an article says that one team scored more points each game, a chart of scores gives evidence. If a science text says a plant grew over several weeks, a graph of height gives proof.
Reading a simple graph example
A text says, "The school garden produced more tomatoes in July than in May." A graph shows May with 1 basket and July with 2 baskets.
Step 1: Read the title and labels.
The title tells what is being counted, and the labels show the months.
Step 2: Compare the numbers.
July has 2 baskets, and May has 1 basket.
Step 3: Explain how the graph helps.
The graph supports the sentence because 2 is greater than 1, so July produced more tomatoes than May.
The numbers make the author's point clearer and easier to check.
When reading a graph like the rainfall example in [Figure 3], you do not just say which bar is tallest. You explain what that means in words. That step connects the data to the text.
The most important job is not simply noticing a chart or hearing a recording. The important job is explaining how that information contributes to understanding the text. In other words, how does it help?
Sometimes it clarifies the text by making an idea easier to understand. Sometimes it adds details that are not fully stated in the paragraph. Sometimes it shows evidence that supports a claim. Sometimes it organizes information into steps, groups, or time order.
For example, a text about the history of a town may mention that a school was built first, then a library, then a park. A timeline helps the reader see the order of those events quickly. The timeline contributes by organizing information in time order.
A text about animal teeth may explain that herbivores and carnivores eat different foods. A comparison chart contributes by showing their tooth shapes side by side. This makes the comparison much easier to understand.
When finding the main idea of a paragraph, you look for what the text is mostly about. Use that same skill here: ask how the visual, oral, or quantitative information helps you understand the main idea better.
If you can finish a sentence such as "This diagram helps me understand that..." or "This graph contributes by showing...," then you are making a strong connection between the extra information and the text.
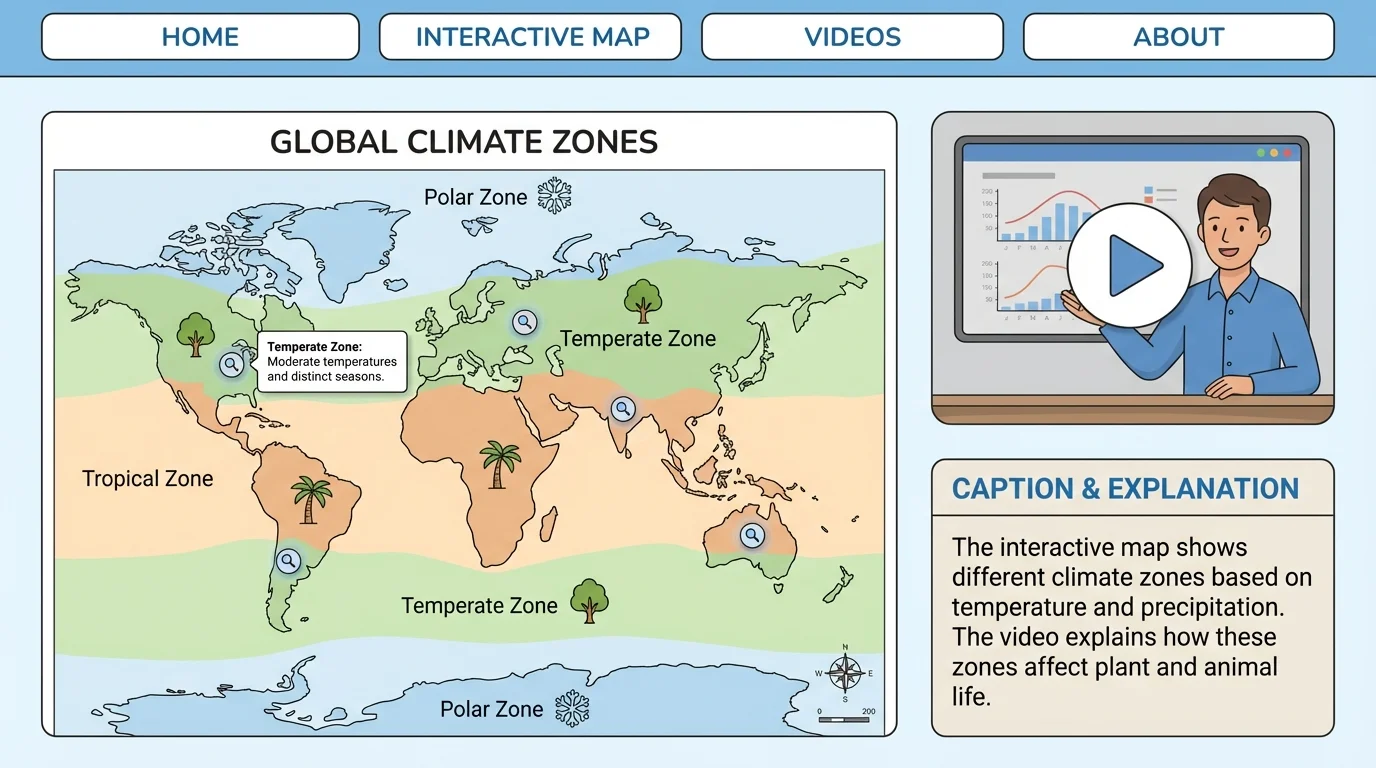
Today, many informational texts appear online. Digital texts often include tools readers use to gather information, as [Figure 4] shows on a web page with tabs, maps, and video controls. These tools may include buttons, menus, captions, audio clips, animations, and interactive maps.
On a web page, one part may not tell the whole story. You might need to click a tab to see another section, press play to hear an explanation, or move over a map to see labels. These interactive elements can add important information that the main paragraph does not include.
For example, a page about the solar system may have a written paragraph about Mars. An interactive image might let you click on Mars to learn its size, temperature, and number of moons. The interactive element contributes by letting the reader explore more details in an organized way.
Captions and sidebars on web pages matter too. A photo caption may explain what the picture shows. A pop-up label may identify a country on a map. A short animation may show a process such as how water moves through the water cycle.
When using web pages, slow down and read carefully. Clicking too quickly can make readers miss information. The best readers notice which parts are meant to be read, watched, heard, or explored.
Later, when you think again about the digital text in [Figure 4], you can see that understanding online reading means using many kinds of information together, not just scrolling through words.
Readers sometimes make mistakes when they glance too quickly at a visual or skip labels. For example, they may see the tallest bar on a graph but forget to read what the graph measures. They may look at a timeline but miss the dates. They may hear a strong voice in a video and remember the feeling, but not the actual facts.
To avoid these mistakes, use a simple habit. Read the text. Study the extra information. Then connect them. Ask: What does this show? What does it mean? How does it help me understand the author's message?
It is also important to notice if different parts of a text disagree. If the paragraph says one thing but the table shows another, stop and investigate. Careful readers do not assume every part says exactly the same thing without checking.
Questions strong readers ask
What kind of information is this? What do the title, labels, and captions tell me? What is the main idea of the text? How does this chart, diagram, spoken explanation, or interactive feature support that idea? What new detail do I understand because of it?
These questions help readers move beyond simply noticing features. They help readers use those features to build meaning.
Think about a text on sea turtles. The paragraph explains that sea turtles lay eggs on beaches, hatch, and travel to the ocean. A map shows where different sea turtles live. A timeline shows the stages from egg to adult. A graph shows how many nests scientists counted over several years. A video clip includes a scientist explaining why protecting beaches matters.
Each part contributes in a different way. The paragraph gives the main explanation. The map adds location. The timeline adds sequence. The graph adds evidence with numbers. The spoken explanation adds emphasis and expert insight. Together, these pieces help the reader understand the topic much more deeply.
That is what skilled reading looks like in informational texts. You do not treat visuals, spoken words, and numbers as extras. You treat them as important parts of the text that help explain ideas, show evidence, and make meaning clearer.