Hospitals, weather experts, and engineers all use simulations when they want to study events that involve chance. A simulation lets us copy a real situation in a simpler way and then run it over and over again. That is especially helpful when a situation involves repeated attempts, such as asking: if only some blood donors have type A blood, how long might it take to find one?
A compound event is an event made up of two or more simpler events. For example, flipping a coin twice and getting two heads is a compound event. Rolling a six-sided die and then spinning a spinner is also a compound event. In this lesson, the simple event is whether a donor has type A blood or does not have type A blood. The compound event involves checking several donors in order.
When chance events repeat, we often want the probability of something that happens across several tries. For example, "it takes at least 4 donors to find one with type A blood" means the first three donors are not type A. The fourth donor might be type A, or the fifth, or the sixth, and so on. The important idea is that you do not find type A among the first three donors.
Simulation is a method of using a model of chance, such as random digits, coins, spinners, or number generators, to imitate a real process. A trial is one complete run of the simulation, and the relative frequency of an event is the number of times it happens divided by the total number of trials.
A simulation does not guarantee the exact answer every time. Instead, it gives an estimate. If the simulation is designed well and run many times, the estimate usually gets closer to the true probability.
Sometimes we can calculate a probability exactly. Other times, a simulation is easier to understand, faster to carry out, or useful for checking whether our exact calculation makes sense. A probability model is a representation of a chance situation that helps us predict outcomes. Random digits are a powerful probability model because digits from 0 to 9 can represent percentages neatly.
If an event has a probability such as 54% or 55%, using a single random digit is not convenient because one digit out of 10 represents tenths, and 54% or 55% cannot be modeled exactly that way. But for a probability like \(\dfrac{40}{100}\), random digits work very well because \(40\% = \dfrac{4}{10}\). That means 4 of the 10 digits can represent success.
You already know that probability can be written as a fraction, decimal, or percent. For example, \(40\% = 0.40 = \dfrac{4}{10} = \dfrac{2}{5}\). Simulation design depends on choosing outcomes that match these probabilities fairly.
When we use random digits, each digit from 0 to 9 is equally likely. So if 4 digits are assigned to type A blood, then the probability of type A in the simulation is \(\dfrac{4}{10} = 0.40\), which matches the real situation.
To design a random digits simulation, we first match the digits to the situation, as shown in [Figure 1]. Since 40% of donors have type A blood, we let 4 of the digits stand for type A and the other 6 digits stand for not type A.
One possible assignment is this: digits 0, 1, 2, 3 mean type A, and digits 4, 5, 6, 7, 8, 9 mean not type A. Any fair assignment with 4 digits for type A and 6 digits for not type A works. The exact digit labels do not matter; what matters is that the proportions are correct.
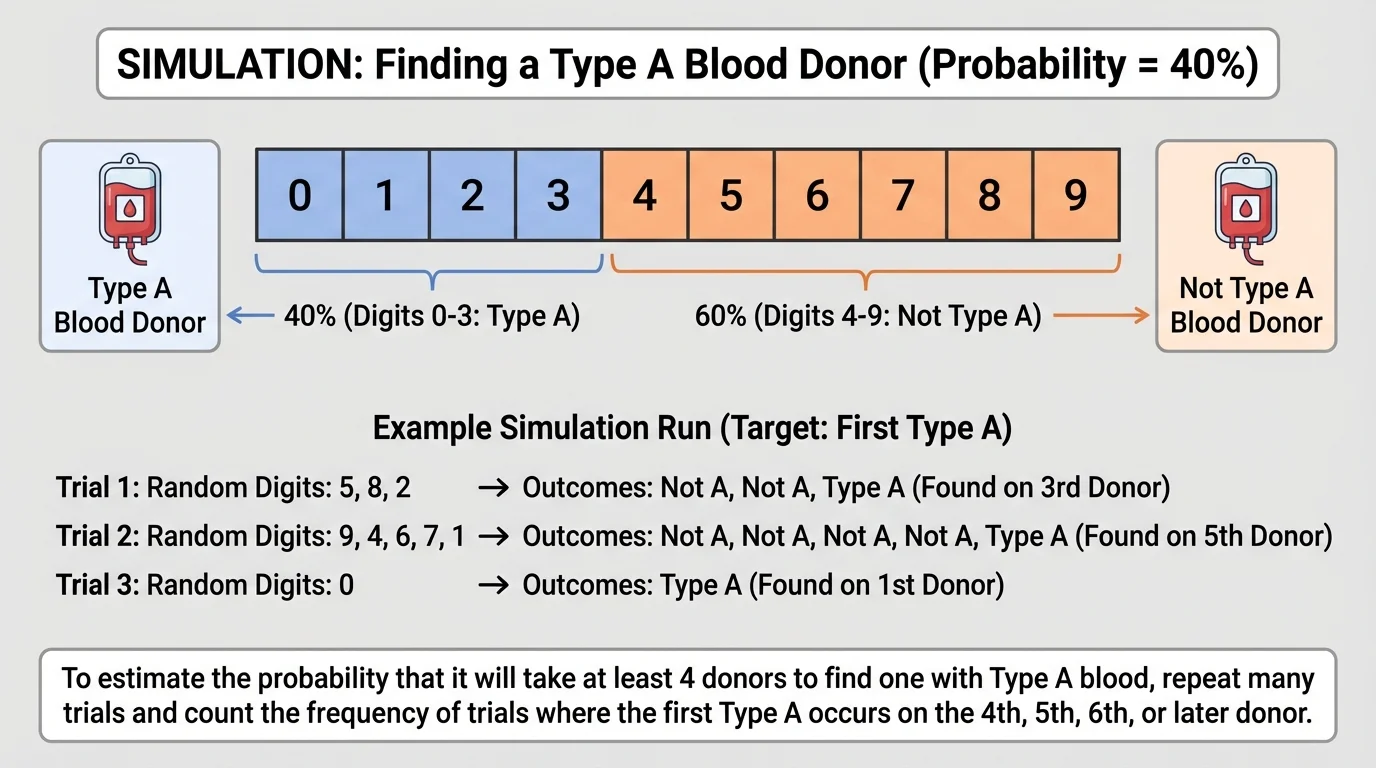
Now each random digit represents one donor. If the digit is 0, 1, 2, or 3, then that donor has type A blood. If the digit is 4, 5, 6, 7, 8, or 9, then that donor does not have type A blood. A string of random digits can model several donors in a row.
For example, suppose the random digits begin 7, 8, 2. The first donor is not type A, the second donor is not type A, and the third donor is type A. So in that trial, it takes 3 donors to find one with type A blood.
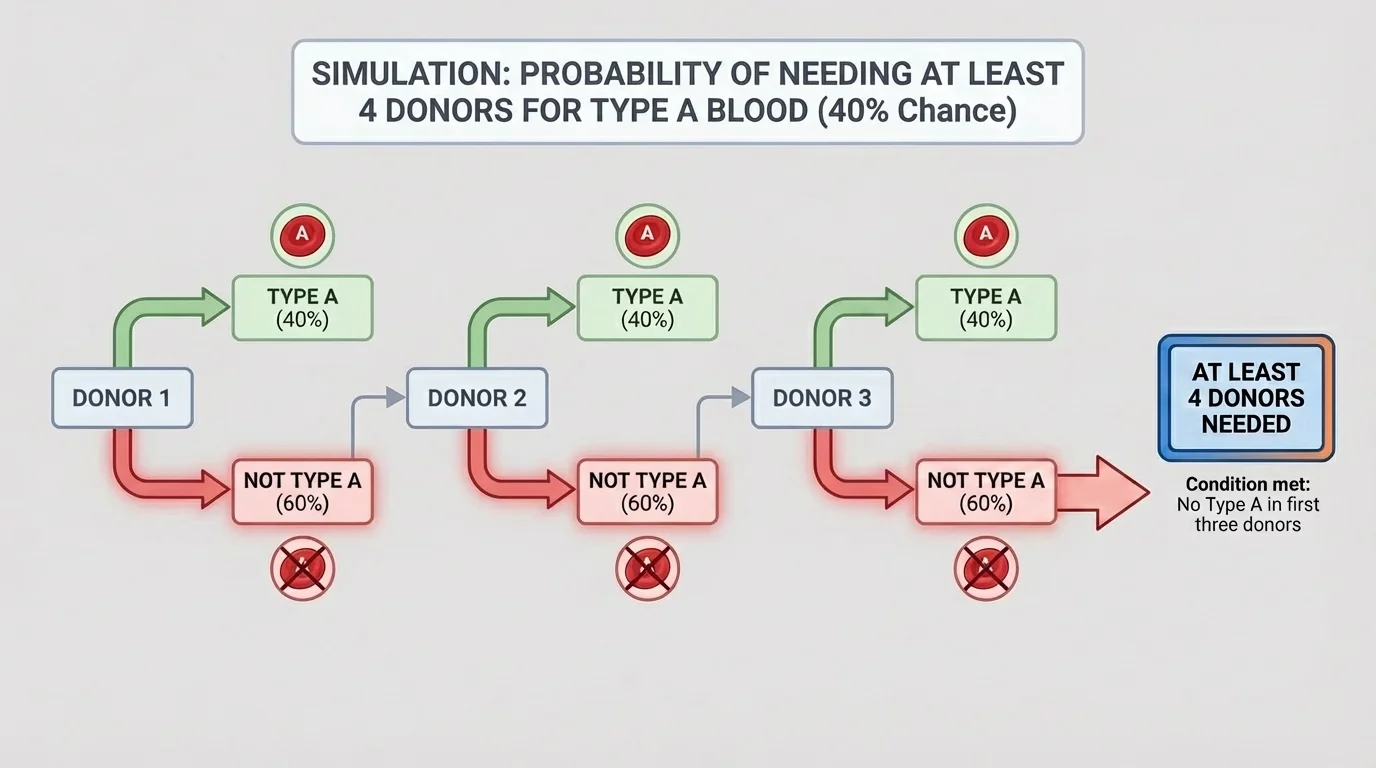
The question asks: If 40% of donors have type A blood, what is the probability that it will take at least 4 donors to find one with type A blood? In simulation language, this means the first three donors must all be not type A, as [Figure 2] illustrates with the sequence of donor checks.
Using our digit assignment, a successful trial happens when the first three random digits are all from the set 4, 5, 6, 7, 8, 9. After that, we do not even need to know the next digit to answer the question, because once the first three donors are not type A, it already takes at least 4 donors to find one with type A blood.
Look at these sample trials:
7, 6, 8, 1 is a success because the first three digits are all not type A, so it takes at least 4 donors.
5, 0 is not a success because the second donor is type A, so it only takes 2 donors.
9, 4, 7, 5, 2 is a success because the first three donors are not type A. In fact, the first type A donor appears on the fifth donor, which is still "at least 4 donors."
This is an important idea: "at least 4" includes 4, 5, 6, and any larger number. It does not mean exactly 4.
Turning words into an event
Many probability questions are easier when you rewrite the words as a clear event. Here, "it takes at least 4 donors to find one with type A blood" becomes "the first three donors are not type A." That shorter statement is the event your simulation is testing.
Once the event is written clearly, you can decide what counts as a success in every trial. That makes it much easier to avoid mistakes when you run many trials.
To estimate the probability, you need many trials. As shown in [Figure 3], in each trial, read random digits one at a time until the result is clear. For this question, you can stop after the first three digits. If all three are not type A, record a success. If any of the first three digits shows type A, record not a success.
It helps to organize the results in a table. A table keeps track of the trial number, the random digits used, and whether the event happened.
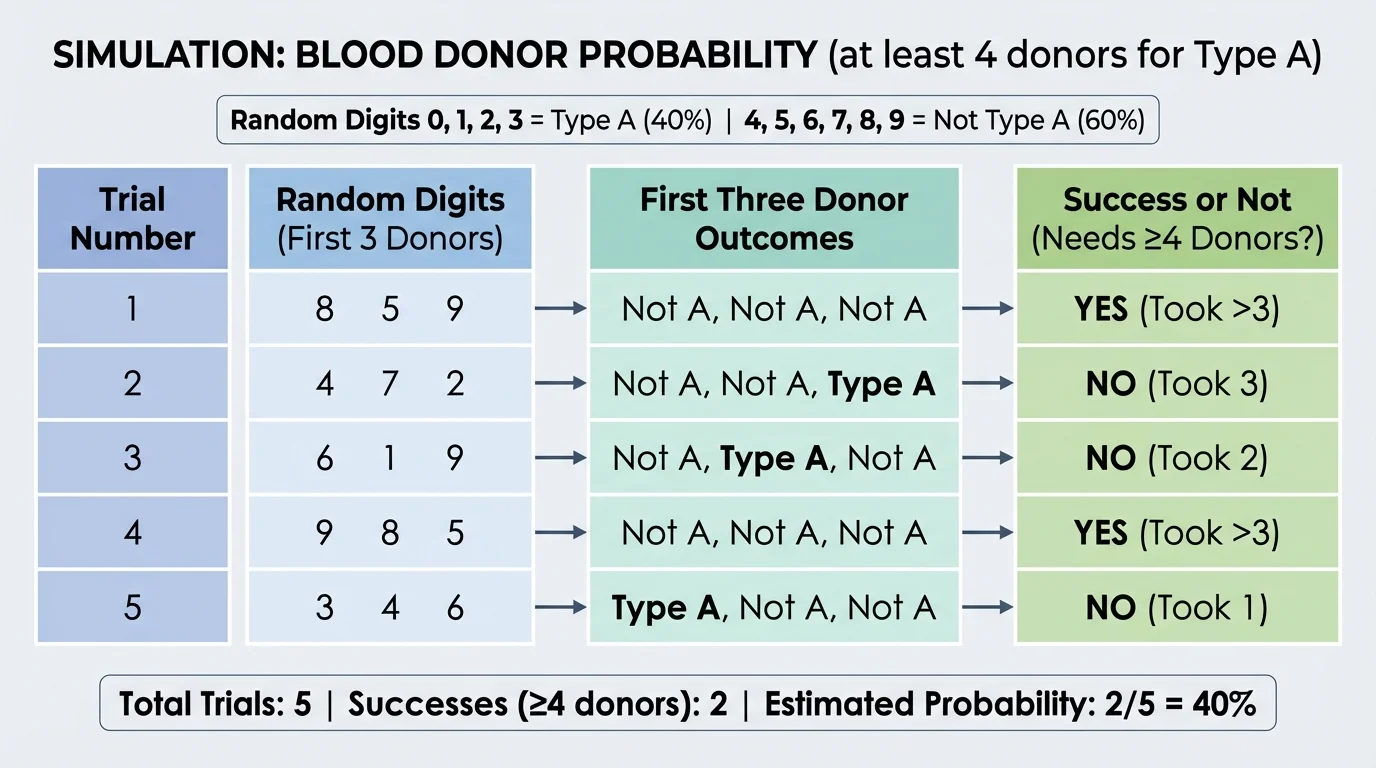
| Trial | First 3 Digits | Outcome | Success? |
|---|---|---|---|
| 1 | 7, 8, 6 | not A, not A, not A | Yes |
| 2 | 1, 9, 5 | A appears on donor 1 | No |
| 3 | 4, 5, 2 | A appears on donor 3 | No |
| 4 | 9, 6, 7 | not A, not A, not A | Yes |
| 5 | 5, 8, 4 | not A, not A, not A | Yes |
Table 1. Sample recording table for trials in the blood donor simulation.
After many trials, calculate the relative frequency of success:
\(\textrm{relative frequency} = \dfrac{\textrm{number of successes}}{\textrm{total number of trials}}\)
Suppose you run 50 trials and get 11 successes. Then the estimated probability is \(\dfrac{11}{50} = 0.22\). That means the simulation suggests the probability is about 22%.
Even when two students run correct simulations for the same problem, they may not get exactly the same answer. Chance creates small differences, but with more trials the estimates usually become more stable.
For that reason, a simulation with 10 trials is much less reliable than one with 100 trials. More trials usually produce a better estimate.
Worked example 1
Use the random-digit model to decide whether the trial 8, 5, 6, 1 is a success for the blood donor question.
Step 1: Recall the rule for success.
A success means the first three donors are not type A.
Step 2: Translate the digits.
Digits 4, 5, 6, 7, 8, 9 mean not type A, and digits 0, 1, 2, 3 mean type A.
Step 3: Check the first three digits.
The first three digits are 8, 5, 6, and all three mean not type A.
So this trial is a success. It takes at least 4 donors to find one with type A blood.
This example shows that you only need to focus on the first three digits. The fourth digit is not needed to decide whether the event happened.
Worked example 2
A student runs 20 trials and records 4 successes. Estimate the probability that it takes at least 4 donors to find one with type A blood.
Step 1: Write the relative frequency.
The estimate is \(\dfrac{\textrm{successes}}{\textrm{trials}} = \dfrac{4}{20}\).
Step 2: Simplify.
\(\dfrac{4}{20} = \dfrac{1}{5} = 0.20\).
Step 3: Convert to a percent if needed.
\(0.20 = 20\%\).
The estimated probability is 0.20, or 20%.
Because the number of trials is not very large, another student might get a slightly different estimate. That is normal in simulation work.
Worked example 3
Suppose 30% of a store's light bulbs are defective. Design a random-digit simulation for the probability that the first two bulbs tested are both not defective.
Step 1: Assign digits.
Since \(30\% = \dfrac{3}{10}\), let digits 0, 1, 2 mean defective and digits 3, 4, 5, 6, 7, 8, 9 mean not defective.
Step 2: Describe one trial.
Read two random digits. Each digit represents one bulb tested.
Step 3: Define success.
A success happens when both digits are from 3, 4, 5, 6, 7, 8, 9.
This is a correct simulation because the digit assignments match the given percentages and the event matches the question.
Notice that the light bulb question is also a compound event because it combines two chance results in order.
Worked example 4
In a game, a player has a 60% chance of making a free throw. Use random digits to model the probability that the player misses the first two shots.
Step 1: Assign digits.
Let digits 0, 1, 2, 3, 4, 5 mean make, since \(60\% = \dfrac{6}{10}\). Let digits 6, 7, 8, 9 mean miss.
Step 2: Define one trial.
Read two random digits, one for each shot.
Step 3: Define success.
A success means both digits are from 6, 7, 8, 9.
Step 4: Test a sample trial.
If the digits are 7, 9, then both shots are misses, so the trial is a success.
The simulation is built by matching digits to probabilities and then matching the success rule to the question.
Once you can build the model and define success clearly, you can handle many similar problems involving repeated events.
For the blood donor problem, the exact probability can also be found. Since 60% of donors are not type A, the probability that the first three donors are all not type A is \((0.60)(0.60)(0.60)\). As [Figure 4] shows, this section compares the simulation estimate to that exact value.
Compute the product:
\((0.60)^3 = 0.216\)
So the exact probability is
\(P(\textrm{at least 4 donors}) = 0.216\)
This means the true probability is 21.6%. A simulation might give 0.22 or 0.20 or 0.24, depending on the trials. Those are all reasonable estimates if enough trials are used.
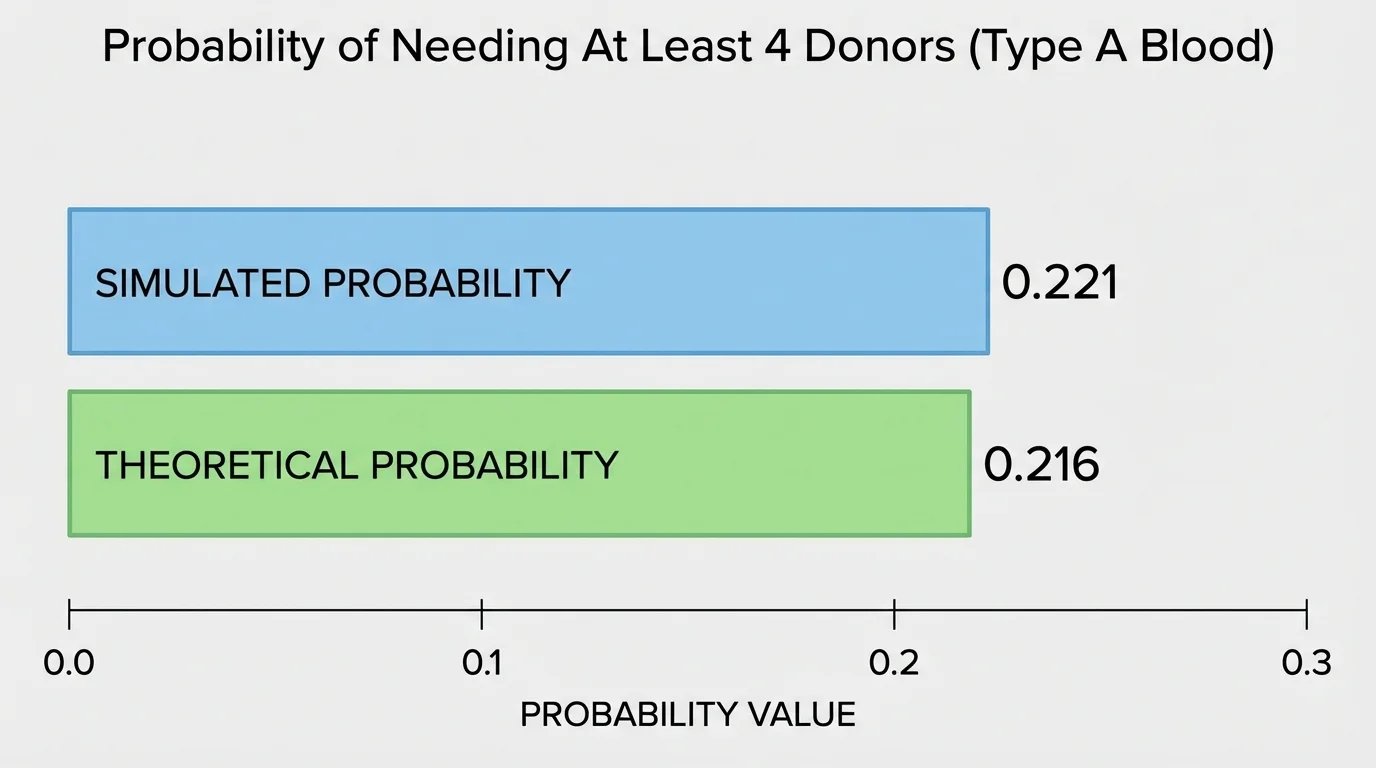
As we saw earlier with the recording table in [Figure 3], simulation organizes data from repeated trials. Then, as the comparison in [Figure 4] shows, the relative frequency can be checked against the theoretical value when one is available.
Simulation is especially useful because it helps students understand why the exact probability makes sense. If many trials keep producing values near 0.216, that supports the theoretical result.
Simulation is not just a classroom method. Medical researchers use simulations to study treatment outcomes. Manufacturers simulate defects in products. Meteorologists simulate storms and weather patterns. Sports analysts simulate seasons to estimate playoff chances.
In health care, the blood donor example matters because supplies of different blood types are not equally common. A simulation can help model how often a patient might need to wait for a matching donor or how large a donor pool a hospital may need.
In quality control, a factory might ask how likely it is that the first three items tested are all non-defective. That question has the same structure as the blood donor problem: repeated trials, two possible outcomes, and a probability estimate based on simulation.
"Chance patterns become clearer when we observe many trials, not just one."
This idea is one reason simulation is so useful. A single event can be surprising, but many events together often reveal the long-term pattern.
One common mistake is assigning the wrong number of digits to each outcome. If 40% of donors have type A blood, then exactly 4 of the 10 digits should represent type A. Using 5 digits would model 50%, which is incorrect.
Another mistake is misunderstanding the phrase "at least 4 donors." It does not mean exactly 4 donors. A trial where the first type A donor appears on donor 5 still counts as a success.
A third mistake is not keeping a consistent stopping rule. For this problem, you can stop each trial after checking the first three digits because that is enough to decide success or failure. If you keep reading digits in some trials but not others without a clear rule, your data may become confusing.
Why more trials matter
Short simulations can swing a lot because chance variation has a stronger effect in small samples. As the number of trials increases, the relative frequency usually settles closer to the true probability. This is why 100 trials often give a better estimate than 10 trials.
Careful recording also matters. If you mislabel just a few trials, your estimate can change. Organized lists, tables, and clear success rules make your simulation much more reliable.
A simulation estimate is an approximation, not a guarantee. If one simulation gives 0.19 and another gives 0.23, that does not mean one must be wrong. It means both are affected by random variation.
What matters most is whether the simulation matches the real probability model and whether it uses enough trials. A good simulation is fair, follows the event carefully, and is repeated many times.
For the blood donor question, the most important thinking step is translating the words into the event "the first three donors are not type A." Once you recognize that, the simulation becomes straightforward: assign digits fairly, run many trials, count successes, and use relative frequency to estimate probability.