A company may show its profit with a graph, a scientist may record data in a table, and an engineer may write a formula. All three are describing relationships, but they do not look the same. That is exactly why comparing functions is powerful: you are not just reading math in one format, you are learning to recognize the same ideas no matter how they appear.
A function connects each input to exactly one output. But the same function can be represented in several ways: with an equation, with points on a graph, with a numerical table, or with a verbal rule. In real work, people often switch among these forms because each one highlights different features. An equation may show exact structure, a graph may show overall shape, and a table may reveal patterns.
When you compare two functions shown in different ways, your goal is not to force them into the same form immediately. Instead, you look for the properties of a function that matter for the question being asked. For example, if the question asks which function has the larger maximum, then the key feature is the highest output value. If the question asks which grows faster, then the key feature is the rate of change.
You already know that a point \(x, y\) on a graph means that when the input is \(x\), the output is \(y\). You also know that in a table, pairs of values work the same way. This idea stays true in every representation.
One of the most important skills in high school algebra is learning to see through the representation and focus on the relationship itself. Two functions may look completely different on the page but still be compared by the same set of questions: What is the output when \(x = 0\)? Where is the function increasing? Does it have a maximum or minimum? What happens as \(x\) gets very large or very small?
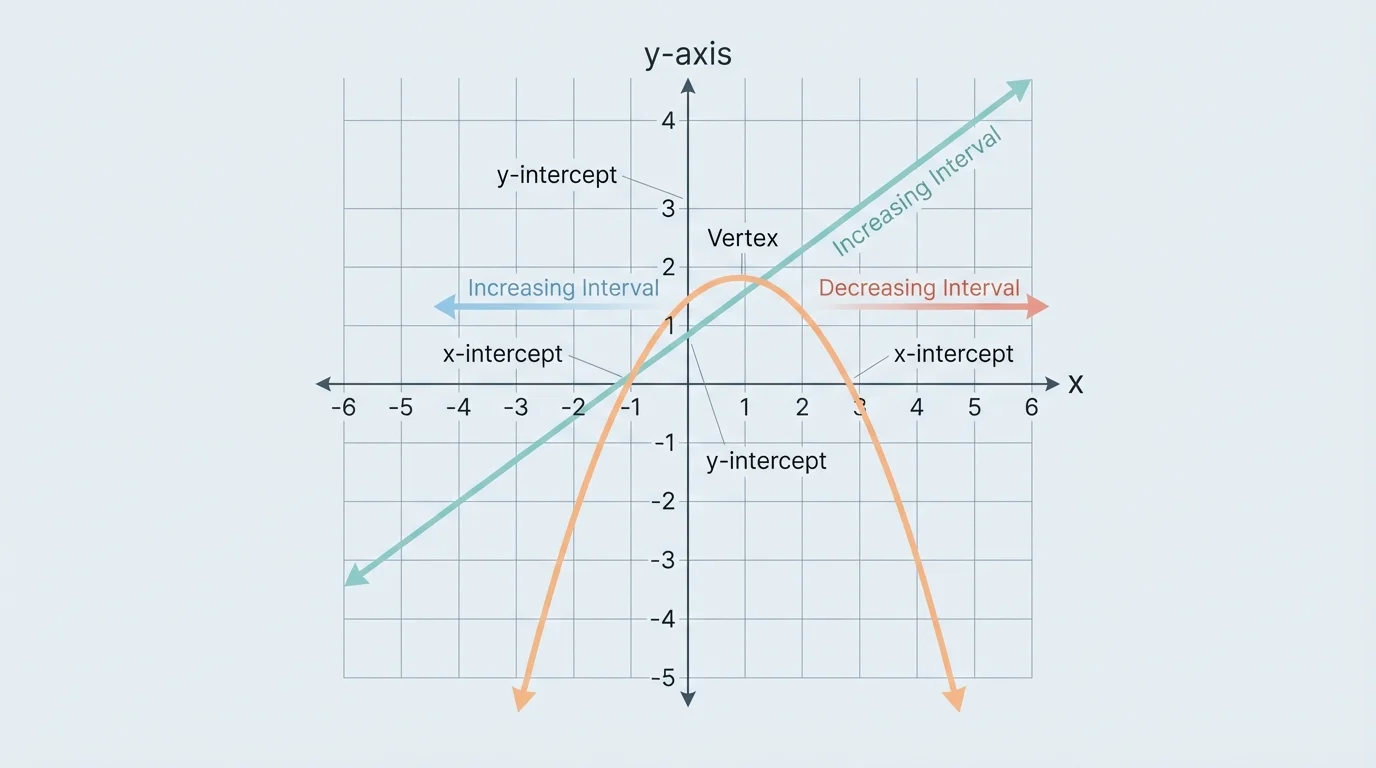
Several features appear again and again when comparing functions. These key features can often be located quickly, as [Figure 1] shows for a graph with labeled turning points and intercepts. The most common properties are the domain, range, x-intercepts, y-intercept, maximum or minimum value, intervals where the function is increasing or decreasing, and average rate of change over an interval.
A maximum value is the greatest output of the function on the domain being considered. A minimum value is the least output. For a quadratic that opens downward, the vertex gives a maximum. For a quadratic that opens upward, the vertex gives a minimum. Some functions, such as many linear functions, have neither a maximum nor a minimum over all real numbers.
An intercept is where the graph crosses an axis. The x-intercepts are the points where \(y = 0\), and the y-intercept is where \(x = 0\). An interval of increase is a set of \(x\)-values over which the outputs rise as inputs increase. An interval of decrease is where outputs fall as inputs increase.
Sometimes you compare an exact value, and sometimes you compare a trend. For instance, one function might have a greater value at \(x = 5\), but another might have a greater average rate of change from \(x = 1\) to \(x = 5\). The question determines which property matters most.
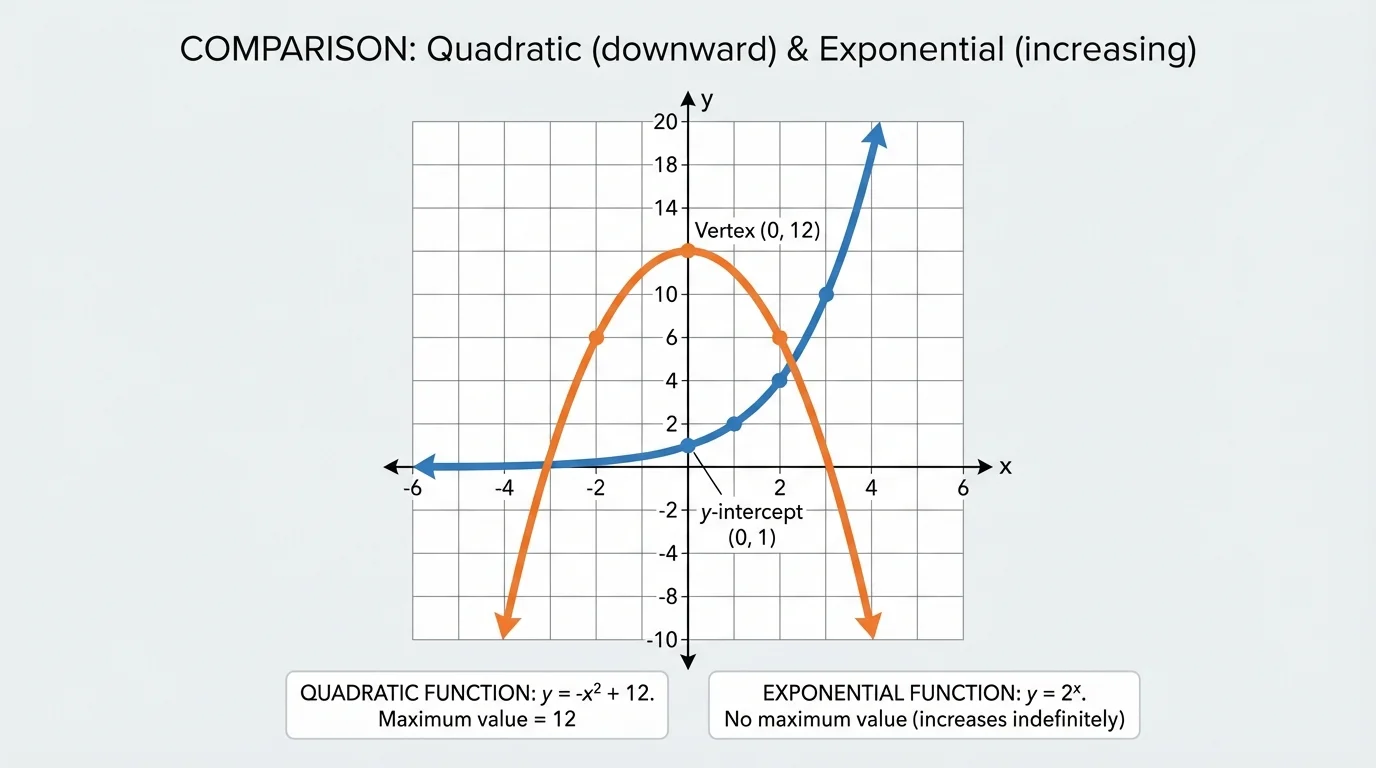
Another useful idea is end behavior: what the function does as \(x\) becomes very large positive or very large negative. This matters when comparing long-term behavior. For example, an exponential function may eventually exceed a linear function even if the linear function starts larger.
Function representations are different ways of showing the same input-output relationship. Algebraic representation uses an equation, graphical representation uses points on a coordinate plane, numerical representation uses a table of values, and verbal representation describes the rule in words.
When comparing functions, strong reasoning means naming the property and then citing the evidence from the representation. A convincing statement sounds like this: "The quadratic shown on the graph has a maximum of \(9\), while the quadratic given by the equation has a vertex at \((2, 7)\), so the graphed function has the larger maximum."
An equation often gives exact information, but you need to know what to look for. For a linear function written as \(f(x) = mx + b\), the slope \(m\) tells the constant rate of change, and \(b\) gives the \(y\)-intercept. If \(m > 0\), the function is increasing; if \(m < 0\), it is decreasing.
For a quadratic in vertex form, \(f(x) = a(x - h)^2 + k\), the vertex is \((h, k)\). If \(a > 0\), the graph opens upward and has a minimum at \(y = k\). If \(a < 0\), the graph opens downward and has a maximum at \(y = k\). This form is especially useful when comparing maximums and minimums.
For example, in \(g(x) = -2(x - 3)^2 + 11\), the vertex is \((3, 11)\). Since the coefficient of the squared term is negative, the parabola opens downward. Therefore, the maximum value is \(11\).
If a quadratic is written in standard form, such as \(f(x) = ax^2 + bx + c\), the \(y\)-intercept is easy to find because it is \(c\). To find the vertex, you can use \(x = -\dfrac{b}{2a}\). Then substitute that \(x\)-value back into the function.
Exponential functions also reveal important behavior from equations. In a function such as \(h(x) = 3(1.5)^x\), the output grows because the base \(1.5\) is greater than \(1\). In \(p(x) = 8(0.7)^x\), the outputs shrink because the base is between \(0\) and \(1\). These patterns matter when comparing growth or decay.
A graph gives an immediate picture of shape and behavior. Careful reading of the axes, scale, and turning points matters, as [Figure 2] illustrates with two functions on the same coordinate plane. From a graph, you can often estimate intercepts, identify increasing and decreasing intervals, and compare maximum or minimum values quickly.
For a quadratic graph, the vertex is the turning point. If it is the highest point, the function has a maximum. If it is the lowest point, the function has a minimum. On a graph, the maximum or minimum may be exact if the point is clearly marked, or approximate if you must estimate from the grid.
Suppose one graph has a vertex at about \((1, 6)\). Then its maximum value is about \(6\) if the parabola opens downward, or its minimum value is about \(6\) if the parabola opens upward. The word "about" matters when the graph does not provide exact coordinates.
Graphs also help with visual comparison. If two functions are drawn on the same axes, you can compare which one is larger for a given input by seeing which graph lies higher. But be careful: "higher" only tells you about the outputs for the same \(x\)-value. It does not automatically tell you which function has the larger maximum or faster growth overall.
Scale can change everything. A graph with uneven or unfamiliar axis spacing can mislead you if you do not read the labels. Later, when comparing data from tables or equations, the same caution applies: evidence must come from actual values, not from appearance alone.
Stock market analysts, epidemiologists, and climate scientists often compare relationships in mixed forms. One report may give a graph, another a formula, and another a data table, but the comparison questions are still about rates, peaks, and long-term trends.
The visual insight from [Figure 1] stays useful here: turning points, intercepts, and slope direction are not separate facts. They work together to describe how a function behaves.
Tables may seem less dramatic than graphs, but they can be extremely informative. Numerical patterns and verbal clues often reveal a function's behavior before you ever draw it, as [Figure 3] shows with both a data table and a described situation.
In a table, the \(y\)-intercept appears when \(x = 0\). For a linear function, equal changes in \(x\) produce equal changes in \(y\). For example, if every time \(x\) increases by \(1\), \(y\) increases by \(4\), then the rate of change is \(4\).
Quadratic patterns often appear through first and second differences. If the first differences are not constant but the second differences are constant, the data may represent a quadratic relationship. A table can also reveal a maximum or minimum if the outputs rise and then fall, or fall and then rise.
Verbal descriptions require translation. If a problem says, "The height of the ball increases, reaches a peak, and then falls," that describes a function with a maximum. If it says, "The amount of medicine in the bloodstream decreases by the same percent each hour," that suggests exponential decay.
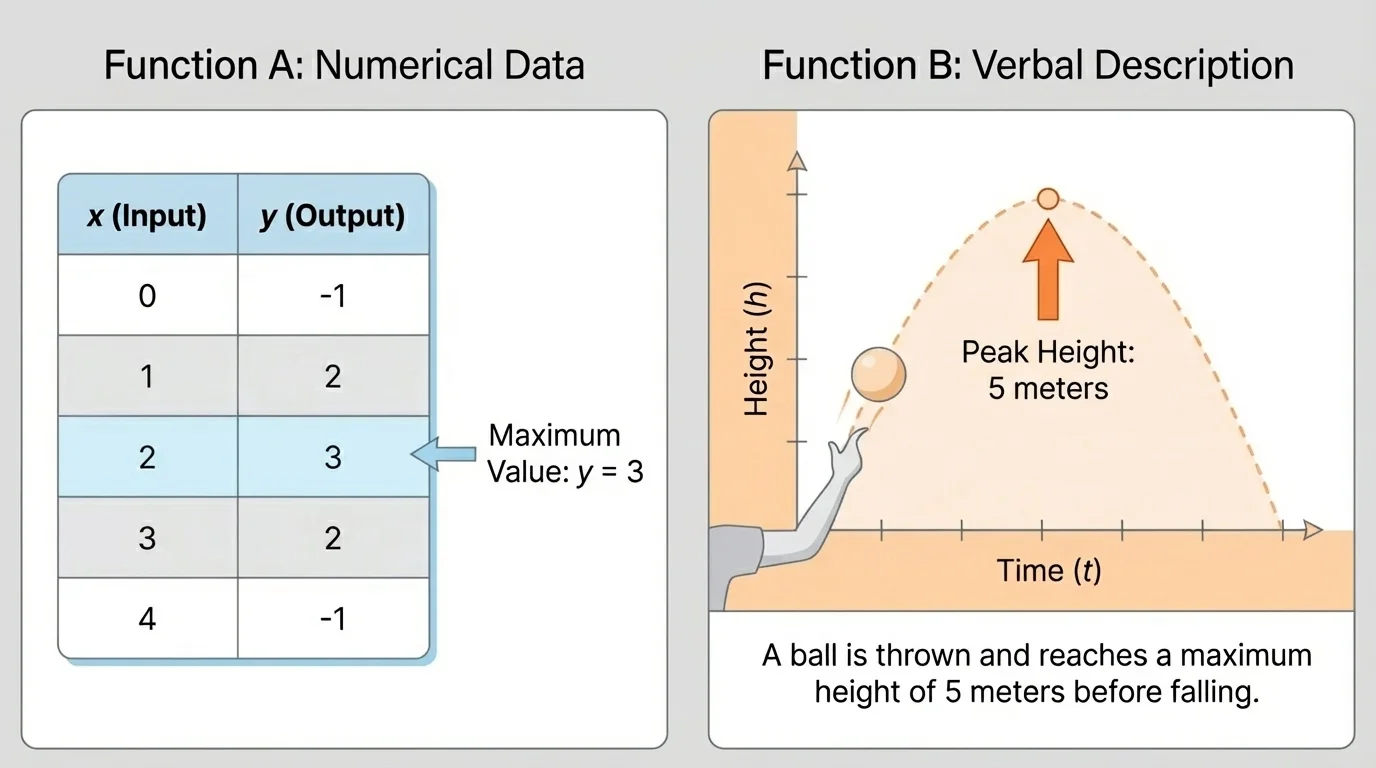
For mixed comparisons, you may need to infer a property rather than read it directly. For example, a table may not list the exact maximum, but if the values near the center are highest and the pattern is symmetric, you may be able to identify it. In a verbal description, words such as "constant rate," "twice as much," "peak," or "lowest" signal the kind of behavior to expect.
When functions appear in different forms, it helps to use a repeatable method, as [Figure 4] outlines. A good comparison is organized, evidence-based, and focused on the exact property named in the question.
Step 1: Identify what property you are comparing. Is it a maximum, a minimum, an intercept, a rate of change, a value at a certain input, or end behavior?
Step 2: Read that property from each representation as directly as possible. From an equation, use algebra. From a graph, estimate carefully. From a table, look for the relevant row or pattern. From a verbal description, translate the words into mathematical meaning.
Step 3: If necessary, convert one representation into another form mentally or by calculation. For instance, you might calculate the vertex of a quadratic from its equation so that it can be compared to a graph's peak.
Step 4: State the conclusion clearly and support it with values. If one value is exact and the other is approximate, say so.
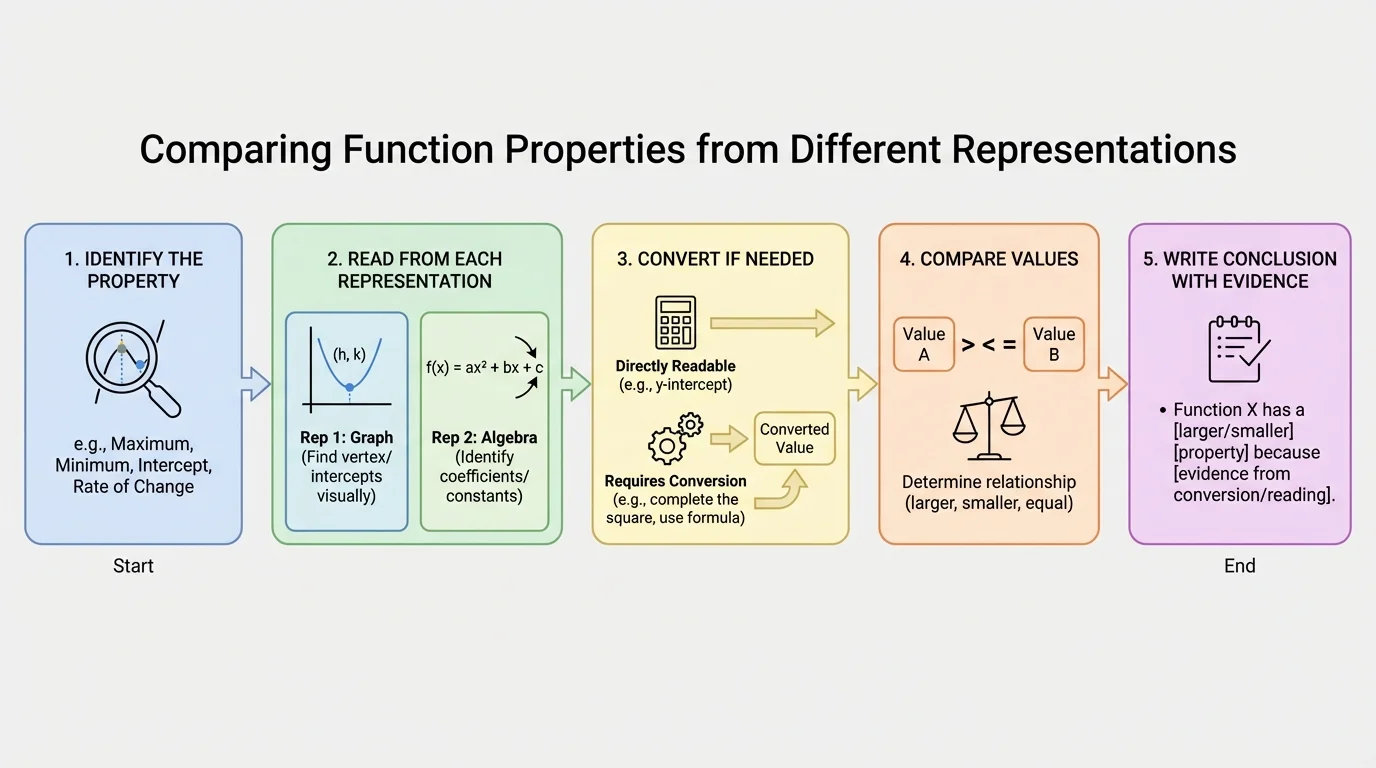
This process prevents a common mistake: comparing the wrong feature. A student may be tempted to compare \(y\)-intercepts when the question is really asking about maximums. The property named in the question decides the method.
Now consider how these ideas work in specific comparisons. Notice that each solution begins by identifying the property to compare.
Worked Example 1: Graph versus equation
One quadratic function is shown on a graph with a highest point at \((2, 8)\). Another is given by \(f(x) = -(x + 1)^2 + 5\). Which function has the larger maximum?
Step 1: Identify the maximum of the graphed function.
The graph's highest point is \((2, 8)\), so its maximum value is \(8\).
Step 2: Identify the maximum of the algebraic function.
The equation \(f(x) = -(x + 1)^2 + 5\) is in vertex form. Its vertex is \((-1, 5)\). Because the coefficient of the squared term is negative, the parabola opens downward, so the maximum value is \(5\).
Step 3: Compare the maximum values.
\(8 > 5\), so the graphed function has the larger maximum.
Conclusion: The function shown on the graph has the larger maximum.
The important move here is recognizing that both representations reveal the same type of feature: the vertex. The graph gives it visually, while the equation gives it structurally.
Worked Example 2: Table versus verbal description
Function \(A\) is given by the table below: when \(x = 0, 1, 2, 3\), the outputs are \(4, 7, 10, 13\). Function \(B\) is described as "starts at \(2\) and increases by \(4\) for every increase of \(1\) in \(x\)." Which function has the greater rate of change?
Step 1: Find the rate of change of Function \(A\).
The outputs increase by \(3\) each time: \(7 - 4 = 3\), \(10 - 7 = 3\), and \(13 - 10 = 3\). So the rate of change is \(3\).
Step 2: Find the rate of change of Function \(B\).
The description says it increases by \(4\) for each increase of \(1\) in \(x\), so its rate of change is \(4\).
Step 3: Compare.
\(4 > 3\), so Function \(B\) has the greater rate of change.
Conclusion: Function \(B\) changes faster.
Notice that a table and a verbal description may hide the same idea in different ways. In a table, rate of change is found from differences; in words, it may be stated directly.
Worked Example 3: Equation versus equation in a different form
Compare the minimum values of \(f(x) = 2(x - 4)^2 - 1\) and \(g(x) = x^2 - 6x + 13\).
Step 1: Find the minimum of \(f\).
The function is in vertex form. Its vertex is \((4, -1)\). Because \(2 > 0\), the parabola opens upward, so the minimum value is \(-1\).
Step 2: Find the minimum of \(g\).
For \(g(x) = x^2 - 6x + 13\), use \(x = -\dfrac{b}{2a}\). Here \(a = 1\) and \(b = -6\), so \(x = -\dfrac{-6}{2 \cdot 1} = 3\).
Now substitute: \(g(3) = 3^2 - 6(3) + 13 = 9 - 18 + 13 = 4\).
So the minimum value of \(g\) is \(4\).
Step 3: Compare.
\(-1 < 4\), so \(f\) has the smaller minimum value.
Conclusion: \(f(x)\) has the lower minimum.
This example shows that even when both functions are algebraic, different forms may require different methods. One vertex is immediate, while the other must be calculated.
Worked Example 4: Approximate graph versus exact table value
A graphed function appears to have a \(y\)-intercept of about \(6.5\). A table for another function shows that when \(x = 0\), \(y = 6\). Which function has the greater \(y\)-intercept?
Step 1: Identify the intercepts.
The graph gives an approximate \(y\)-intercept of \(6.5\). The table gives an exact \(y\)-intercept of \(6\).
Step 2: Compare the values.
\(6.5 > 6\), so the graphed function has the greater \(y\)-intercept.
Step 3: State the conclusion carefully.
Because the graph is estimated, it is best to say the graphed function appears to have the greater \(y\)-intercept.
Conclusion: The graphed function has the greater \(y\)-intercept, based on the graph's estimate.
The reference to [Figure 2] matters here: graph-based answers can be approximate, so reading scales and labels carefully is part of mathematical precision.
One common error is comparing outputs at one specific input when the question asks for a maximum or minimum over the whole graph. For example, if one function has a value of \(10\) at \(x = 2\), that does not mean its maximum is \(10\).
Another mistake is assuming that a graph always gives exact values. Unless coordinates are clearly marked, graphs often provide estimates. Tables and equations may provide more exact information.
Students also sometimes mix up average rate of change with instantaneous rate of change. In this topic, you usually compare average change over an interval unless the representation and question clearly indicate otherwise.
Finally, be careful with domain. A function might have a maximum on a restricted interval but not on all real numbers. Words such as "for \(0 \leq x \leq 10\)" change the answer.
Businesses compare functions all the time. One company may model profit with an equation, while another presents profit over time on a graph. A manager might need to decide which product reaches a higher maximum profit or which one grows faster in the first six months.
In physics, a graph might show the height of a projectile over time, while an equation models another projectile. Comparing the maximum heights tells which object rises higher. This is the same reasoning as comparing vertices of quadratic functions.
In medicine, a table may record the concentration of a drug in the bloodstream each hour, while a verbal description may say a second drug decays by \(20\%\) per hour. Doctors and researchers compare which medicine remains above an effective level longer. That comparison involves reading values, rate of decrease, and sometimes end behavior.
In sports analytics, a coach may see one athlete's performance trend in a graph and another's in a table. The question may be which athlete is improving faster or which performance peaked higher. The representation changes, but the mathematics of comparison stays the same.
| Representation | Best for Seeing | Possible Limitation |
|---|---|---|
| Equation | Exact structure, intercept formulas, vertex calculations, rates | May require algebraic work to reveal features |
| Graph | Overall shape, turning points, intervals, visual comparisons | Values may be approximate |
| Table | Numerical patterns, repeated differences, specific values | May not show full behavior outside listed inputs |
| Verbal description | Context and meaning of change | Requires translation into mathematical properties |
Table 1. Strengths and limitations of four common function representations.
By the time you can compare functions across these forms, you are doing more than reading math. You are interpreting evidence, choosing efficient methods, and explaining why one relationship behaves differently from another. That is the kind of thinking used in science, economics, technology, and advanced mathematics.