Video games track scores, maps use locations, and fitness apps record steps over time. All of these ideas use the power of placing information in the right spot. In math, one simple but powerful tool for this is the coordinate plane. When you graph points, you can turn numbers into pictures that are easier to understand.
In grade 5, you focus on points in the first quadrant. That means you use positive numbers for both directions. You can graph real situations, such as how many pages you read in a certain number of days, or how many laps you run in a certain amount of time. Then you can look at a point and explain exactly what it means.
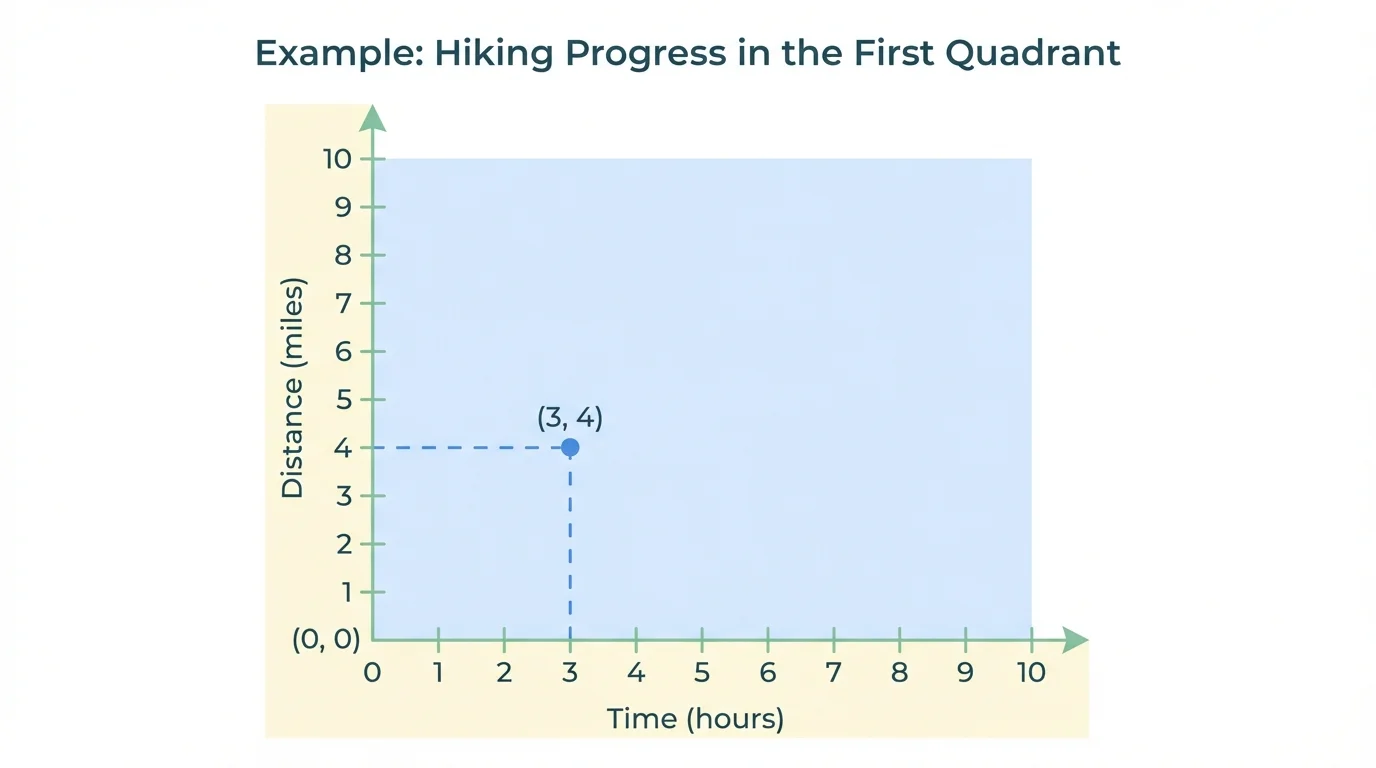
The coordinate plane, as shown in [Figure 1], is a flat grid made by two number lines that cross. The horizontal number line is called the x-axis, and the vertical number line is called the y-axis. The place where they cross is called the origin.
In this lesson, you work only in the first quadrant on graphs. In the first quadrant, numbers go to the right on the x-axis and up on the y-axis. So if a point has coordinates \((3,4)\), you move \(3\) units right and \(4\) units up.
Coordinate plane: a graph made from two number lines that cross.
x-axis: the horizontal number line.
y-axis: the vertical number line.
Origin: the point where the axes cross, written as \((0,0)\).
First quadrant: the top-right part of the coordinate plane where both coordinates are positive.
Ordered pair: two numbers written in a specific order to name a point, such as \((2,5)\).
The order of the numbers matters. The first number tells how far to move along the x-axis. The second number tells how far to move along the y-axis. If you switch them, you usually get a different point.
A point on a coordinate plane is named by an ordered pair. An ordered pair is written with parentheses and a comma, like \((x,y)\). The first number is the x-coordinate, and the second number is the y-coordinate.
For example, the point \((5,2)\) means move \(5\) units to the right and \(2\) units up. The point \((2,5)\) means move \(2\) units to the right and \(5\) units up. Even though both points use the numbers \(2\) and \(5\), they are not in the same place.
This is why the pair is called ordered. The order tells you exactly where the point belongs. Think of it as a set of directions: first across, then up.
When you read a number line, you count spaces carefully. The same idea is used on the coordinate plane. Start at \((0,0)\), count right on the x-axis, then count up on the y-axis.
You may also see points labeled with capital letters. For example, point \(A\) could be at \((1,4)\), and point \(B\) could be at \((6,3)\). The letter names the point, and the ordered pair tells its location.
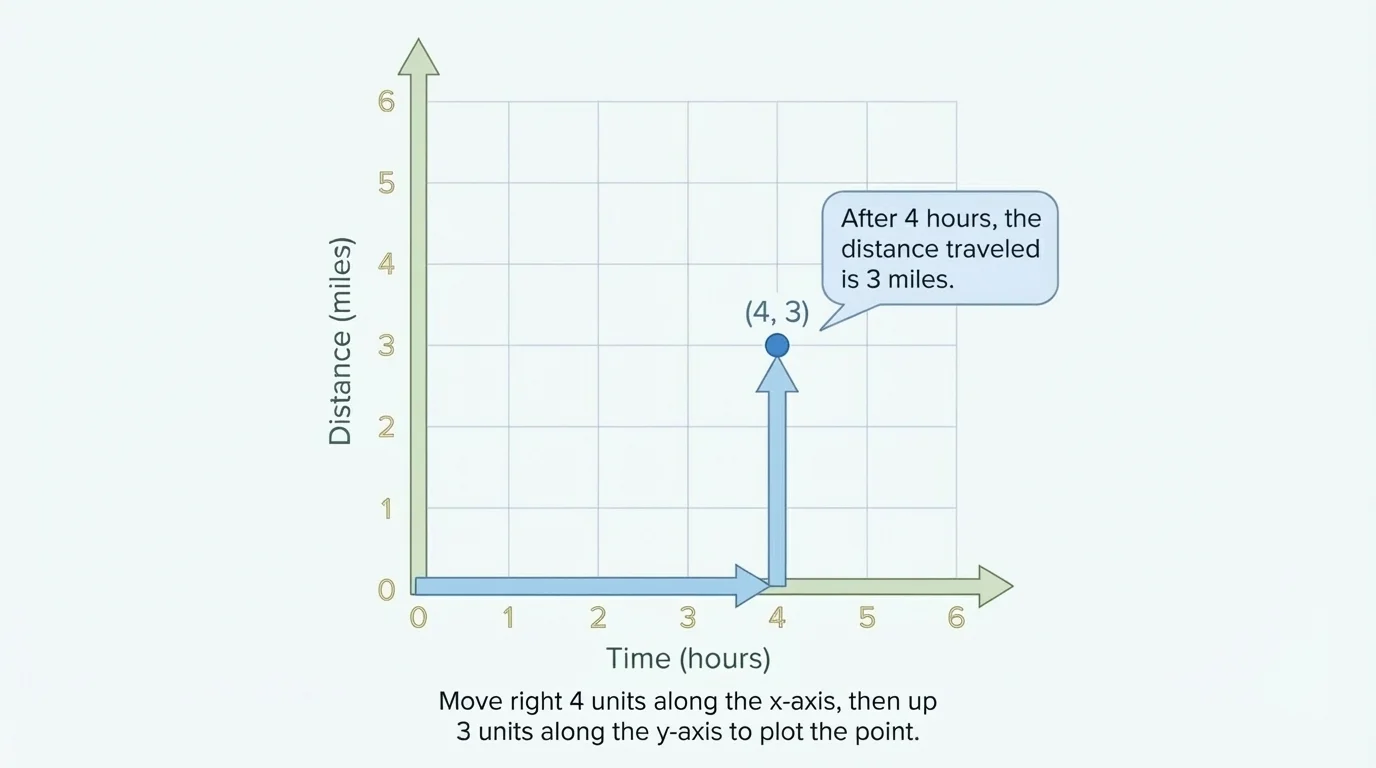
To graph a point means to place it correctly on the coordinate plane. [Figure 2] The plotting process is simple: start at the origin, move right to the x-coordinate, and then move up to the y-coordinate.
Suppose you want to graph \((4,3)\). Start at \((0,0)\). Move \(4\) units to the right on the x-axis. Then move \(3\) units up. Put a dot there. That dot is the point \((4,3)\).
If the point is \((7,1)\), you move farther right and only a little up. If the point is \((2,6)\), you move a short distance right and a longer distance up. Every ordered pair gives its own location.
Why the axes need labels
On many real-world graphs, the x-axis and y-axis do not just show numbers. They show what the numbers mean. For example, the x-axis might represent days and the y-axis might represent pages read. A point like \((3,20)\) then means \(20\) pages after \(3\) days, not just a random location on a grid.
Labels are extremely important. Without labels, you may know where a point is, but you may not know what the point represents. In real problems, a graph is useful only when you connect the numbers to the situation.
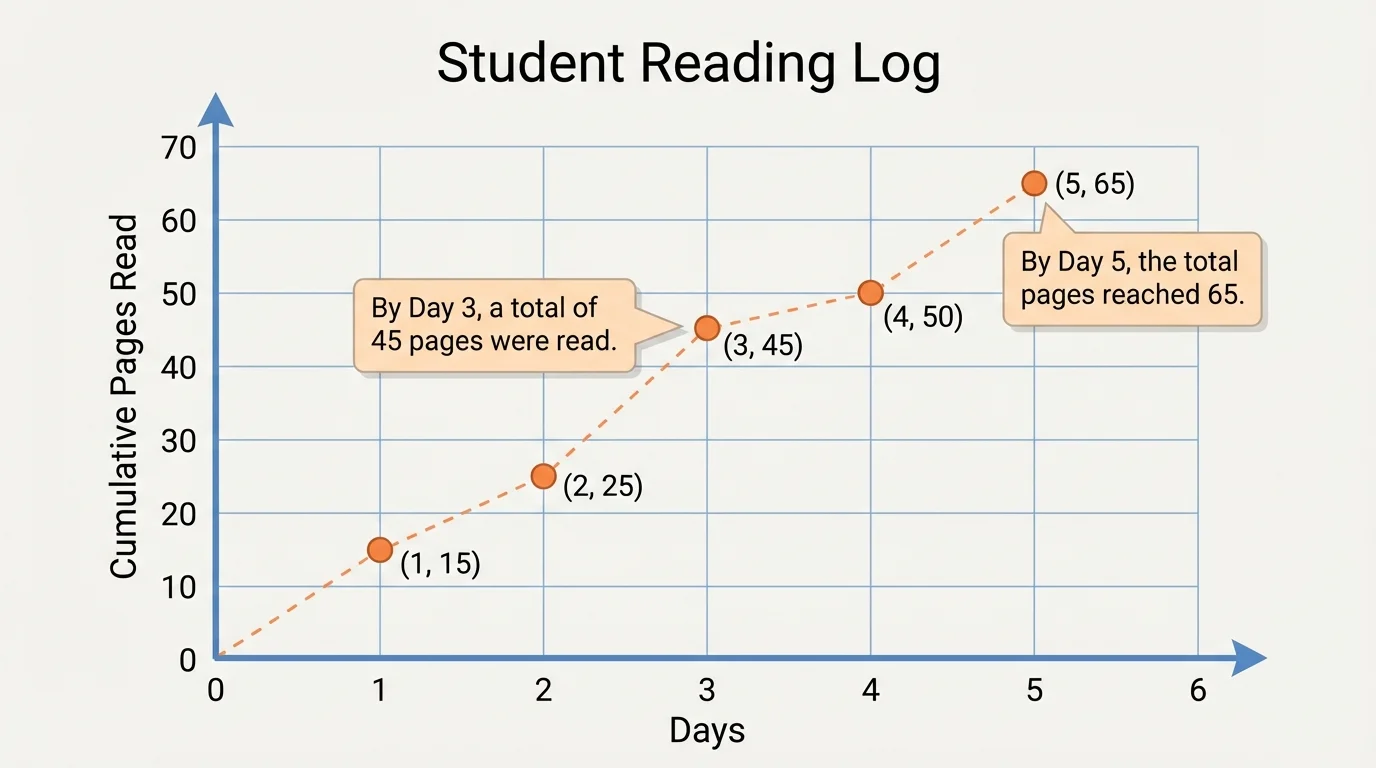
[Figure 3] Graphs become most useful when they tell a story. If the x-axis shows days and the y-axis shows pages read, then each point tells how many pages have been read on a certain day.
For example, if a point is \((4,35)\), the x-coordinate \(4\) means day \(4\), and the y-coordinate \(35\) means \(35\) pages. So the point means that by day \(4\), \(35\) pages were read. The same point would mean something different on a different graph. If the x-axis showed hours and the y-axis showed miles, then \((4,35)\) would mean \(35\) miles in \(4\) hours.
This is the key idea of interpretation: always read the axes first. The coordinates themselves do not tell the full meaning. The labels on the axes give the coordinates context.
Suppose a graph shows number of toy cars on the x-axis and total cost on the y-axis. The point \((3,12)\) means \(3\) toy cars cost \(\$12\). The point \((5,20)\) means \(5\) toy cars cost \(\$20\). You are using the graph to represent a real-world situation with points.
Scientists, athletes, and business owners all use graphs to make sense of information. A simple point on a graph can represent speed, time, distance, temperature, sales, or many other real measurements.
Mathematical problems can be graphed too. A point might represent length and width, input and output, or two related numbers in a pattern. Whether the problem is about school, sports, or pure math, the same graphing rules apply.
Let us graph the points \((2,3)\), \((5,1)\), and \((4,4)\). This is a mathematical problem because you are placing given ordered pairs on a coordinate plane.
Worked example 1
Step 1: Plot \((2,3)\).
Start at the origin \((0,0)\). Move \(2\) units right and \(3\) units up. Mark the point.
Step 2: Plot \((5,1)\).
Start at the origin again. Move \(5\) units right and \(1\) unit up. Mark the point.
Step 3: Plot \((4,4)\).
Start at the origin again. Move \(4\) units right and \(4\) units up. Mark the point.
The three graphed points are \((2,3)\), \((5,1)\), and \((4,4)\).
Notice that all three points are in the first quadrant because both numbers in each ordered pair are greater than \(0\). Also notice that \((4,4)\) lies where the x-coordinate and y-coordinate are equal.
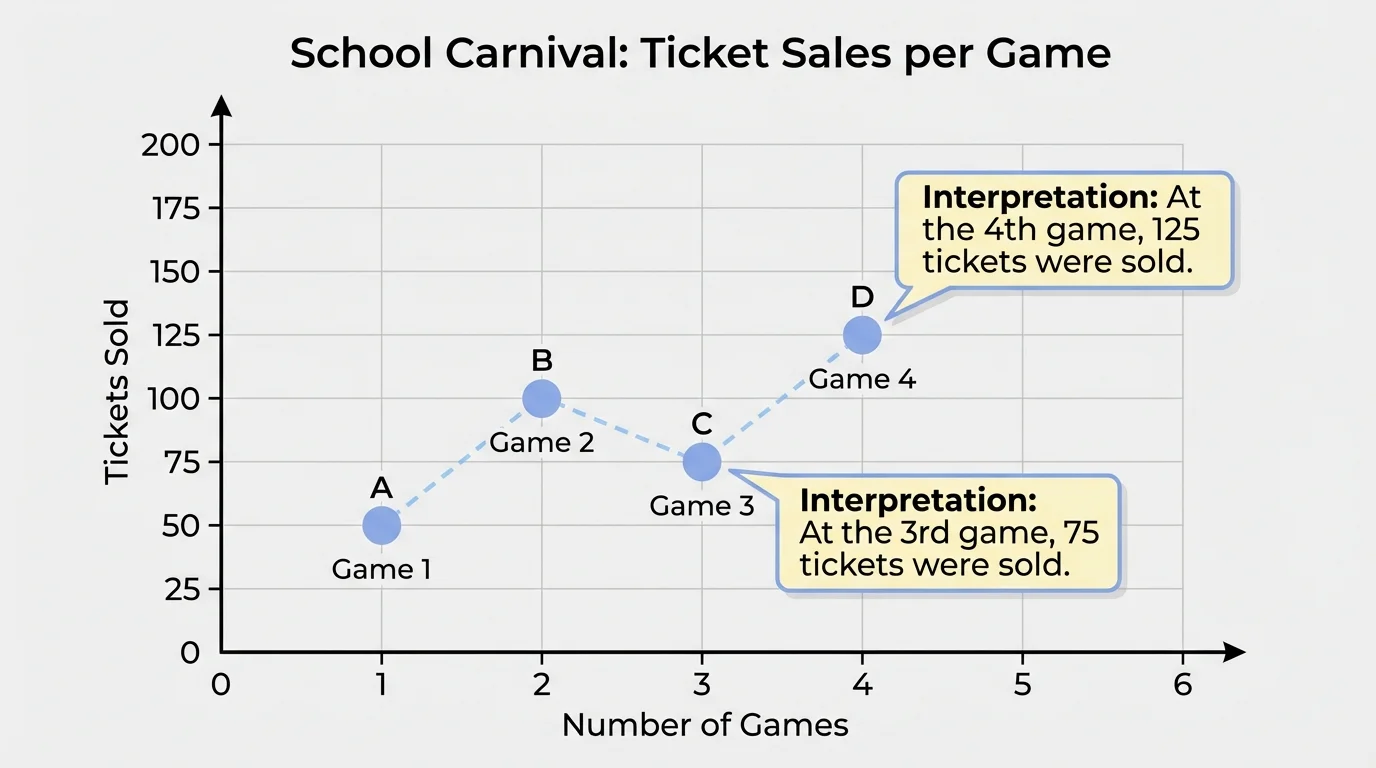
[Figure 4] Now use a real-world situation. A school carnival records the number of games played on the x-axis and the number of tickets won on the y-axis. The data pairs are \((1,8)\), \((2,15)\), \((3,21)\), and \((4,30)\). This kind of story data can be displayed on a first-quadrant graph so the information is easier to compare.
Worked example 2
Step 1: Identify what each axis means.
The x-axis represents the number of games played. The y-axis represents the number of tickets won.
Step 2: Plot each ordered pair.
Graph \((1,8)\), \((2,15)\), \((3,21)\), and \((4,30)\) by moving right first and then up.
Step 3: Interpret one of the points.
The point \((3,21)\) means that after playing \(3\) games, a student won \(21\) tickets.
This graph represents a real situation using points in the first quadrant.
This example shows that graphing is not only about placing dots. It is also about understanding what those dots mean. Later, when you look back at the graph, every point gives information quickly.
Suppose a graph has time in minutes on the x-axis and laps run on the y-axis. One point on the graph is \((6,9)\). What does it mean?
Worked example 3
Step 1: Read the x-axis label.
The x-coordinate \(6\) stands for \(6\) minutes.
Step 2: Read the y-axis label.
The y-coordinate \(9\) stands for \(9\) laps.
Step 3: Combine the meanings.
The point \((6,9)\) means that in \(6\) minutes, \(9\) laps were run.
The coordinates must always be explained using the labels on the graph.
If you reversed the coordinates and read the point as \((9,6)\), you would say \(9\) minutes and \(6\) laps, which is a different meaning. This is why coordinate order matters so much.
One common mistake is switching the order of the coordinates. Students may see \((3,5)\) and graph \((5,3)\). To avoid this, remember: across first, up second. The first number belongs to the x-axis, and the second number belongs to the y-axis.
Another mistake is starting from the wrong place. You should begin at the origin, \((0,0)\), each time you plot a point. As seen earlier in [Figure 2], plotting works best when you restart from the origin for every new point.
A third mistake is forgetting what the axes represent. If a graph shows days and pages, then a point is about days and pages. If a graph shows hours and miles, then the same coordinates mean something different. This is why labels are not optional.
| Mistake | What happens | How to fix it |
|---|---|---|
| Switching coordinates | \((2,5)\) is graphed as \((5,2)\) | Read x first, then y |
| Not starting at the origin | The point ends up in the wrong place | Begin at \((0,0)\) every time |
| Ignoring labels | The point's meaning is unclear | Check what each axis represents |
Table 1. Common graphing mistakes and ways to correct them.
A smart way to check your work is to read the point back after graphing it. For example, if you graph \((4,2)\), ask yourself, "Did I move \(4\) right and \(2\) up?" Then ask, "What do \(4\) and \(2\) mean in this situation?"
First-quadrant graphs are useful in many parts of life because many measurements are positive. Time, distance, number of items, pages read, and points scored are often represented by positive numbers. That makes the first quadrant a natural place to graph them.
A teacher might graph number of books read during different months. A coach might graph minutes practiced and baskets made. A gardener might graph days and plant height. The reading log in [Figure 3] works the same way: one coordinate tells when, and the other coordinate tells how much.
You can also graph mathematical patterns. For example, if the rule is "add \(2\)," you might create the pairs \((1,3)\), \((2,4)\), \((3,5)\), and \((4,6)\). These points show a relationship between two numbers.
"A graph helps your eyes see what the numbers are saying."
When you understand how to graph points and interpret them, you are learning a tool that appears again and again in math, science, sports, and everyday decision-making.
Graphing points in the first quadrant means using ordered pairs to place information on a coordinate plane where both coordinates are positive. You move right for the x-coordinate and up for the y-coordinate. Then you interpret the point by connecting each coordinate to the labels on the axes.
Whether you are graphing toy cars and cost, time and laps, or games and tickets, the process stays the same. Read the axes, plot carefully, and explain the meaning of each point in the situation. The graph is not just a picture. It is a way to organize and understand information.