Suppose two students both say their average quiz score is \(8\) out of \(10\). That sounds the same at first, but what if one student took only \(2\) quizzes and the other took \(20\)? Suddenly, the information feels different. One small detail changes how we understand the data: the number of observations. In statistics, the count of data values matters because it tells us how much information we have.
When people collect data, they gather facts, measurements, or responses. A list of temperatures, test scores, shoe sizes, or minutes spent reading can all be part of a data set. Each individual value in that set is called an observation.
If a class records the number of books each student read last month, then every student's number is one observation. If there are \(24\) students, there are \(24\) observations. Reporting that count helps others understand the size of the data set. Without it, a summary is incomplete.
Observation means one piece of data, such as one score, one measurement, or one response. The number of observations is the total count of all those pieces of data in the set.
A data set is the whole collection of observations being studied.
The number of observations is often written with the letter \(n\). For example, if a teacher records the math scores of \(18\) students, then \(n = 18\). You do not need advanced formulas to use this idea. You simply need to count carefully and report the count clearly.
Sometimes a data set includes every member of a group, and sometimes it includes only part of a group. For example, a principal might want to know how many minutes students spend on homework. Asking every student in the school would collect a very large data set. Asking only one class would collect a smaller group called a sample. The sample size is the number of observations in the sample.
For sixth grade, it is helpful to think of sample size as just another way to say how many data values were collected in the sample. If \(15\) students are surveyed, then the sample size is \(15\).
To count observations correctly, remember that repeated values still count more than once. In the list \(4, 4, 6, 7\), there are \(4\) observations, not \(3\). Even though the number \(4\) appears twice, each appearance is a separate data value.
This idea is important because statistics describe actual data values, not just different kinds of values. If \(5\) students each ran \(12\) laps, then the value \(12\) appears \(5\) times, so it contributes \(5\) observations.
There are several common ways to organize data. In each case, the goal is the same: count how many values are present. In graphs, each mark may stand for one observation. In tables, each frequency tells how many observations have a certain value or belong to a certain category.
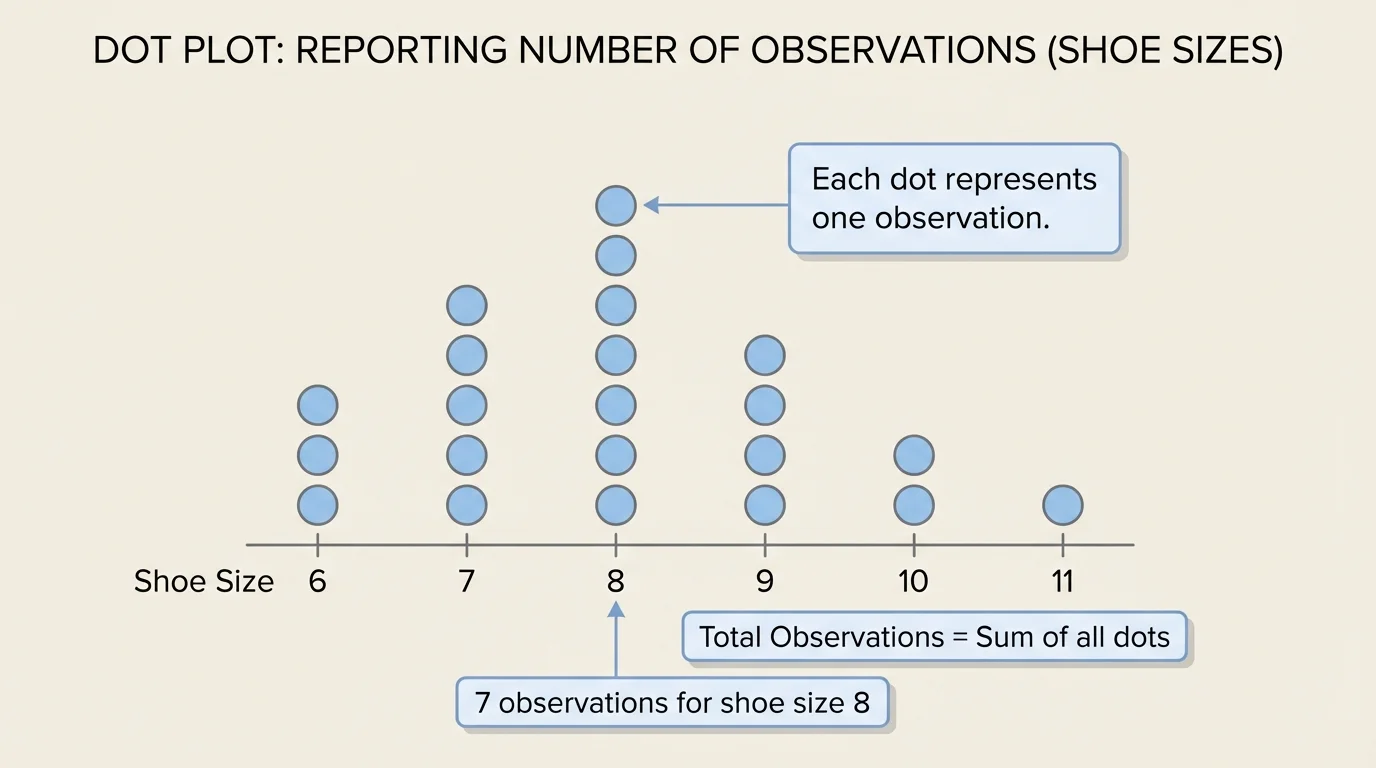
[Figure 1] If the data are written as a list, count every item. If the data are in a table with frequencies, add all the frequencies. If the data are in a dot plot, count all the dots. If the data are in a line plot or stem-and-leaf plot, count every recorded value.
For example, consider the list of daily temperatures in degrees: \(72, 74, 74, 71, 70, 75, 73\). There are \(7\) numbers in the list, so there are \(7\) observations.
Now consider a frequency table for pet counts owned by students. If \(3\) students have \(0\) pets, \(5\) students have \(1\) pet, and \(4\) students have \(2\) pets, then the number of observations is found by adding the frequencies: \(3 + 5 + 4 = 12\). So \(n = 12\).
On a dot plot, each dot stands for one observation. If there are \(14\) dots total, then the data set has \(14\) observations. Later, when you find the median or notice clusters, you still need that total count, just as we saw in [Figure 1].
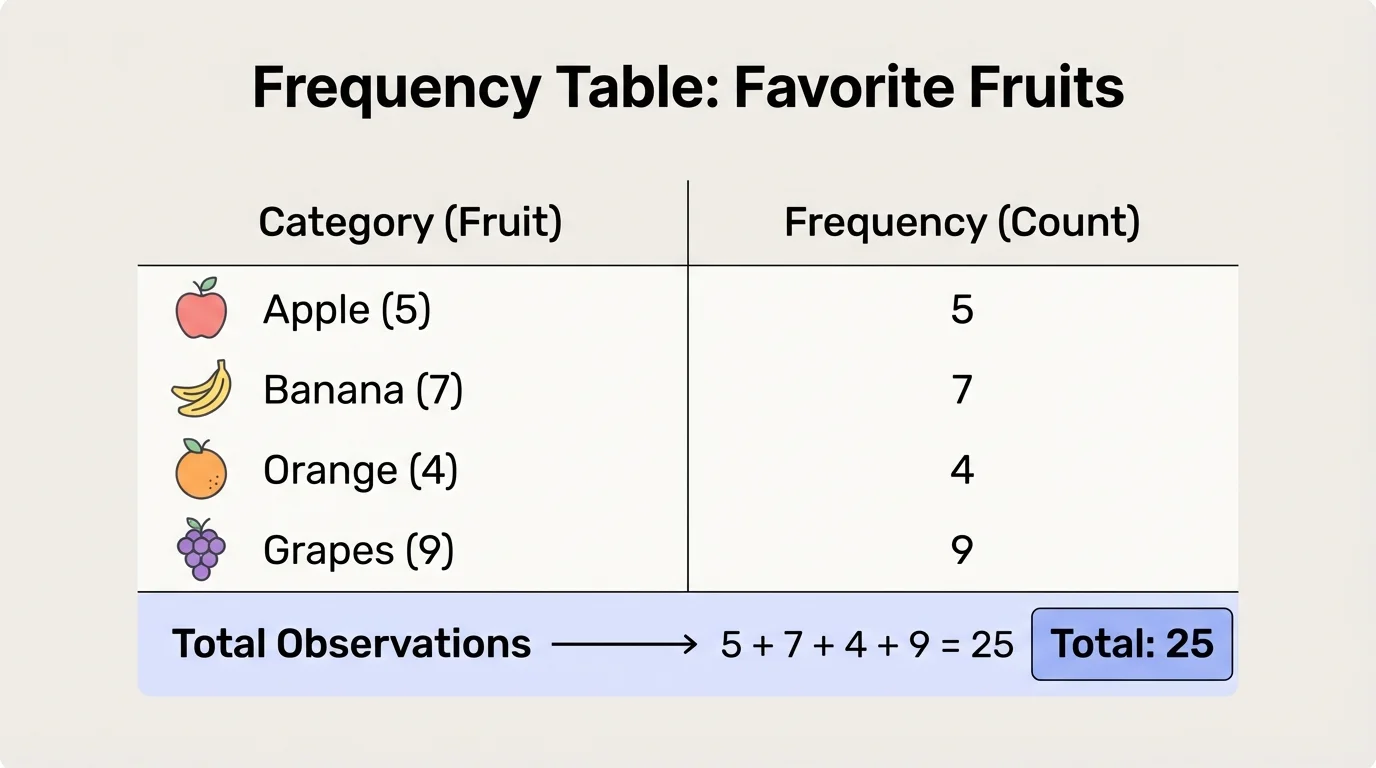
[Figure 2] When you describe a data set, it is not enough to mention only the values or the average. You should say how many observations were collected. A frequency table may show only a few categories but still represent many observations. That is why statisticians report the count along with other information.
Good reporting sounds like this: "The data set contains \(16\) observations." "There were \(25\) students surveyed, so \(n = 25\)." "The median height was \(58\) inches from a data set of \(12\) observations." These statements are clear because they include the total number of data values.
A common mistake is to count categories instead of observations. If a table lists favorite fruits as apples, bananas, oranges, and grapes, that is \(4\) categories. But if the frequencies are \(6, 4, 5, 3\), then the number of observations is \(6 + 4 + 5 + 3 = 18\), not \(4\).
Another mistake is to ignore missing data. Suppose \(20\) students are in a class, but only \(17\) turn in a survey. Then the number of observations for that survey is \(17\), not \(20\). You count only the actual data collected.
Weather scientists, coaches, and doctors all pay attention to how many observations they have. A pattern based on only \(3\) measurements may change quickly, but a pattern based on \(300\) measurements is usually more stable.
Clear reporting makes data more trustworthy. It helps readers know whether the data come from a small group or a larger one, and that changes how confidently people can describe patterns.
Let us look at several solved examples that show how to find and report the number of observations in different situations.
Worked example 1
A class records the number of minutes students read last night: \(25, 30, 20, 40, 30, 35, 20, 25\). Find the number of observations and report it clearly.
Step 1: Count each data value in the list.
The list has \(8\) numbers: \(25, 30, 20, 40, 30, 35, 20, 25\).
Step 2: State the count.
There are \(8\) observations.
Step 3: Write the result in context.
The reading-time data set contains \(8\) observations, so \(n = 8\).
This means data were collected from \(8\) students.
Notice that repeated numbers such as \(25\), \(30\), and \(20\) are each counted every time they appear. Repeated values do not disappear just because they are the same.
Worked example 2
A survey of favorite school lunch choices gives this frequency table: pizza \(= 7\), tacos \(= 5\), sandwiches \(= 4\), salad \(= 2\). Find the number of observations.
Step 1: Identify the frequencies.
The frequencies are \(7\), \(5\), \(4\), and \(2\).
Step 2: Add the frequencies.
\(7 + 5 + 4 + 2 = 18\).
Step 3: Report the answer.
There are \(18\) observations in the survey, so \(n = 18\).
The table has \(4\) categories, but it represents \(18\) student responses.
This example shows why counting rows or categories does not always give the correct total. The frequencies tell how many actual observations there are.
Worked example 3
A science group measures plant heights in centimeters: \(12, 13, 13, 15, 14, 12, 16, 13, 15, 14, 14\). Find the number of observations.
Step 1: Count the measurements one by one.
The data values are \(12\), \(13\), \(13\), \(15\), \(14\), \(12\), \(16\), \(13\), \(15\), \(14\), \(14\).
Step 2: Total the count.
There are \(11\) measurements.
Step 3: Write the result in context.
The plant-height data set has \(11\) observations, so \(n = 11\).
Each plant measured gives one observation.
Even when the data are about the same subject, like plant heights, every measurement still counts separately because it describes one case in the data.
Worked example 4
A basketball coach records points scored by a player in \(6\) games: \(10, 14, 8, 12, 16, 10\). The coach says, "The player scored \(10\) in two games, so that only counts once." Is the coach correct?
Step 1: Identify what an observation means.
Each game score is one observation.
Step 2: Count all game scores.
The scores are \(10, 14, 8, 12, 16, 10\), which makes \(6\) observations.
Step 3: Decide whether repeated values are counted once or more than once.
The score \(10\) appears twice because it happened in two different games. It counts as \(2\) observations.
The coach is not correct. The data set contains \(6\) observations, so \(n = 6\).
That final example is important because many counting mistakes happen when students forget that equal values can come from different observations.
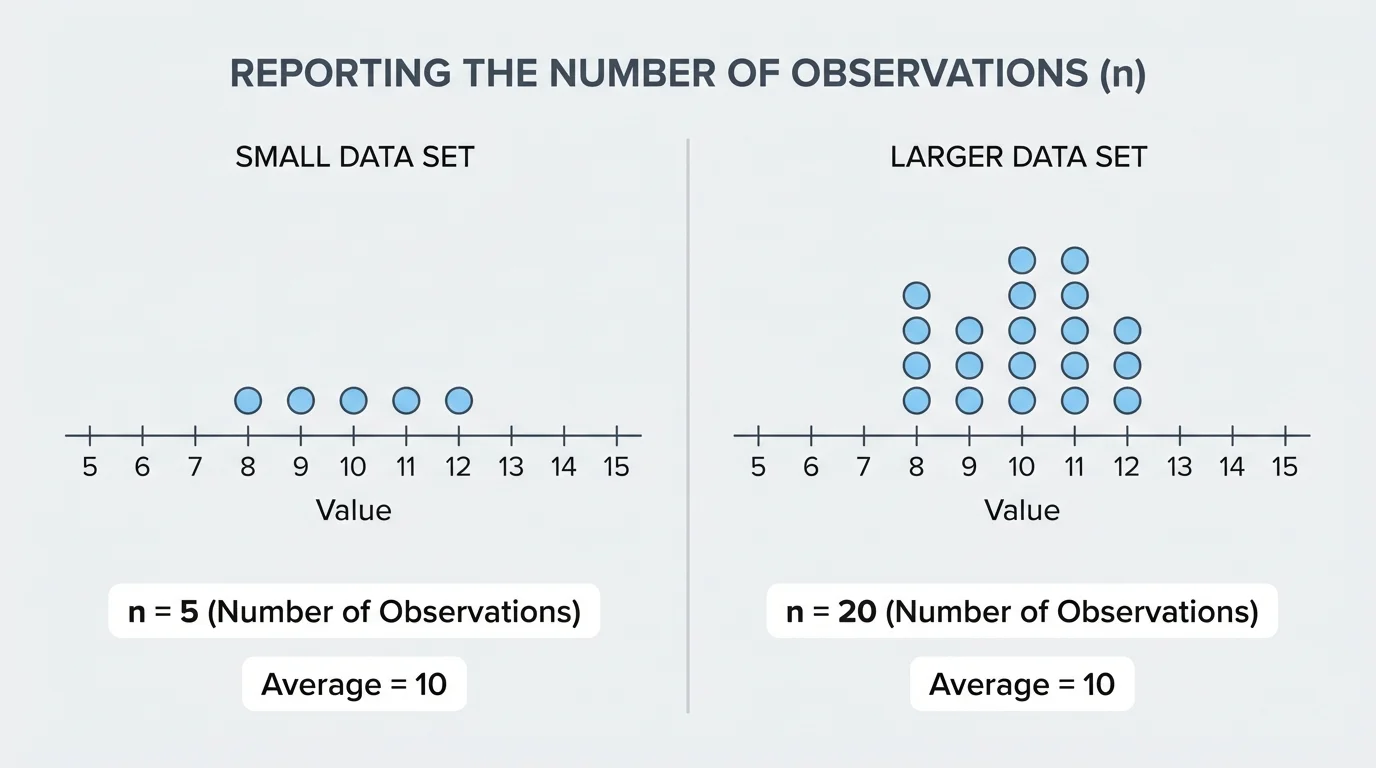
[Figure 3] When you describe data, you often use several ideas together: the count, the center, and the spread. The count tells how many observations there are. Measures such as the median and range help describe the data further. Two data sets can have similar averages but different numbers of observations, and that affects how we interpret them.
For example, compare these two data sets of quiz scores. Set A is \(8, 8\). Set B is \(8, 8, 8, 8, 8, 8, 8, 8\). Both have a mean of \(8\), but Set A has only \(2\) observations while Set B has \(8\). The larger set gives more information because it includes more quiz results.
The number of observations also matters when finding the median. If there is an odd number of observations, the median is the middle value. If there is an even number of observations, the median is the average of the two middle values. To know which case you have, you first need the count.
Suppose the sorted data are \(3, 5, 6, 7, 9\). There are \(5\) observations, so the median is the middle value, \(6\). But if the sorted data are \(3, 5, 6, 7, 9, 10\), there are \(6\) observations, so the median is the average of the two middle values: \(\dfrac{6 + 7}{2} = 6.5\).
The count can also help you decide how much trust to place in a claim. If a student says, "Our team usually scores \(15\) points," you would understand that statement differently if it came from \(2\) games instead of \(20\) games. That is one reason the number of observations remains important, just as in the comparison shown in [Figure 3].
Why count belongs in a data description
A good statistical description usually answers more than one question: How many values are there? What value is in the middle? How spread out are the values? Reporting the number of observations gives the starting point for all the other summaries because it tells how much data the description is based on.
So, when you summarize data, do not stop after stating the median, range, or mean. Include the number of observations too.
In sports, coaches track game scores, practice times, and shooting percentages. If a player made \(9\) out of \(10\) shots in one short drill, that result may look excellent. But if another player made shots at the same rate over \(50\) attempts, the information is based on many more observations.
In science, students may record temperatures every hour, plant growth every week, or rainfall each day. The number of observations tells how much evidence supports a pattern. A graph based on \(30\) days of weather data tells a fuller story than a graph based on only \(3\) days.
In school surveys, student councils often ask classmates about lunch choices, after-school clubs, or spirit week themes. If only \(12\) students answer, the results may not represent the whole school very well. If \(300\) students answer, the survey has many more observations.
In health, doctors and scientists study measurements such as heart rate, sleep hours, or medicine effects. A result based on very few observations may change when more data are collected. That is why reports often mention how many observations were used.
One common error is counting unique values instead of counting all values. In the set \(2, 2, 2, 5, 5, 9\), there are \(6\) observations, not \(3\). The unique values are \(2\), \(5\), and \(9\), but statistics here depend on all \(6\) data points.
Another common error is confusing the number of categories with the number of observations. Categories are labels or groups. Observations are the actual responses or measurements. A table might have \(5\) categories but \(120\) observations.
A third mistake is assuming that the size of a class, team, or group is automatically the number of observations. That is only true if data were collected from everyone. If \(28\) students are in the class but only \(23\) completed the survey, then \(n = 23\).
Good habits make reporting more accurate. Count carefully. Check whether repeated values were included. Add frequencies correctly. Make sure missing responses are not counted. Then write a clear sentence using context, such as "The data set includes \(14\) observations of daily rainfall."
"Data make more sense when we know how much data there is."
— A useful rule for reading statistics
That simple rule helps in every topic involving data. Whether you are studying scores, measurements, survey answers, or experiment results, the number of observations tells how much information you are using.