A fitness watch can count your steps, estimate your heart rate, measure your pace, calculate your distance, and even predict calories burned. But if your goal is to train for a race, not every number matters equally. The challenge is not just collecting data. The challenge is deciding which measurable values actually describe the situation well. That decision is the heart of defining appropriate quantities for descriptive modeling.
In mathematics, a model is a way to represent a real situation so that we can understand it, describe it, or make decisions from it. A descriptive model focuses on representing what is happening. It may use words, tables, graphs, equations, or statistics. For a descriptive model to be useful, the quantities in it must fit the purpose of the model.
Descriptive modeling is the process of representing a real-world situation using meaningful measurable quantities so patterns, relationships, or important features can be described clearly.
Quantity is a measurable attribute, such as length, time, mass, temperature, speed, cost, or population.
Unit is the standard used to measure a quantity, such as \(\textrm{meters}\), \(\textrm{seconds}\), or \(\textrm{dollars}\).
Good descriptive modeling begins by asking a simple but powerful question: What do we need to measure to describe this situation well? If a city wants to study traffic, the useful quantities might include average travel time, number of cars per hour, and delay at intersections. If a doctor wants to monitor a patient, the useful quantities might include body temperature, heart rate, and blood pressure. The right quantity depends on the purpose.
Whenever we describe a real-world situation mathematically, we make choices. We decide what to include and what to ignore. Those choices matter because they affect what the model can tell us. If the quantities are poorly chosen, the model may be confusing, incomplete, or misleading.
Suppose a school wants to understand student transportation. Counting only the number of students who arrive each day does not tell us much, because attendance is already known. More useful quantities might be travel time, distance from school, mode of transportation, and percentage of late arrivals. Those values help describe the transportation situation in a way that supports decisions.
A descriptive model does not always need complicated formulas. Sometimes a table of values or a graph is enough. But even simple models require thoughtful quantity selection. A graph with the wrong variables on the axes is not very informative. A table with values measured in inconsistent units can be difficult to interpret.
Not every characteristic is a quantity. A quantity must be something that can be measured or counted. For example, in a study of rainfall, color of the clouds might be observed, but rainfall amount in \(\textrm{millimeters}\), storm duration in \(\textrm{hours}\), and wind speed in \(\textrm{kilometers per hour}\) are quantities because they can be measured.
In many models, quantities are represented by variables. A variable is a symbol that stands for a quantity that can change. If \(t\) represents time in \(\textrm{hours}\) and \(d\) represents distance in \(\textrm{kilometers}\), then \(t\) and \(d\) are variables connected to measurable quantities.
The first time you meet a variable in modeling, it helps to think of it as a named measurement. Variables are not random letters. Each one should represent something real and should include units when appropriate. A statement like \(x = 12\) is incomplete unless we know whether \(x\) means \(12 \textrm{ minutes}\), \(12 \textrm{ liters}\), or \(12\) students.
Some values in a model may stay fixed. These are often called constants. For instance, if a parking garage charges a fixed entrance fee of \(\$5\) plus an hourly charge, then the \(\$5\) is constant while the total cost changes with time parked. Distinguishing changeable quantities from fixed ones helps build a clearer model.
From earlier math work, you already know that numbers by themselves may not communicate enough. A measurement needs both a value and a unit. The statement \(15\) is just a number, but \(15 \textrm{ cm}\) is a quantity.
Another important idea is that the same situation may involve several possible quantities. In a basketball game, you could track points scored, shooting percentage, rebounds, turnovers, minutes played, or distance run. Different quantities highlight different parts of performance.
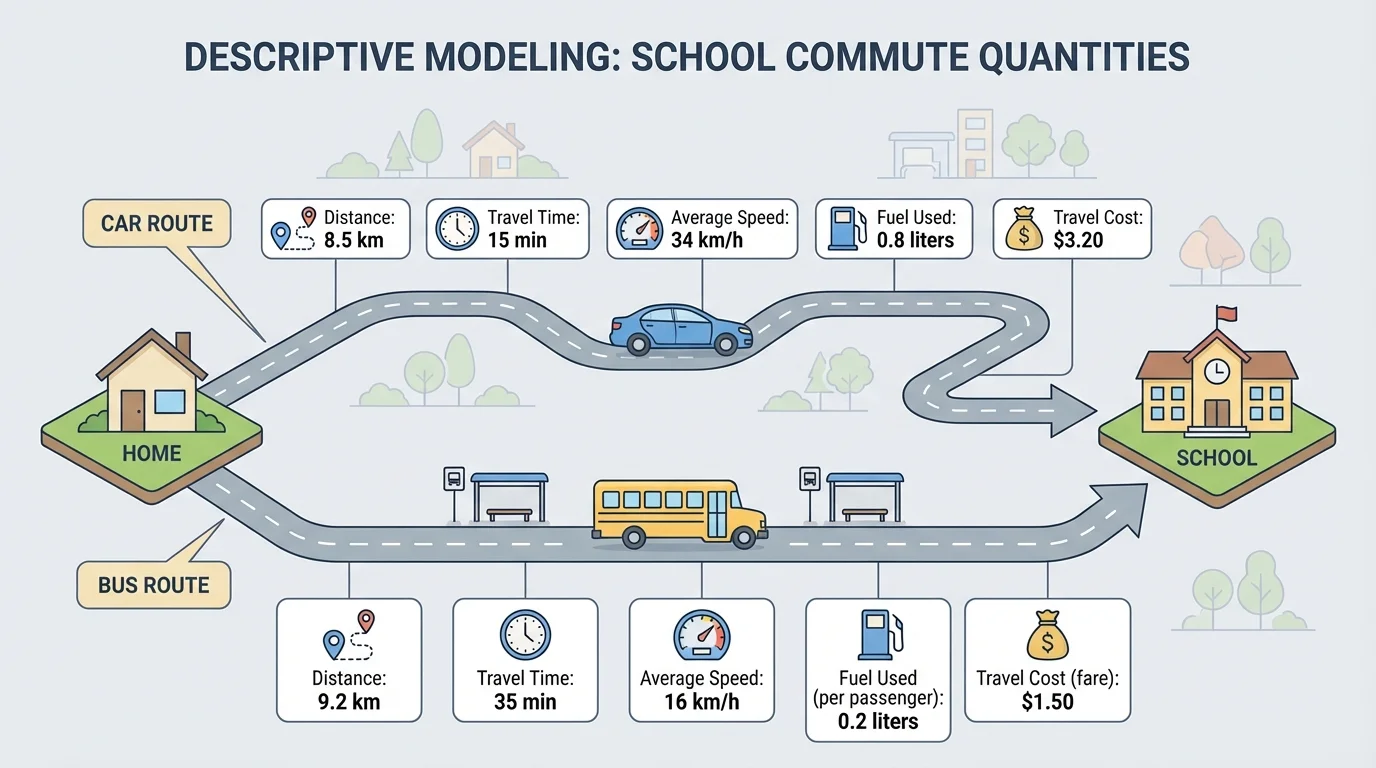
The best quantities are the ones that answer the question being asked, as [Figure 1] illustrates with one commute described in several different ways. If the purpose is to compare how long students travel to school, then travel time is more useful than shoe size, backpack mass, or favorite subject. Relevance comes first.
When choosing quantities, ask several questions. What is the goal of the model? What features of the situation matter most? Which quantities can actually be measured or estimated? Which quantities are likely to reveal patterns or relationships? A useful model balances meaning and practicality.
Consider a student commute to school. Possible quantities include distance traveled, travel time, average speed, fuel used, and travel cost. If the school wants to reduce tardiness, travel time and delay frequency are likely more useful than fuel cost. If the school wants to study environmental impact, fuel used or emissions may be more useful than average speed. The purpose changes the best choice of quantities.
Appropriate quantities should also be specific. For example, saying "weather" is too broad. Better quantities would be temperature in \(^\circ\textrm{F}\), rainfall in \(\textrm{mm}\), humidity as a percentage, and wind speed in \(\textrm{km/h}\). Specific quantities make the model clear and measurable.
They should also be reasonable. If you are modeling water use in a home, recording every single drop would be impractical. Measuring liters used per day is more realistic. A good model does not try to capture everything. It captures what matters at a useful level of detail.
Purpose determines quantity choice
The same real-world situation can be modeled in different ways because different questions require different quantities. A business might model sales using total revenue, number of items sold, and advertising spending. A health researcher studying the same community might instead model exercise time, calorie intake, and average sleep. There is rarely one universally correct list of quantities. There is a best list for a particular purpose.
This idea explains why professional models are often revised. Scientists, engineers, economists, and policy makers sometimes discover that an earlier model left out an important quantity or included one that did not really help. Better quantity choices lead to better descriptions.
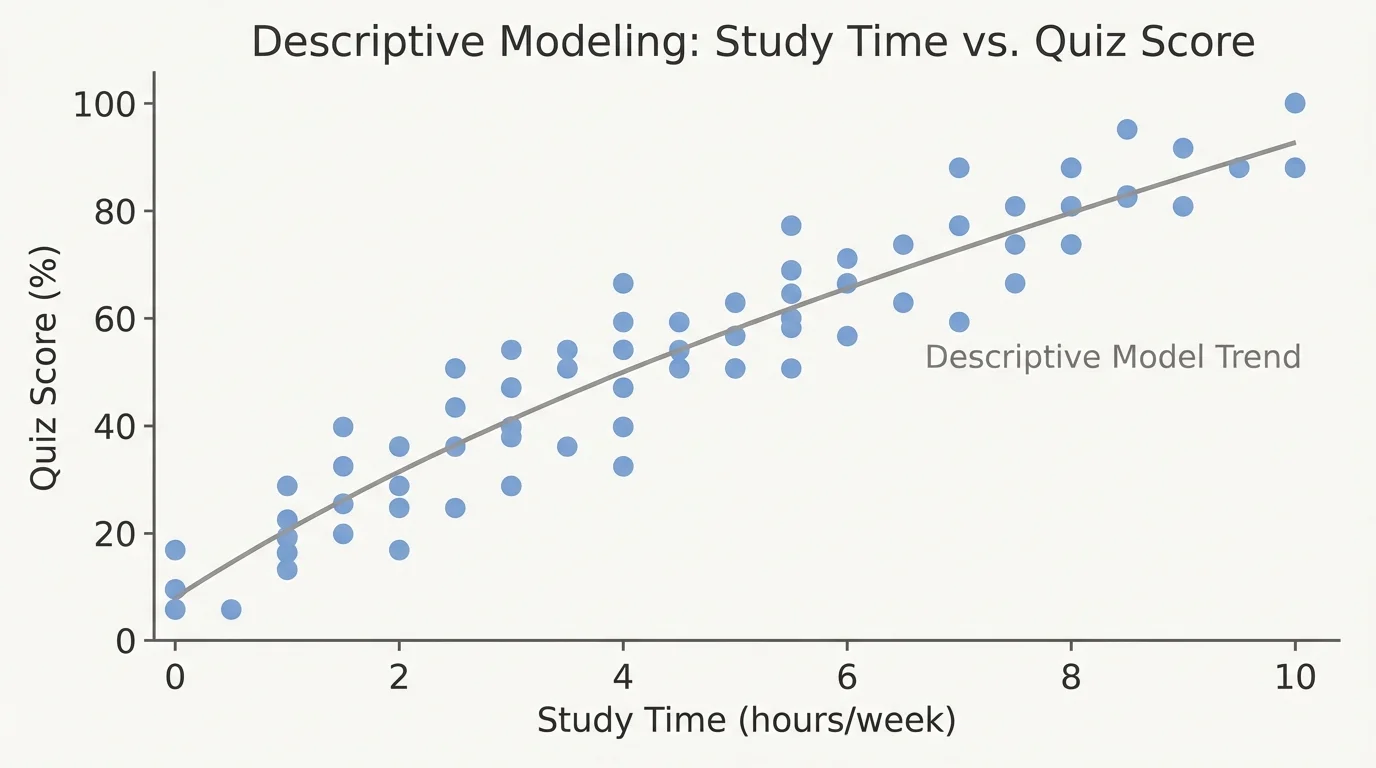
Many descriptive models include relationships in which one quantity changes in response to another, as shown in [Figure 2]. In such cases, the input is often called the independent quantity, and the output is called the dependent quantity.
For example, if quiz score depends partly on hours spent studying, then study time may be treated as the independent quantity and quiz score as the dependent quantity. This does not mean studying is the only factor, but it may be a useful relationship to describe.
In a graph, the independent quantity is usually placed on the horizontal axis and the dependent quantity on the vertical axis. In a table, each row may show how a change in one quantity is associated with a change in another. Choosing these roles correctly helps the model make sense.
Suppose a water tank is being filled at a steady rate. Time and volume of water are both quantities. If \(t\) is time in minutes and \(V\) is water volume in liters, then \(V\) depends on \(t\). A model might describe how the volume increases as time passes.
The relationship does not need to be perfectly exact for the model to be useful. Descriptive modeling often focuses on trends. In the study-time example, data points may not lie on a perfect line, but the overall pattern can still show that more study time tends to be associated with higher quiz scores.
Later, when you interpret a graph or formula, it helps to ask: Which quantity is changing on its own in the model, and which quantity is changing in response? That question often reveals whether the chosen quantities are appropriate. This relationship becomes visible when each study time value is linked to a quiz score on a graph.
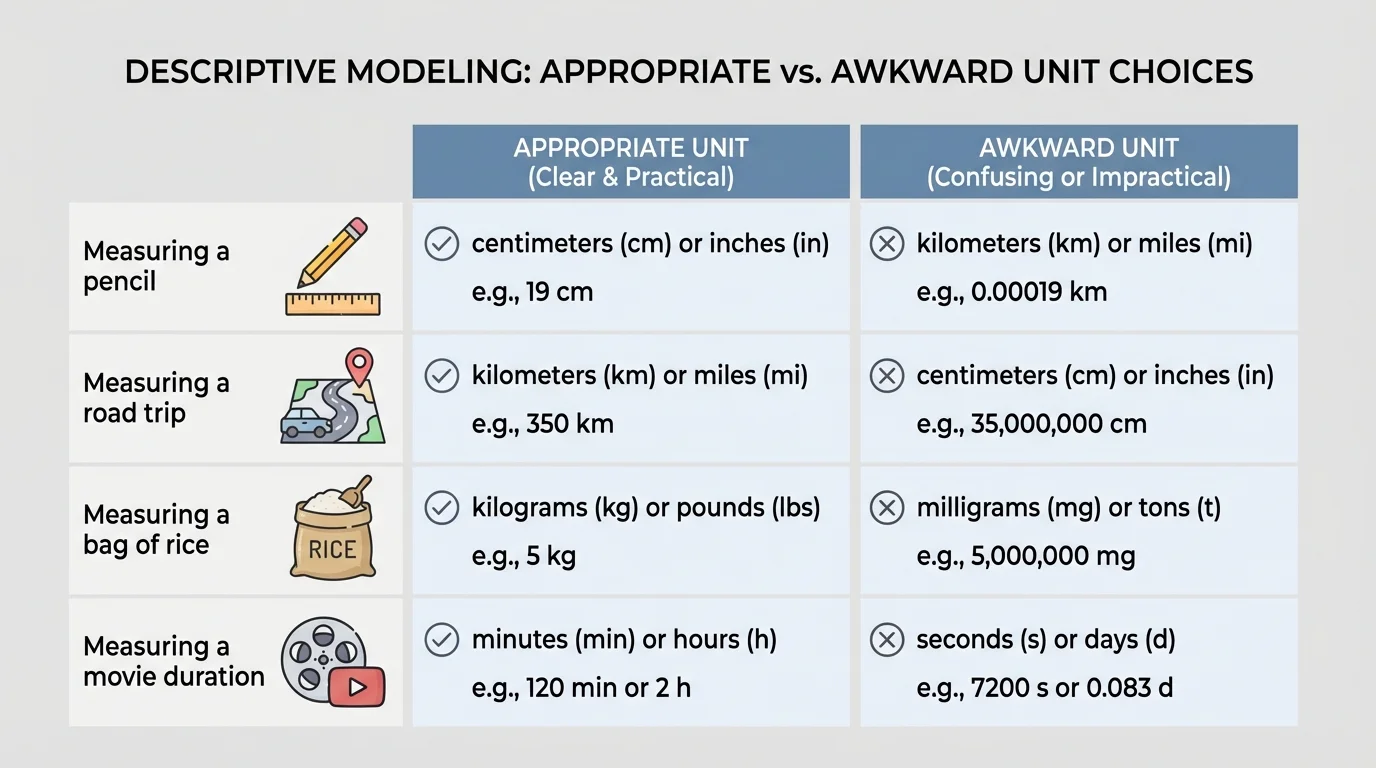
Even well-chosen quantities become confusing if their units are missing or inappropriate. Good models use units that make values easy to interpret, as [Figure 3] shows by comparing sensible and awkward measurement choices.
If you are measuring the length of a pencil, centimeters make sense. If you are measuring the distance between cities, kilometers are more appropriate. Using \(150{,}000 \textrm{ cm}\) instead of \(1.5 \textrm{ km}\) is technically correct, but much harder to understand quickly.
Scale matters too. If the quantities are too large or too small for the chosen units, the numbers may hide meaning. Scientists often use very small units such as milliseconds or micrometers because larger units would be awkward. Economists may describe national budgets in billions of dollars rather than individual dollars because the scale fits the situation better.
Consistency is essential. If one distance is measured in miles and another in kilometers, comparing them directly can lead to errors unless one is converted. If a model uses time, area, mass, or cost, every quantity should be tracked in a consistent way.
Consider average speed. If distance is measured in \(\textrm{kilometers}\) and time in \(\textrm{hours}\), then speed is measured in \(\textrm{km/h}\). If distance changes to meters while time remains in hours, then the resulting unit changes. The model must make these unit choices clear.
| Situation | Better Quantity | Reason |
|---|---|---|
| Tracking a runner's training | Distance in \(\textrm{km}\), time in \(\textrm{min}\), pace in \(\textrm{min/km}\) | These quantities match endurance and speed goals. |
| Comparing cell phone plans | Monthly cost, data limit, cost per gigabyte | These quantities describe value and usage. |
| Studying plant growth | Height in \(\textrm{cm}\), days since planting, water given in \(\textrm{mL}\) | These quantities can reveal growth patterns. |
| Monitoring room comfort | Temperature in \(^\circ\textrm{F}\), humidity in percent | These measurements describe the environment directly. |
Table 1. Examples of quantity choices that fit the purpose of a descriptive model.
The best way to understand appropriate quantities is to analyze real situations and justify the choices. In each example below, the goal is not just to calculate, but to decide what should be measured and how those measurements help describe the situation.
Worked example 1: Modeling school cafeteria use
A school wants to describe lunch line efficiency. Which quantities are appropriate?
Step 1: Identify the purpose.
The goal is to describe how efficiently students move through the lunch line.
Step 2: Choose quantities connected to that purpose.
Useful quantities include number of students served, average waiting time, number of open registers, and total serving time.
Step 3: Reject quantities that do not match the purpose.
Students' locker numbers or the outside temperature are not likely to help describe lunch line efficiency.
Step 4: Interpret a sample measurement.
If \(240\) students are served in \(30 \textrm{ min}\), then the average serving rate is \(\dfrac{240}{30} = 8\) students per minute.
Appropriate quantities are those directly related to flow, delay, and service rate.
This example shows that descriptive modeling is often about making smart measurement choices before doing any advanced calculation.
Worked example 2: Comparing two delivery routes
A company wants to compare two delivery routes to decide which one is more reliable.
Step 1: Decide which quantities describe reliability.
Useful quantities include average travel time, variation in travel time, distance, and number of delays.
Step 2: Examine sample data.
Route A has times \(42, 45, 43, 44\) minutes. Route B has times \(35, 52, 33, 54\) minutes.
Step 3: Compute average time for each route.
For Route A, the mean is \(\dfrac{42+45+43+44}{4} = \dfrac{174}{4} = 43.5\) minutes.
For Route B, the mean is \(\dfrac{35+52+33+54}{4} = \dfrac{174}{4} = 43.5\) minutes.
Step 4: Interpret the quantities.
Both routes have the same average time, but Route A has much less variation. If the purpose is reliability, variation in travel time is an important quantity, not just the mean.
The model improves because it includes a quantity that matches the company's real concern.
A powerful lesson appears here: two models may use the same situation and even the same average, but one model describes the situation better because it tracks a more informative quantity.
Worked example 3: Choosing units for water consumption
A city wants to describe household water use.
Step 1: Identify a useful quantity.
A natural quantity is water consumed per household per day.
Step 2: Select an appropriate unit.
Liters per day are more practical than milliliters per day because the values are large.
Step 3: Interpret sample data.
If one household uses \(850 \textrm{ L}\) in one day and another uses \(1{,}050 \textrm{ L}\), then the second household uses \(1{,}050 - 850 = 200 \textrm{ L}\) more per day.
Step 4: Explain why unit choice matters.
Writing these values as \(850{,}000 \textrm{ mL}\) and \(1{,}050{,}000 \textrm{ mL}\) would make comparison harder, even though the measurement is equivalent.
The quantity and the unit together make the model useful and readable.
Notice how the same idea from [Figure 3] appears again: a mathematically correct unit is not always the most appropriate one for communication.
Weather apps rely on descriptive models constantly. They track quantities such as temperature, air pressure, wind speed, and humidity because those measurements reveal patterns that help meteorologists describe current conditions and forecast likely changes.
Here is one more quick case. A streaming service wants to understand user engagement. Total subscribers is one quantity, but it does not fully describe engagement. Better quantities might include average watch time per day, number of completed episodes, and percent of users active each week. Again, the choice depends on the purpose.
One common mistake is choosing quantities that are easy to measure rather than quantities that are meaningful. For example, a teacher studying whether review sessions help test performance might record only the number of chairs in the room because that is easy to count. But a better set of quantities would include attendance at review sessions, time spent reviewing, and test scores.
A second mistake is using quantities that are too vague. "How busy the store feels" is not a precise quantity. Better choices might include customers per hour, average checkout time, and number of open registers.
A third mistake is mixing units carelessly. If one athlete's race time is recorded in seconds and another's in minutes, comparing them without conversion can produce false conclusions. Clarity requires consistency.
A fourth mistake is leaving out an important quantity. Suppose a factory models productivity using only number of items produced. That may sound reasonable, but if many items are defective, then defect rate is also an important quantity. A more accurate descriptive model includes both output and quality.
As the commute example in [Figure 1] demonstrates, one real-world situation can be measured in several ways. The right measure depends on the decision you want the model to support.
In sports science, coaches choose quantities such as sprint time, heart rate recovery, jump height, and shooting percentage to describe performance. Picking the wrong quantities can hide improvement or make a player seem stronger or weaker than they really are.
In medicine, doctors and researchers use quantities like dosage, body mass, temperature, glucose level, and oxygen saturation. These values must be measured in appropriate units, and they must match the medical purpose. A small unit error in medicine can have serious consequences.
In environmental science, researchers may model air quality using particulate concentration, wind speed, temperature, and traffic volume. If they ignore traffic volume near highways, their model may miss an important cause of pollution patterns.
In business, companies describe performance using revenue, cost, profit margin, customer retention, and delivery time. A company that looks only at total sales might miss the important quantity of profit per item. More sales do not always mean better performance.
In engineering, whether designing a bridge, a battery, or a water system, quantity choice is crucial. Engineers need quantities that connect directly to safety, efficiency, and performance. A model with the wrong measurements can lead to expensive mistakes.
"What gets measured affects what gets understood."
This principle applies in school as well. If you want to understand your own study habits, the quantity "hours with a textbook open" may be less useful than "minutes of focused practice" or "number of problems correctly solved." Better quantities lead to better descriptions, and better descriptions lead to better decisions.
When you face a new modeling situation, start by naming the purpose clearly. Then list possible measurable attributes. Choose the ones that are relevant, specific, measurable, and practical. Decide what units make sense. Finally, check whether the quantities work well together in a table, graph, or equation.
You can think of the process as a filter. First ask, "Does this quantity matter for the question?" Next ask, "Can it be measured clearly?" Then ask, "Are the units sensible?" If the answer to any of those is no, the quantity may not belong in the model.
A strong descriptive model is not the one with the most numbers. It is the one with the most meaningful numbers.