Every day, your world runs on repeating patterns. A Ferris wheel rises and falls, ocean tides advance and retreat, heartbeats create electrical waves, and sound travels as vibrations. These patterns are not random; they repeat with a rhythm. Trigonometric functions are powerful because they turn that rhythm into mathematics. With the right function, you can predict where a rider will be on a wheel, how high the tide will be, or when a signal reaches a peak.
A periodic phenomenon is something that repeats in a regular way. If the pattern returns again and again after the same amount of time, distance, or angle, then it is often modeled by sine or cosine. These functions are especially useful because they naturally create smooth repeating waves.
When we model a periodic situation, we usually want to answer questions such as: How far above or below the average does the quantity move? How often does the cycle repeat? Where is the center of the motion? And what is happening at the start? Those questions lead directly to the main parts of a trigonometric model.
You should already know the basic graphs of \(y = \sin x\) and \(y = \cos x\), and that both repeat forever. You should also remember that the standard period of each is \(2\pi\) when the input is measured in radians.
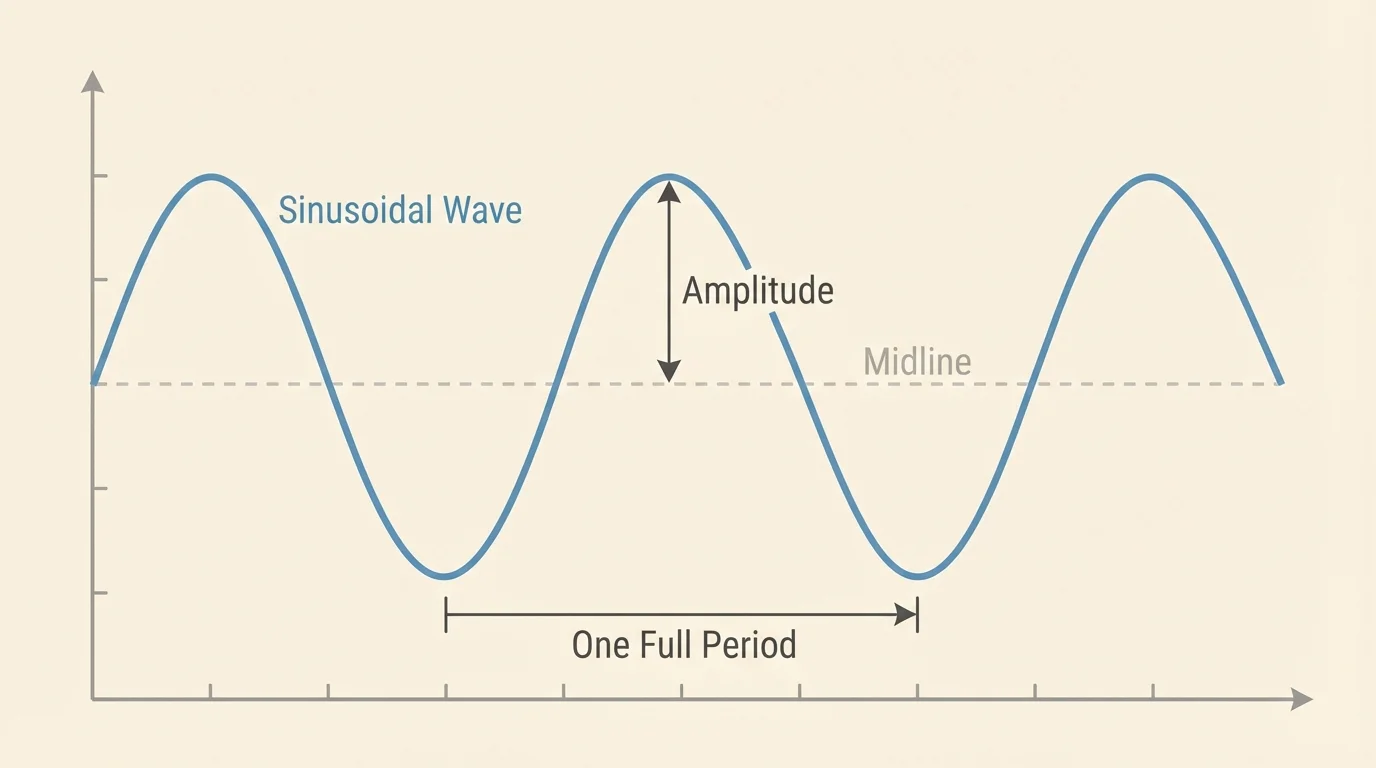
[Figure 1] The goal is not just to sketch waves. The goal is to match a real repeating situation with an equation that has the correct height, timing, and center line.
A general trigonometric model often looks like this through the graph's vertical and horizontal measurements:
\[y = A\sin(Bx - C) + D\quad \textrm{or} \quad y = A\cos(Bx - C) + D\]
Each parameter has a meaning. The number amplitude is \(|A|\). It tells how far the graph moves above or below its center. The midline is \(y = D\). It is the horizontal line halfway between the maximum and minimum values. The value of period depends on \(B\) and tells the length of one complete cycle. For sine and cosine, \(\textrm{period} = \dfrac{2\pi}{|B|}\). The frequency tells how many cycles happen in one unit of time, or in a stated time interval, depending on context.
If a situation gives you a maximum value and a minimum value, then you can find the amplitude and midline directly:
\[\textrm{amplitude} = \frac{\textrm{maximum} - \textrm{minimum}}{2}\]
\[\textrm{midline} = \frac{\textrm{maximum} + \textrm{minimum}}{2}\]
The graph makes an important idea visible: amplitude is a vertical distance, while period is a horizontal distance. Students often confuse those because both describe "size," but they measure different things.
Suppose the maximum height of an object is \(14\) and the minimum height is \(6\). Then the amplitude is \(\dfrac{14-6}{2}=4\), and the midline is \(\dfrac{14+6}{2}=10\). That means the object oscillates \(4\) units above and below \(y=10\).
Amplitude is the distance from the midline to a maximum or minimum.
Midline is the horizontal line halfway between the highest and lowest values of the model.
Period is the length of one complete cycle.
Frequency is how often the cycle repeats in a given interval.
If one cycle takes \(12\) seconds, then the period is \(12\). In a model of the form \(y=A\sin(Bt)+D\) or \(y=A\cos(Bt)+D\), that means \(B = \dfrac{2\pi}{12} = \dfrac{\pi}{6}\).
Two models can describe the same repeating motion, but one may fit the situation more naturally. The choice often depends on what happens at the starting time. As [Figure 2] illustrates, a sine graph naturally starts at the midline when there is no horizontal shift, while a cosine graph naturally starts at a maximum.
Use sine when the quantity begins at the middle value and then moves upward or downward. Use cosine when the quantity begins at a maximum or a minimum. This is not a strict law, because phase shifts can make either function work, but it is a very useful first choice.
For example, if a rider on a wheel starts at the average height and rises, a sine model is often the cleanest. If the rider starts at the top of the wheel, a cosine model usually matches more directly.
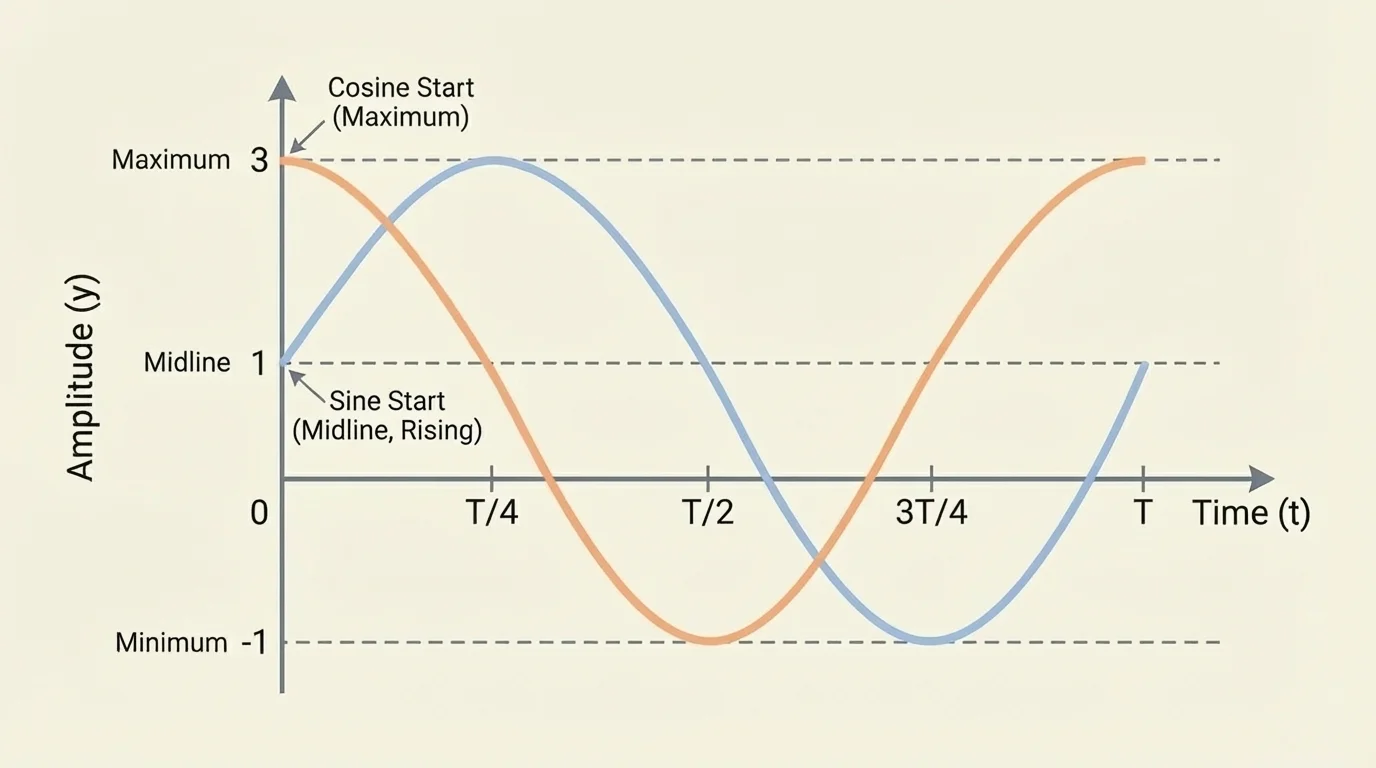
Later, when you solve more complex problems, you may use a phase shift to move the graph left or right so it starts at the correct point. But before shifting, it helps to know the basic "personality" of each function: sine starts in the middle, cosine starts at an extreme.
Choosing the function from the starting condition
If the situation starts at the midline and increases, begin with a positive sine model. If it starts at the midline and decreases, begin with a negative sine model. If it starts at a maximum, begin with a positive cosine model. If it starts at a minimum, begin with a negative cosine model.
This idea is especially useful when a problem says things like "at time \(t=0\), the object is at its highest point" or "the temperature begins at its average value and rises." Those words tell you which basic graph matches the motion most naturally.
It helps to keep the parameters organized. In \(y=A\sin(Bx)+D\) or \(y=A\cos(Bx)+D\):
| Parameter | Meaning | Effect on graph |
|---|---|---|
| \(A\) | Amplitude parameter | Vertical stretch or reflection |
| \(D\) | Midline value | Moves graph up or down |
| \(B\) | Angular frequency | Changes period |
Table 1. The main parameters in a sinusoidal model and how they affect the graph.
The period is \(\dfrac{2\pi}{|B|}\), so if the period gets smaller, \(B\) gets larger. That means faster repetition creates a more tightly packed wave. This relationship is inverse: doubling \(B\) cuts the period in half.
In many applied problems, frequency is given in cycles per unit time. If the frequency is \(f\), then the period is \(\dfrac{1}{f}\), and a common model is written using angular frequency \(B = 2\pi f\). Then the equation becomes
\[y = A\sin(2\pi f t) + D\quad \textrm{or} \quad y = A\cos(2\pi f t) + D\]
For example, if a machine vibrates \(5\) times per second, then \(f=5\), so \(B = 2\pi(5)=10\pi\). If the amplitude is \(2\) and the midline is \(0\), one possible model is \(y=2\sin(10\pi t)\).
When you are given a real-world description, it helps to follow a clear process instead of guessing.
Step 1: Find the maximum and minimum, if given. Use them to compute amplitude and midline.
Step 2: Find the period or frequency. If the period is \(P\), then \(B = \dfrac{2\pi}{P}\). If the frequency is \(f\), then \(B = 2\pi f\).
Step 3: Decide whether sine or cosine fits the starting position most naturally.
Step 4: Check whether the graph should rise first, fall first, start high, or start low. Use a negative sign if needed.
Step 5: Test your model at a few key points, such as the start, one-quarter period, half-period, and full period.
Many natural systems that only approximately repeat are still modeled with sine and cosine because these functions capture the main rhythm even when real data includes small irregularities.
This process works for wheels, waves, temperature cycles, seasonal light levels, alternating current, and many other systems.
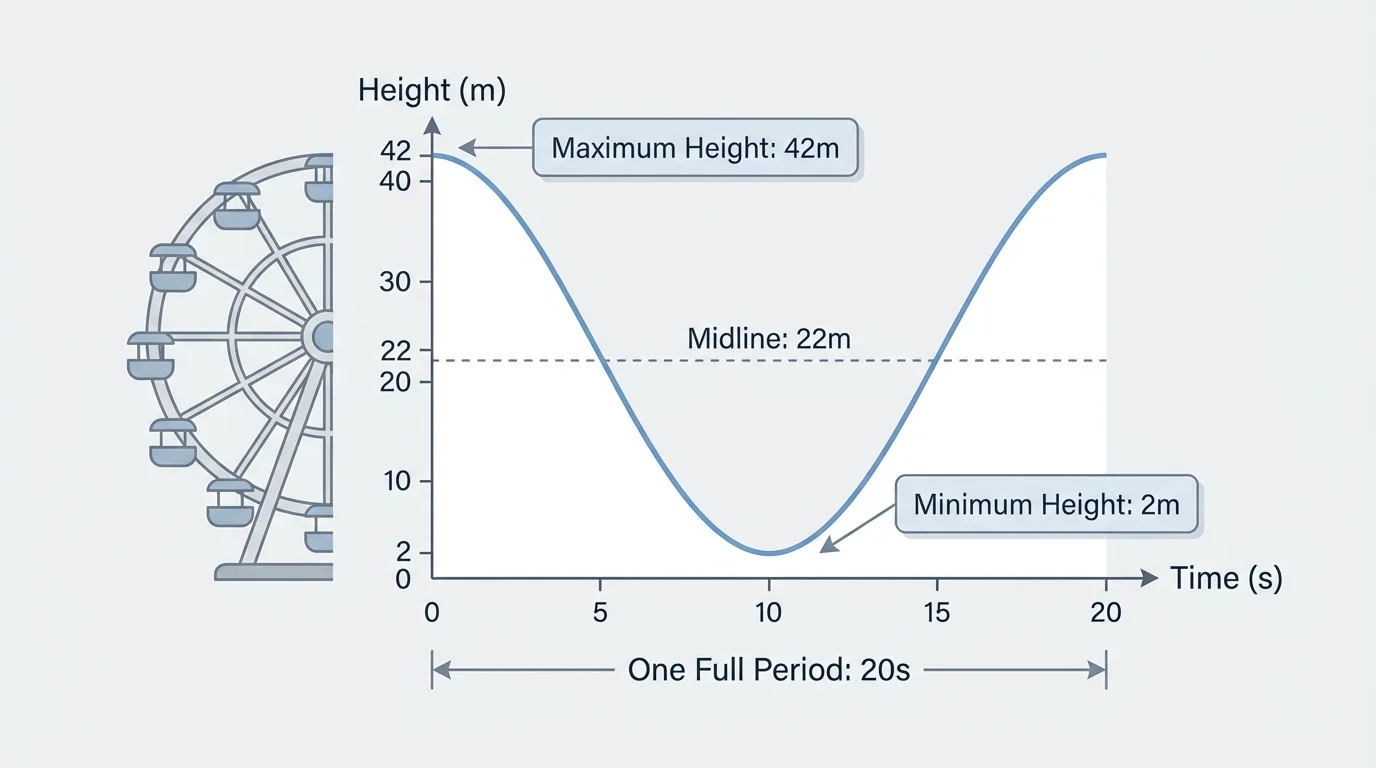
[Figure 3] A Ferris wheel is one of the clearest physical examples of sinusoidal motion, and the graph shows how maximum height, minimum height, and one full revolution connect directly to a cosine graph over time.
Worked example
A rider on a Ferris wheel is at a minimum height of \(2\) meters above the ground and a maximum height of \(42\) meters. One revolution takes \(20\) seconds. At \(t=0\), the rider is at the lowest point. Write a trigonometric model for the rider's height \(h(t)\).
Step 1: Find the amplitude and midline.
Amplitude: \(\dfrac{42-2}{2}=20\)
Midline: \(\dfrac{42+2}{2}=22\)
Step 2: Find \(B\) from the period.
The period is \(20\), so \(B = \dfrac{2\pi}{20} = \dfrac{\pi}{10}\).
Step 3: Choose sine or cosine.
The rider starts at a minimum, so a negative cosine model is natural.
Step 4: Write the equation.
Using amplitude \(20\), midline \(22\), and \(B=\dfrac{\pi}{10}\):
\[h(t) = -20\cos\left(\frac{\pi}{10}t\right) + 22\]
Step 5: Check the start value.
At \(t=0\), \(\cos 0 = 1\), so \(h(0) = -20(1)+22=2\), which matches the minimum height.
The model is \(h(t) = -20\cos\left(\dfrac{\pi}{10}t\right) + 22\).
Notice how the graph reaches the midline after one-quarter of the period, which is \(5\) seconds. It reaches the maximum after half the period, or \(10\) seconds. That timing matches the physical motion of the wheel.
This same reasoning applies to elevators in repeating test cycles, rotating machinery, and even the position of a point on a spinning fan blade.
Not every sinusoidal model begins at a highest or lowest point. Sometimes the quantity starts on the midline and rises, which makes sine a natural choice.
Worked example
The temperature in a climate-controlled greenhouse varies between \(18^\circ\textrm{C}\) and \(30^\circ\textrm{C}\) during a \(24\)-hour cycle. At midnight, the temperature is at the average value and begins increasing. Write a model \(T(t)\), where \(t\) is hours after midnight.
Step 1: Find amplitude and midline.
Amplitude: \(\dfrac{30-18}{2}=6\)
Midline: \(\dfrac{30+18}{2}=24\)
Step 2: Find \(B\).
The period is \(24\), so \(B = \dfrac{2\pi}{24} = \dfrac{\pi}{12}\).
Step 3: Choose the function.
The temperature starts at the midline and increases, so use positive sine.
Step 4: Write the model.
\[T(t) = 6\sin\left(\frac{\pi}{12}t\right) + 24\]
Step 5: Check the start value.
At \(t=0\), \(\sin 0 = 0\), so \(T(0)=24\), the average value. The temperature then rises, as required.
The model is \(T(t) = 6\sin\left(\dfrac{\pi}{12}t\right) + 24\).
At \(t=6\), the argument is \(\dfrac{\pi}{12}\cdot 6 = \dfrac{\pi}{2}\), so the temperature is \(6(1)+24=30\), the maximum. That makes sense because one-quarter of a \(24\)-hour cycle is \(6\) hours.
Sometimes a problem gives frequency directly instead of period. Then using \(B = 2\pi f\) is the fastest method.
Worked example
A sensor tip vibrates with amplitude \(0.4\) millimeters about a midline position of \(1.2\) millimeters. It completes \(8\) cycles each second. At \(t=0\), it is at its maximum displacement. Write a model \(s(t)\).
Step 1: Record the given values.
Amplitude \(A=0.4\), midline \(D=1.2\), frequency \(f=8\).
Step 2: Find \(B\).
Since \(B = 2\pi f\), we get \(B = 2\pi(8)=16\pi\).
Step 3: Choose the function.
The motion starts at a maximum, so cosine is the natural choice.
Step 4: Write the model.
\[s(t) = 0.4\cos(16\pi t) + 1.2\]
Step 5: Check the start value.
At \(t=0\), \(\cos 0 = 1\), so \(s(0)=0.4+1.2=1.6\), which is the maximum position.
The model is \(s(t) = 0.4\cos(16\pi t) + 1.2\).
Because the frequency is \(8\) cycles per second, the period is \(\dfrac{1}{8}\) second. That means the vibration repeats extremely quickly, which is common in precision instruments and electronic devices.
One common mistake is mixing up period and frequency. If a quantity repeats every \(5\) seconds, the period is \(5\), but the frequency is \(\dfrac{1}{5}\) cycle per second. Those are related, but they are not the same.
Another mistake is forgetting the midline. If a situation oscillates around \(y=10\), then the graph must be shifted up by \(10\). A model like \(y=3\sin x\) would oscillate around \(y=0\), which would be wrong for that situation.
Students also sometimes use the maximum or minimum directly as the amplitude. That is only correct when the midline is \(0\). In general, amplitude is the distance from the midline to an extreme, not the extreme value itself.
A negative amplitude does not mean "negative size." It means the graph is reflected. For example, \(y=-4\cos x + 7\) still has amplitude \(4\), midline \(y=7\), maximum \(11\), and minimum \(3\).
Checking a trigonometric model
A correct model should match at least four things: the maximum value, the minimum value, the midline, and the timing of one full cycle. It should also match the starting behavior, such as beginning at a maximum or crossing the midline while rising.
Units matter too. If time is measured in seconds, then the frequency or period must be interpreted in seconds. If a problem switches from minutes to hours without adjustment, the model will be wrong even if the algebra looks correct.
Engineers model rotating parts with trigonometric functions because rotation creates sinusoidal vertical and horizontal motion. Doctors read periodic patterns in heart-monitor data. Physicists describe sound and light waves with sinusoidal models. Meteorologists use sinusoidal approximations for seasonal temperature patterns. In each case, amplitude measures the strength of variation, midline gives the average level, and frequency or period tells how fast the repetition occurs.
Music is a great example of why frequency matters. A higher pitch has a higher frequency, meaning more cycles per second. The waveform repeats more rapidly, even if the amplitude stays the same. In electronics, alternating current is also modeled by sine functions because voltage rises and falls periodically.
Even planetary motion and daylight hours across the year are often approximated by sinusoidal models over limited intervals, which helps scientists and engineers make useful predictions from repeating data.
What makes trigonometric models especially valuable is that they are both visual and predictive. Once the equation is known, you can estimate future values, compare different cycles, and see how changes in one parameter affect the whole pattern.
Suppose a model is \(y = 5\cos\left(\dfrac{\pi}{3}t\right)+12\). You can read several facts immediately. The amplitude is \(5\), the midline is \(y=12\), and the period is \(\dfrac{2\pi}{\pi/3}=6\). The maximum is \(17\), and the minimum is \(7\).
If you substitute \(t=0\), you get \(y=17\), so the graph starts at a maximum. After \(3\) units, which is half the period, it reaches a minimum. This kind of quick interpretation helps you decide whether a model actually matches a situation.
When you choose a model, always ask: Does the amplitude match the size of the variation? Does the midline match the average value? Does the period or frequency match the timing? Does the graph begin in the right place? If the answer to all four questions is yes, your model is likely correct.