One tiny number can explain a whole pattern. If a car travels at a steady speed, if apples cost the same price per pound, or if a recipe keeps the same taste when doubled, there is a single number connecting the two quantities. That number is the constant of proportionality, and once you know how to find it, you can read important information from tables, graphs, equations, diagrams, and even everyday language.
Many real-world situations depend on equal rates. A streaming service charges a constant amount per month. A cyclist rides a constant number of miles each hour. A store sells granola for a constant price per pound. In each case, one quantity changes, and the other changes with it in a perfectly predictable way.
When two quantities are proportional, their relationship can be written in the form \(y = kx\), where constant of proportionality means the number that multiplies one quantity to produce the other. That number, usually written as \(k\), is also the unit rate when it tells the amount for 1 unit of the input.
Proportional relationship is a relationship between two quantities that have a constant ratio.
Constant of proportionality is the fixed number of units of one quantity for each 1 unit of the other quantity.
Unit rate is a rate for 1 unit, such as \(60\) miles per \(1\) hour or 2 dollars per \(1\) notebook.
If \(y\) is proportional to \(x\), then dividing \(y\) by \(x\) gives the same value every time, as long as \(x \neq 0\). This idea is the key to every representation you will see.
Suppose \(4\) notebooks cost \(\$8\). The cost per notebook is \(\dfrac{8}{4} = 2\). So the constant of proportionality is \(2\), and the equation is \(y = 2x\), where \(x\) is the number of notebooks and \(y\) is the cost in dollars. This means every time the number of notebooks increases by \(1\), the cost increases by \(\$2\).
The order matters. If \(y = 2x\), then \(k = \dfrac{y}{x} = 2\). But \(\dfrac{x}{y} = \dfrac{1}{2}\) tells a different rate. Both can be useful, but the constant of proportionality in \(y = kx\) is always \(\dfrac{y}{x}\).
Remember that a ratio compares two quantities, often using division. For example, the ratio of \(8\) dollars to \(4\) notebooks is \(\dfrac{8}{4}\).
A good question to ask is: What does \(k\) mean in this situation? A number by itself is not enough. In a real context, \(k\) should include meaning and units, such as \(5\) miles per hour, \(\$1.50\) per pound, or \(3\) cups of water per batch.
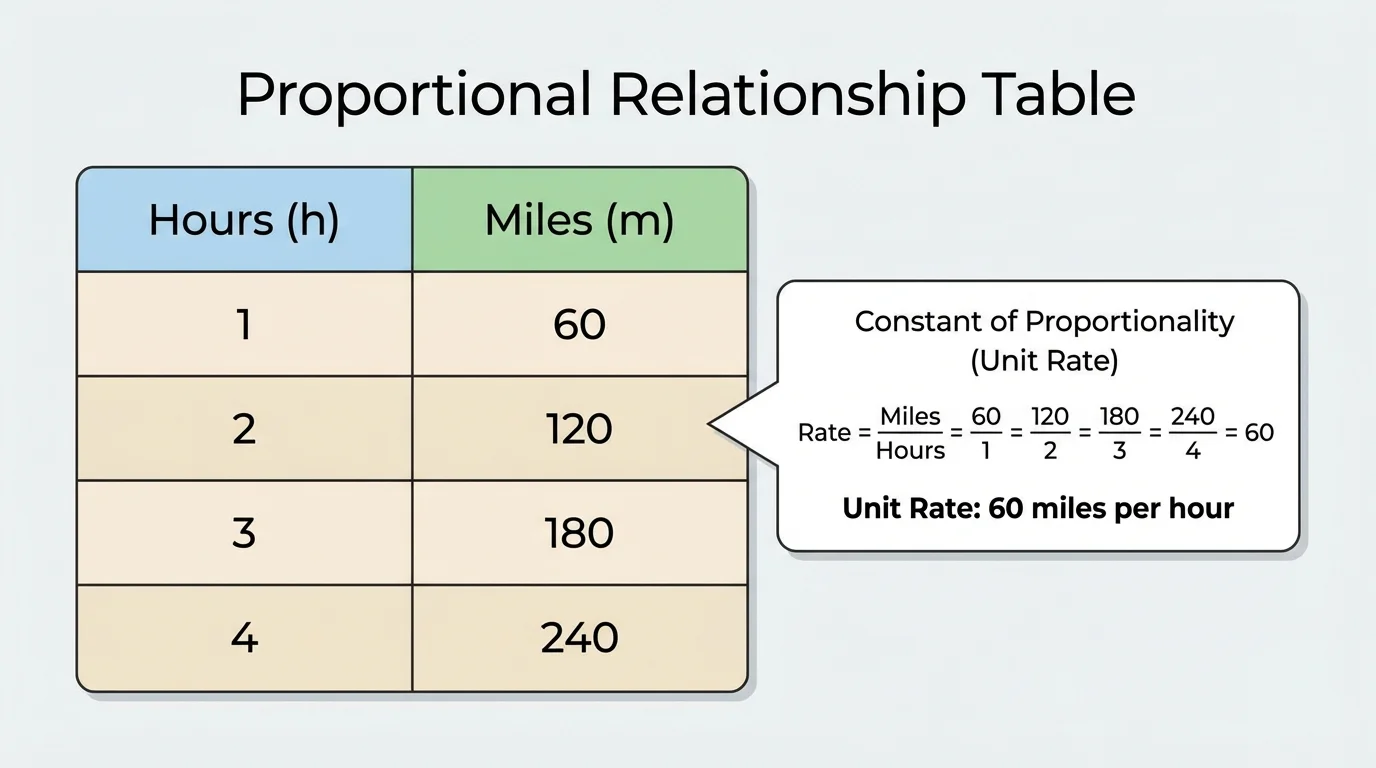
As [Figure 1] shows, in a table, you can test whether the relationship is proportional by dividing each output by the corresponding input. If the quotient stays the same in every row, the relationship is proportional, and that common quotient is the constant of proportionality.
For example, consider a table where \(x\) is hours and \(y\) is miles traveled.
| Hours \(x\) | Miles \(y\) |
|---|---|
| \(1\) | \(18\) |
| \(2\) | \(36\) |
| \(3\) | \(54\) |
| \(5\) | \(90\) |
Table 1. A proportional table relating hours and miles traveled.
Compute the quotient each time: \(\dfrac{18}{1} = 18\), \(\dfrac{36}{2} = 18\), \(\dfrac{54}{3} = 18\), and \(\dfrac{90}{5} = 18\). Since the value is always \(18\), the constant of proportionality is \(18\). The car travels \(18\) miles per hour.
Sometimes the numbers are fractions or decimals, but the idea stays the same. If a table shows \(0.5\) pounds costs \(\$1.25\) and \(2\) pounds costs \(\$5\), then \(\dfrac{1.25}{0.5} = 2.5\) and \(\dfrac{5}{2} = 2.5\). The constant of proportionality is \(\$2.50\) per pound.
Not every table is proportional. If the quotients are different, there is no single constant of proportionality. For example, if \(\dfrac{10}{2} = 5\) but \(\dfrac{21}{4} = 5.25\), the relationship is not proportional. A proportional relationship must keep the same ratio every time.
Solved Example 1: Find the constant from a table
A table shows the number of movie tickets and the total cost.
| Tickets \(x\) | Cost \(y\) |
|---|---|
| \(2\) | \(18\) |
| \(5\) | \(45\) |
| \(7\) | \(63\) |
Table 2. Ticket counts and total costs for a constant ticket price.
Step 1: Divide cost by number of tickets.
\(\dfrac{18}{2} = 9\), \(\dfrac{45}{5} = 9\), and \(\dfrac{63}{7} = 9\).
Step 2: Check whether the quotient stays the same.
Each quotient equals \(9\), so the relationship is proportional.
Step 3: State the constant and its meaning.
The constant of proportionality is \(9\). Each ticket costs \(\$9\).
The equation is \(y = 9x\).
Notice that [Figure 1] highlights an important idea: you are not looking for equal differences between rows. You are looking for equal quotients. In proportional relationships, multiplication matters more than repeated addition.
On a coordinate graph, a proportional relationship forms a straight line that passes through the origin, the point \((0, 0)\). As [Figure 2] illustrates, this feature is one of the fastest ways to recognize proportionality.
If a point \((x, y)\) lies on the line representing a proportional relationship, then the constant of proportionality is \(k = \dfrac{y}{x}\), as long as \(x \neq 0\). For example, if the line passes through \((4, 12)\), then \(k = \dfrac{12}{4} = 3\). That means the equation is \(y = 3x\).
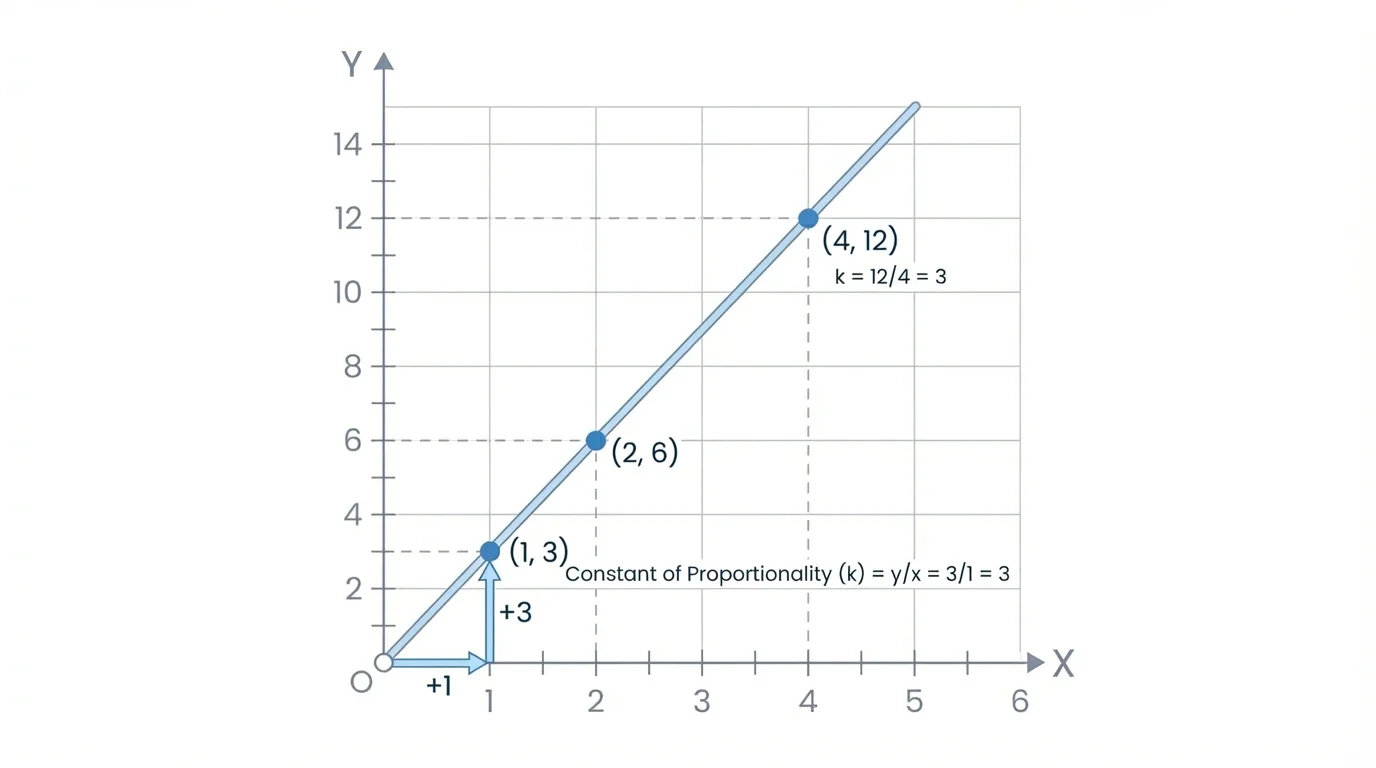
The graph gives a visual meaning to the constant. For every increase of \(1\) in \(x\), the value of \(y\) increases by \(3\). At this level, it is enough to think of this as the amount of \(y\) for each \(1\) unit of \(x\).
If a line is straight but does not pass through the origin, the relationship is not proportional. For example, the line \(y = 2x + 5\) has a constant rate of change, but it is not proportional because when \(x = 0\), \(y = 5\), not \(0\).
Solved Example 2: Find the constant from a graph
A graph shows a line through the origin and the point \((6, 15)\).
Step 1: Use the point on the graph.
The ordered pair is \((x, y) = (6, 15)\).
Step 2: Compute \(\dfrac{y}{x}\).
\(\dfrac{15}{6} = 2.5\).
Step 3: Interpret the result.
The constant of proportionality is \(2.5\). This means \(y\) increases by \(2.5\) for each \(1\) unit increase in \(x\).
The equation is \(y = 2.5x\).
Later, if you compare several points on the same graph, they should all give the same value for \(\dfrac{y}{x}\). That matches the idea from tables and is exactly what you see in [Figure 2].
Equations are often the easiest representation because the constant is built right into the rule. In the equation \(y = kx\), the number multiplying \(x\) is the constant of proportionality.
For example, in \(y = 7x\), the constant of proportionality is \(7\). In \(d = 65t\), the constant is \(65\), which could mean \(65\) miles per hour if \(d\) is distance and \(t\) is time.
Sometimes you need to rewrite the equation first. If you see \(3y = 12x\), divide both sides by \(3\): \(y = 4x\). Now you can see that the constant of proportionality is \(4\).
How the equation connects to the unit rate
The equation \(y = kx\) says that the output is always \(k\) times the input. If \(x = 1\), then \(y = k\). That is why \(k\) is the amount for \(1\) unit.
Be careful with equations like \(y = x + 4\) or \(y = 0.5x - 2\). These are not proportional because they are not of the form \(y = kx\). A proportional equation has no added or subtracted number at the end.
Solved Example 3: Find the constant from an equation
Find the constant of proportionality in \(5c = 20n\).
Step 1: Isolate \(c\).
Divide both sides by \(5\): \(c = 4n\).
Step 2: Identify the coefficient of \(n\).
The number multiplying \(n\) is \(4\).
Step 3: State the constant.
The constant of proportionality is \(4\).
If \(c\) is cost and \(n\) is the number of items, then each item costs \(\$4\).
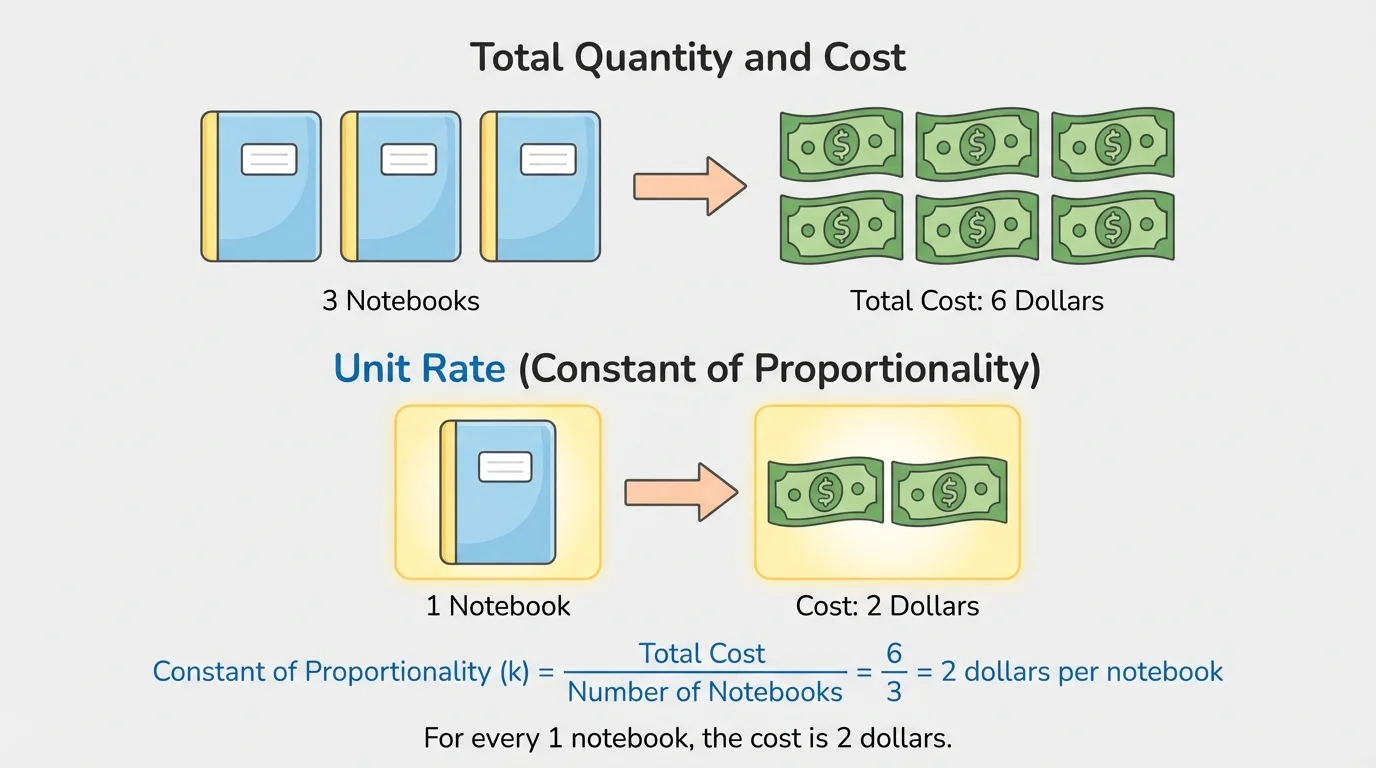
As [Figure 3] shows, a diagram can make a proportional relationship easier to see because it shows equal groups or matching parts. Here, \(3\) notebooks match \(\$6\). Since each notebook is one equal part of the total, the cost for \(1\) notebook is \(\dfrac{6}{3} = 2\) dollars.
Diagrams often use bars, tape models, or pictures of equal groups. The main strategy is to find the amount for \(1\) unit. Once you know that, you know the constant of proportionality.
In verbal descriptions, clue words often reveal a proportional relationship. Words and phrases like per, for each, for every, and at a rate of are strong signs that a unit rate is involved.
For example, "A runner travels \(8\) miles in every \(1\) hour" means the constant of proportionality is \(8\). If \(d\) is distance and \(h\) is time, then \(d = 8h\).
Another example is "A baker uses \(3\) cups of flour for every \(2\) batches of bread." Here, if flour is \(y\) and batches are \(x\), then \(k = \dfrac{3}{2} = 1.5\). The constant of proportionality is \(1.5\) cups per batch.
Solved Example 4: Find the constant from a verbal description
A gym charges \(\$12\) for every \(3\) visits.
Step 1: Identify the two quantities.
The quantities are cost and number of visits.
Step 2: Find the amount for \(1\) visit.
\(\dfrac{12}{3} = 4\).
Step 3: State the constant and equation.
The constant of proportionality is \(4\), meaning \(\$4\) per visit. If \(c\) is cost and \(v\) is visits, then \(c = 4v\).
Looking back at [Figure 3], the same strategy appears again: split the total into equal unit parts, then read the value of one part. That is the unit rate.
The same proportional relationship can appear in many forms. Suppose a taxi charges \(\$3\) per mile. You might see:
Professional sports analysts often use unit rates. A batter's statistics, a runner's pace, or a basketball player's points per minute all depend on comparing one amount to a single unit of another amount.
Being able to move between representations is powerful. If you know the unit rate from one form, you can create the others. For example, if a recipe uses \(2.5\) cups of water per batch, then the equation is \(w = 2.5b\), the graph passes through the origin, and every row in a matching table gives \(\dfrac{w}{b} = 2.5\).
One common mistake is mixing up which quantity should be divided by which. If the equation is \(y = kx\), then \(k = \dfrac{y}{x}\), not \(\dfrac{x}{y}\). Always pay attention to what the variables represent.
Another mistake is assuming that a straight line on a graph is always proportional. A graph must both be a straight line and pass through the origin.
Students also sometimes look for equal differences in a table instead of equal ratios. Equal differences can happen in nonproportional situations. Proportional relationships require a constant multiplicative comparison.
Finally, do not forget units. Saying the constant is \(6\) is incomplete unless the context makes clear whether that means \(6\) dollars per item, \(6\) miles per hour, or something else.
Prices are one of the most common examples. If oranges cost \(\$1.80\) per pound, then the constant of proportionality is \(1.8\). This helps shoppers compare deals quickly.
Speed is another important example. If a train moves \(90\) miles in \(1.5\) hours, then the unit rate is \(\dfrac{90}{1.5} = 60\). The train's speed is \(60\) miles per hour.
In map reading, scale creates a proportional relationship. If \(1\) centimeter on a map represents \(5\) kilometers in real life, then the constant of proportionality is \(5\) kilometers per centimeter.
Scientists and engineers also use proportional reasoning. A machine that produces \(40\) parts every \(2\) minutes has a unit rate of \(20\) parts per minute. That single number helps predict output, compare efficiency, and plan schedules.
"The power of mathematics is often to change one thing into another, to change geometry into language."
— Marcus du Sautoy
When you identify the constant of proportionality, you are doing exactly that: turning a pattern into one meaningful number that can be used to describe, compare, and predict.