A tiny change in a formula can completely change what you see on a graph. Engineers adjust signals, economists rescale models, and scientists shift data to compare patterns more clearly. In all of these cases, the shape often stays related to the original, but its position, width, or orientation changes. Learning how to read these changes quickly is one of the most powerful graphing skills in algebra.
Suppose you begin with a function \(y=f(x)\). This is your original graph. When you build a new function from it, you are not starting over from scratch. Instead, you are transforming the original graph in a predictable way.
It helps to think in terms of input and output. In \(f(x)\), the variable \(x\) is the input, and the value \(f(x)\) is the output. Some transformations change the output values. Others change the inputs before they go into the function. That difference explains why some changes are vertical and others are horizontal.
Function transformation means changing a function in a way that moves, stretches, compresses, or reflects its graph.
Vertical transformations affect the output values, so they change the graph up, down, or in height.
Horizontal transformations affect the input values, so they change the graph left, right, or in width.
For example, if the original graph contains the point \((2,5)\), then a vertical change may keep \(x=2\) but alter the \(y\)-value. A horizontal change may keep \(y=5\) but move the point to a different \(x\)-coordinate.
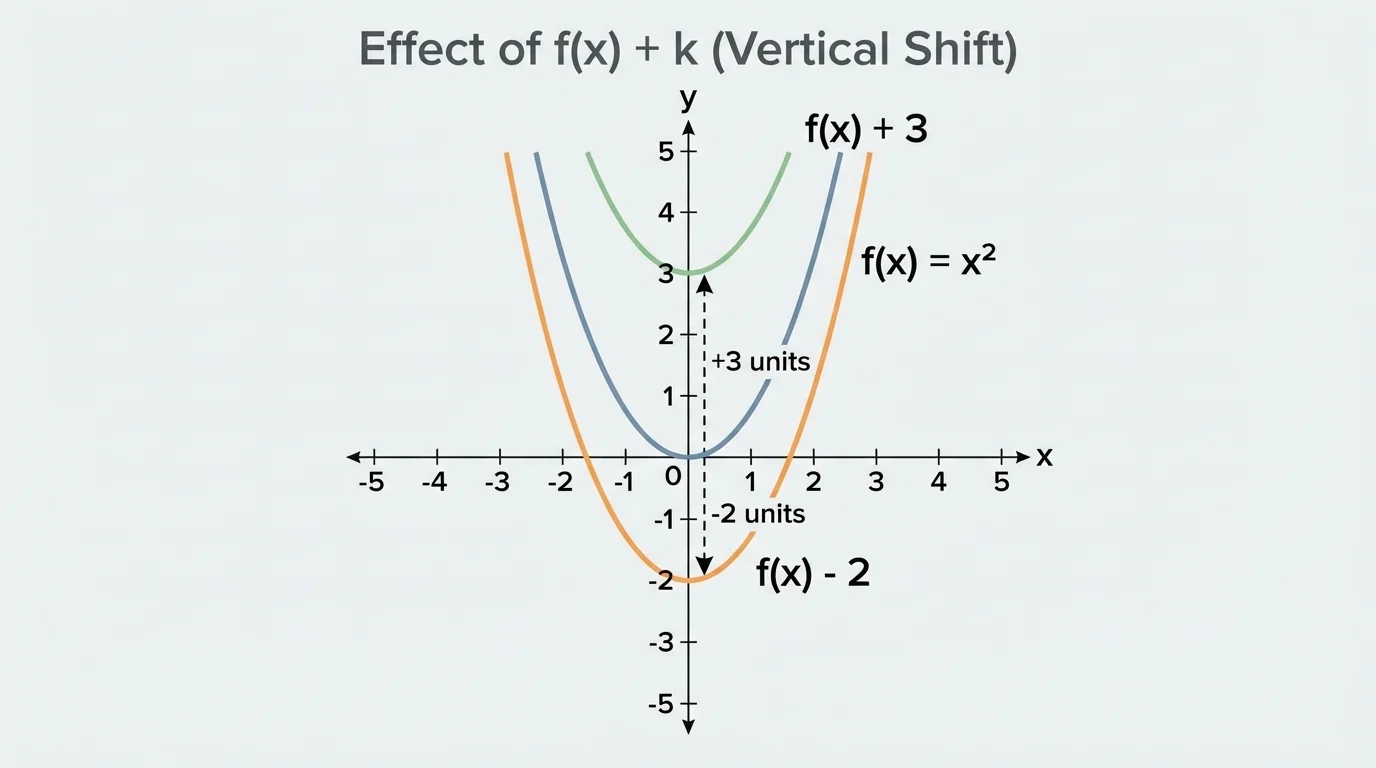
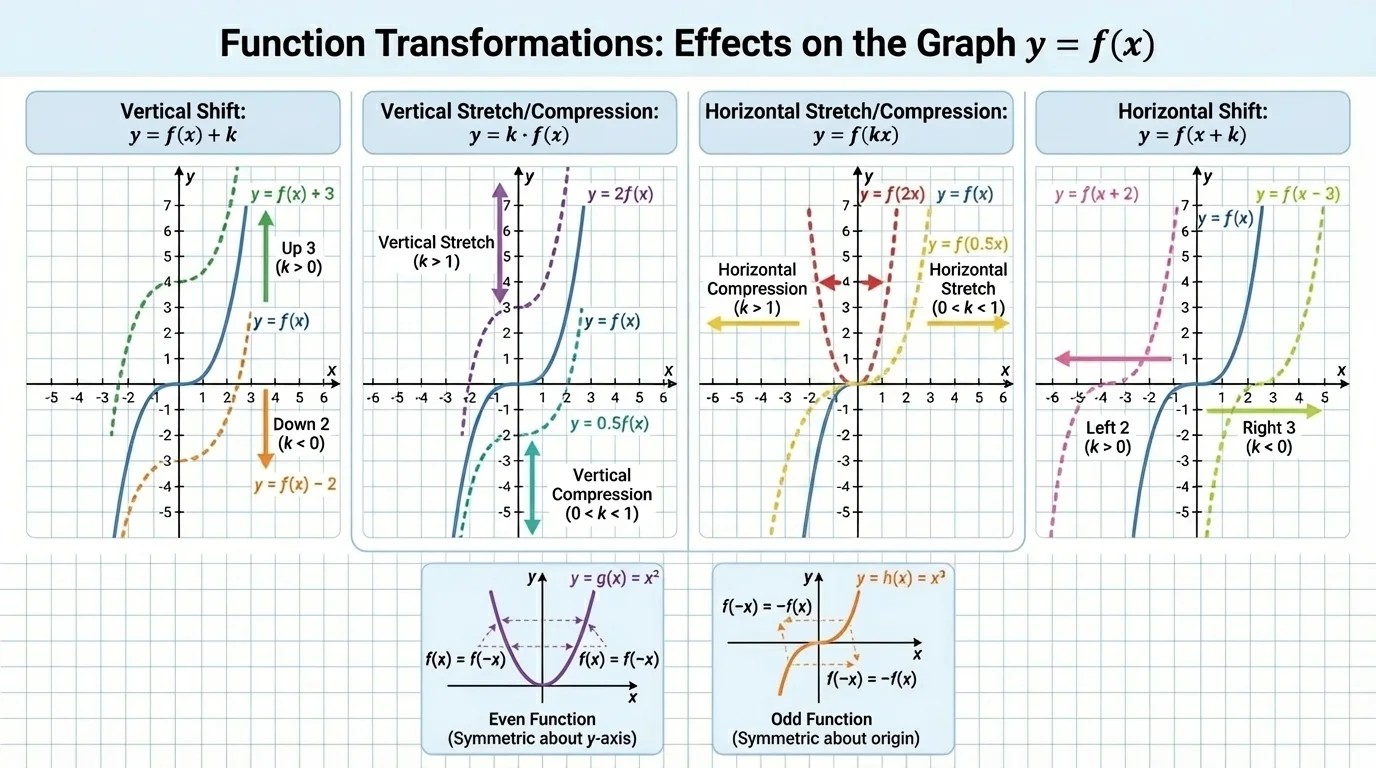
When you replace \(f(x)\) by \(f(x)+k\), every output increases by \(k\). That means the entire graph moves up or down by the same number of units, as shown in [Figure 1]. The shape does not change, and the graph is not stretched or squeezed.
If \(k>0\), the graph shifts up. If \(k<0\), the graph shifts down.
Examples:
If \(y=x^2\), then \(y=x^2+3\) is the parabola shifted up \(3\) units.
If \(y=x^2\), then \(y=x^2-2\) is the parabola shifted down \(2\) units.
A useful way to track this is through points. If \((a,b)\) lies on \(y=f(x)\), then \((a,b+k)\) lies on \(y=f(x)+k\). Notice that the \(x\)-coordinate stays the same while the \(y\)-coordinate changes.
This affects intercepts in predictable ways. A graph shifted upward may lose \(x\)-intercepts if it moves above the \(x\)-axis. A graph shifted downward may gain new \(x\)-intercepts. The vertex of a parabola also moves straight up or down under this transformation.
Solved example 1
The graph of \(y=f(x)\) passes through \((1,4)\), \((3,-2)\), and \((5,6)\). What points are on the graph of \(y=f(x)-3\)?
Step 1: Identify the transformation.
Replacing \(f(x)\) with \(f(x)-3\) shifts the graph down \(3\) units.
Step 2: Subtract \(3\) from each \(y\)-value.
\((1,4)\rightarrow (1,1)\)
\((3,-2)\rightarrow (3,-5)\)
\((5,6)\rightarrow (5,3)\)
Step 3: State the transformed points.
The new graph contains \((1,1)\), \((3,-5)\), and \((5,3)\).
The shape remains the same; only the vertical position changes.
When you compare graphs later, the vertical movement seen in [Figure 1] is often the fastest clue that the transformation is \(f(x)+k\), not a stretch or a horizontal shift.
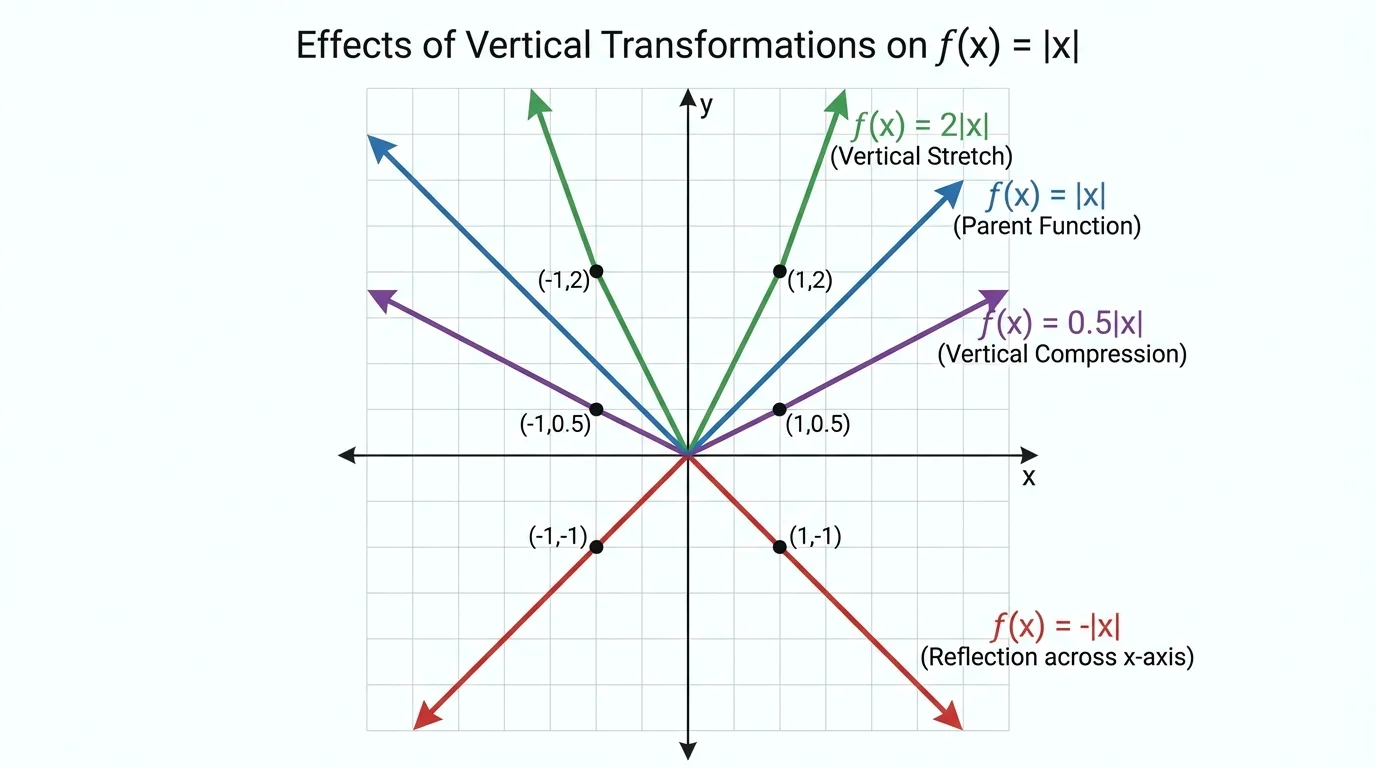
[Figure 2] Now the constant multiplies the output. In \(k f(x)\), each \(y\)-value is multiplied by \(k\), while each \(x\)-value stays the same. This changes the height of the graph.
If \(|k|>1\), the graph is stretched vertically. Points move farther from the \(x\)-axis.
If \(0<|k|<1\), the graph is compressed vertically. Points move closer to the \(x\)-axis.
If \(k<0\), there is also a reflection across the \(x\)-axis because positive outputs become negative and negative outputs become positive.
Examples:
If \(y=x^2\), then \(y=2x^2\) is a vertical stretch by a factor of \(2\).
If \(y=x^2\), then \(y=\dfrac{1}{2}x^2\) is a vertical compression by a factor of \(\dfrac{1}{2}\).
If \(y=x^2\), then \(y=-x^2\) reflects the graph across the \(x\)-axis.
If \((a,b)\) is on \(y=f(x)\), then \((a,kb)\) is on \(y=kf(x)\). Again, the \(x\)-coordinate is unchanged.
Why multiplication looks different from addition
Adding \(k\) to \(f(x)\) changes every output by the same amount. Multiplying by \(k\) changes outputs proportionally. So \(f(x)+k\) slides the graph, while \(k f(x)\) changes its vertical size. A point with output \(10\) changes more under multiplication than a point with output \(2\).
This is why a vertical stretch changes the shape's steepness. For a parabola, the graph becomes narrower when stretched vertically and wider when compressed vertically, even though the transformation is still considered vertical.
Solved example 2
The point \((-2,3)\) lies on \(y=f(x)\). Find the corresponding point on \(y=-2f(x)\).
Step 1: Identify what changes.
The transformation multiplies the output by \(-2\). The input stays \(-2\).
Step 2: Multiply the \(y\)-value.
\(3\cdot (-2)=-6\).
Step 3: Write the new point.
The corresponding point is \((-2,-6)\).
The negative sign reflects the point across the \(x\)-axis, and the factor \(2\) doubles its distance from the axis.
Later, when identifying transformations from graphs, remember that the pattern in [Figure 2] keeps all \(x\)-coordinates aligned while changing the vertical distances.
[Figure 3] This transformation is one of the most confusing at first. In \(f(kx)\), the constant multiplies the input, so the graph changes horizontally in a way that looks reversed.
If \(|k|>1\), the graph is compressed horizontally. It becomes narrower because the same output is reached with smaller \(x\)-values.
If \(0<|k|<1\), the graph is stretched horizontally. It becomes wider.
If \(k<0\), the graph also reflects across the \(y\)-axis because the input changes sign.
Examples:
If \(y=x^2\), then \(y=(2x)^2=4x^2\). Algebraically this looks like a vertical stretch, but from the transformation viewpoint \(f(2x)\) means a horizontal compression of the graph of \(f(x)=x^2\). Both descriptions are consistent for this specific function, which is one reason quadratic examples can be tricky.
If \(y=|x|\), then \(y=|3x|\) is horizontally compressed by a factor of \(\dfrac{1}{3}\).
If \(y=|x|\), then \(y=\left|\dfrac{1}{2}x\right|\) is horizontally stretched by a factor of \(2\).
The point rule is helpful. If \((a,b)\) lies on \(y=f(x)\), then \(\left(\dfrac{a}{k},b\right)\) lies on \(y=f(kx)\), provided \(k\neq 0\). Notice the division by \(k\). That is the source of the "opposite-looking" effect.
For horizontal transformations, signs and scale factors often feel reversed because they act on the input before the function is evaluated. If you are unsure, test a known point from the original graph and see where it must move.
This reversal matters a lot. If students see \(f(3x)\), many first guess "stretch by \(3\)." But because the graph reaches the same outputs three times faster in the horizontal direction, it is actually a compression by a factor of \(\dfrac{1}{3}\).
When a number is added inside the input, the graph shifts left or right. This is another case where the sign can feel backward.
If \(y=f(x+k)\), then the graph shifts left by \(k\) units when \(k>0\).
If \(y=f(x+k)\), then the graph shifts right by \(|k|\) units when \(k<0\).
Examples:
If \(y=x^2\), then \(y=(x+4)^2\) shifts left \(4\) units.
If \(y=x^2\), then \(y=(x-3)^2\) shifts right \(3\) units.
If \((a,b)\) lies on \(y=f(x)\), then \((a-k,b)\) lies on \(y=f(x+k)\). The output stays the same, but the point moves horizontally.
The left-right behavior contrasts with the up-down behavior of \(f(x)+k\). In a vertical shift, the graph keeps the same \(x\)-coordinates. In a horizontal shift, it keeps the same \(y\)-values at different \(x\)-positions. The comparison with [Figure 3] makes this distinction easier to see because both involve changes based on the input.
Solved example 3
The graph of \(y=f(x)\) has a maximum point at \((2,7)\). What is the maximum point of \(y=f(x+5)\)?
Step 1: Identify the transformation.
\(f(x+5)\) shifts the graph left \(5\) units.
Step 2: Shift the \(x\)-coordinate.
Starting from \((2,7)\), move left \(5\) units: \(2-5=-3\).
Step 3: Keep the \(y\)-value the same.
The new maximum point is \((-3,7)\).
This example shows why a positive number inside the function causes a left shift.
Often you will be shown an original graph and a transformed graph and asked to determine \(k\). The strategy is to look for a clear landmark such as a vertex, endpoint, intercept, maximum, minimum, or another easy-to-read point.
Ask two questions: What kind of change happened? and How much did it change?
If every point moved up by the same amount, compare corresponding \(y\)-values to find \(k\) in \(f(x)+k\).
If every output was multiplied, compare vertical distances from the \(x\)-axis to find \(k\) in \(k f(x)\).
If the graph became wider or narrower, compare corresponding \(x\)-values to find \(k\) in \(f(kx)\).
If the graph moved left or right without changing shape, compare corresponding \(x\)-coordinates to find \(k\) in \(f(x+k)\).
Solved example 4
The graph of \(y=f(x)\) has a vertex at \((1,-2)\). A new graph has the same shape and a vertex at \((1,3)\). If the new graph is \(y=f(x)+k\), find \(k\).
Step 1: Compare the vertices.
The \(x\)-coordinate stays \(1\), so this matches a vertical shift.
Step 2: Compare the \(y\)-values.
The vertex moved from \(-2\) to \(3\).
So \(k=3-(-2)=5\).
Step 3: State the result.
The transformation is \(y=f(x)+5\).
The graph shifted up \(5\) units.
A similar method works for horizontal shifts. If a point moves from \((4,6)\) to \((1,6)\), the graph moved left \(3\) units, so the new function is \(f(x+3)\).
Solved example 5
The graph of \(y=f(x)\) passes through \((4,8)\). The graph of \(y=f(kx)\) passes through \((2,8)\). Find \(k\).
Step 1: Use the point relationship for \(f(kx)\).
If \((a,b)\) is on \(f(x)\), then \(\left(\dfrac{a}{k},b\right)\) is on \(f(kx)\).
Step 2: Substitute the known values.
Since \((4,8)\) becomes \((2,8)\), we have \(\dfrac{4}{k}=2\).
Step 3: Solve for \(k\).
\(4=2k\), so \(k=2\).
The new function is \(f(2x)\), which is a horizontal compression.
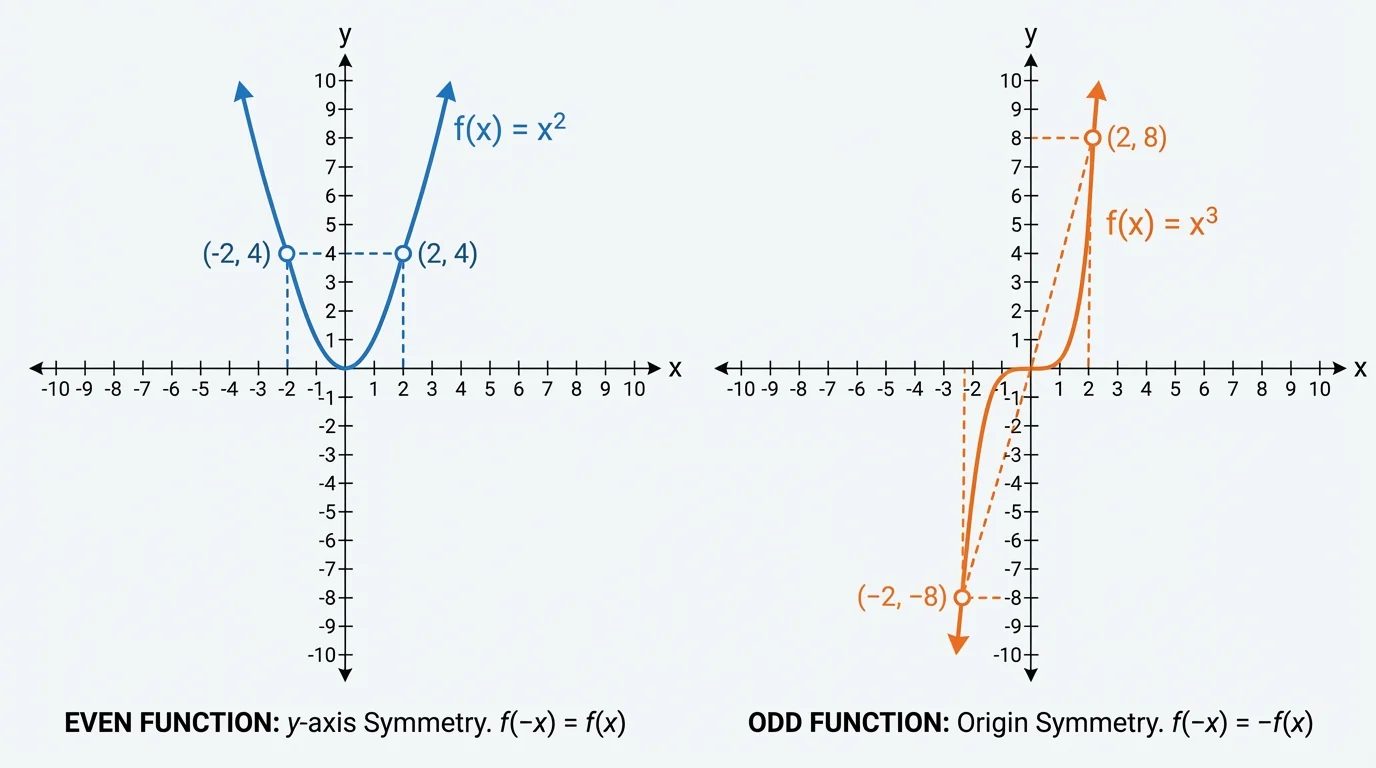
[Figure 4] Some graphs have special symmetry that tells you something important about the function. The visual tests help you recognize these patterns quickly.
An axis of symmetry is a line that divides a figure so that one side is a mirror image of the other. For many even functions, that symmetry line is the \(y\)-axis.
A function is even if
\(f(-x)=f(x)\)
This means the graph is symmetric about the \(y\)-axis.
Examples of even functions include \(f(x)=x^2\), \(f(x)=|x|\), and \(f(x)=x^4-3x^2\).
A function is odd if
\(f(-x)=-f(x)\)
This means the graph has origin symmetry. If you rotate the graph \(180^\circ\) about the origin, it matches itself.
Examples of odd functions include \(f(x)=x^3\), \(f(x)=x\), and \(f(x)=x^5-2x^3\).
To test algebraically, replace \(x\) with \(-x\) and simplify.
Solved example 6
Determine whether \(f(x)=3x^4-2x^2+7\) is even, odd, or neither.
Step 1: Compute \(f(-x)\).
\(f(-x)=3(-x)^4-2(-x)^2+7\).
Step 2: Simplify.
Since \((-x)^4=x^4\) and \((-x)^2=x^2\), we get \(f(-x)=3x^4-2x^2+7\).
Step 3: Compare with \(f(x)\).
Because \(f(-x)=f(x)\), the function is even.
The graph is symmetric about the \(y\)-axis, matching the pattern shown in [Figure 4].
A function can also be neither. For example, \(f(x)=x^2+x\) is not even and not odd because \(f(-x)=x^2-x\), which is neither equal to \(f(x)\) nor to \(-f(x)\).
Many physical and engineering systems naturally produce even or odd relationships. For instance, some energy formulas depend on \(x^2\), making them even, while some motion or current models use odd powers that preserve direction through sign.
Graphing technology makes transformations much easier to understand because you can change values of \(k\) instantly and watch the graph respond. A graphing calculator or a tool such as Desmos lets you enter an original function and several transformed versions at the same time.
For example, graph \(y=x^2\), \(y=x^2+k\), \(y=kx^2\), \(y=(kx)^2\), and \(y=(x+k)^2\). Then slide \(k\) through values such as \(-3\), \(-1\), \(\dfrac{1}{2}\), \(2\), and \(4\). Notice these patterns:
Technology also helps reveal common misconceptions. For example, compare \(f(x+2)\) and \(f(x)+2\). They are not the same transformation. One is horizontal, the other is vertical.
These transformations are not just classroom patterns. In signal processing, multiplying a function by a constant changes amplitude, which is like \(k f(x)\). In timing adjustments, replacing \(x\) by \(x+k\) or \(kx\) can model delays or speed changes in a repeating signal.
In physics, a height function may be shifted to account for the ground level in a different location, producing something like \(f(x)+k\). In economics, a model can be rescaled when money units or production units change, which often creates multiplicative transformations.
Symmetry matters too. Even functions can model situations where direction does not matter, such as distance from a center. Odd functions can model situations where direction matters and changing direction changes the sign, such as certain velocity or force relationships.
The most important habit is to ask whether the change is happening outside the function or inside the function. Outside changes usually affect outputs vertically. Inside changes usually affect inputs horizontally.
| New function | Main effect | If \(k>0\) | If \(k<0\) |
|---|---|---|---|
| \(f(x)+k\) | Vertical shift | Up \(k\) units | Down \(|k|\) units |
| \(k f(x)\) | Vertical scale | Stretch if \(k>1\), compression if \(0<k<1\) | Reflection across \(x\)-axis and scaling |
| \(f(kx)\) | Horizontal scale | Compression if \(k>1\), stretch if \(0<k<1\) | Reflection across \(y\)-axis and scaling |
| \(f(x+k)\) | Horizontal shift | Left \(k\) units | Right \(|k|\) units |
Table 1. A comparison of the four common function transformations and the effect of positive or negative values of \(k\).
The "reversed" behavior inside the function is one of the biggest ideas in this topic. Once you understand that \(x\) is being altered before the function acts, transformations like \(f(kx)\) and \(f(x+k)\) become much more logical.
Do not confuse \(f(x)+k\) with \(f(x+k)\). The first is a vertical shift, and the second is a horizontal shift.
Do not assume \(f(kx)\) stretches by \(k\). For horizontal changes, the effect is reversed: larger \(k\) means more compression.
Do not decide even or odd from a formula by inspection alone unless you can justify it. Always test \(f(-x)\).
Do not forget that negative values of \(k\) can create reflections: across the \(x\)-axis for \(k f(x)\), and across the \(y\)-axis for \(f(kx)\).
"A transformed graph is not a new mystery; it is the original graph following a rule."
Once you can connect each algebraic form to a visual effect, graphs become easier to read and equations become easier to interpret. That connection is one of the foundations of building new functions from existing ones.