A storm can begin over warm ocean water, travel hundreds of miles, and change life in several countries within days. How do people know where it may go, who is most at risk, and what should be done first? They do not guess. They study geographic evidence. Geography is not only about knowing where places are. It is also about using information from places to understand what is happening, what may happen next, and what choices people should make.
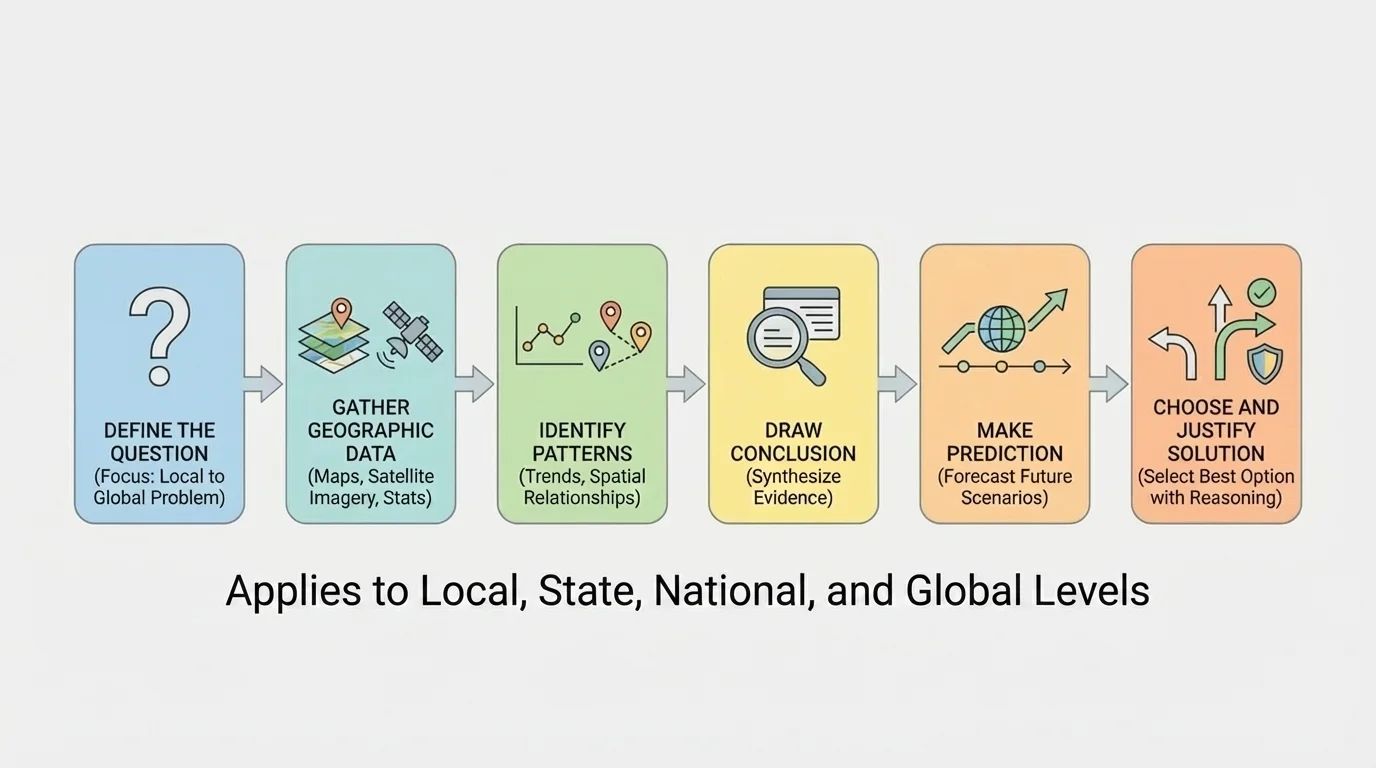
When geographers study a place, they ask questions such as: Where is the problem happening? What patterns do we notice? How are people and the environment connected there? What evidence supports one solution over another? These questions matter in a neighborhood, a state, a country, and the whole world.
In the Western Hemisphere, geographers might study wildfire risk in California, hurricane paths in the Caribbean, water shortages in northern Mexico, melting ice in Greenland, or rainforest loss in South America. In each case, they use information from maps, measurements, images, and records to draw conclusions and make predictions.
Geographic data are facts and measurements about places. They can include population numbers, rainfall totals, temperatures, land use, elevation, and transportation routes.
Evidence is the information used to support an idea or answer a question. In geography, evidence often comes from maps, graphs, tables, photographs, satellite images, and field observations.
Inference is a conclusion based on evidence and reasoning rather than a simple guess.
Good geographic thinking is a little like being a detective. A detective does not solve a case using only one clue. In the same way, a geographer should not rely on only one map or one number. Strong conclusions come from comparing several kinds of evidence.
Geographic evidence helps people make decisions that affect safety, resources, transportation, housing, farming, and the environment. A city may need to decide where to build a new park. A state may need to manage drought. A nation may need to prepare for migration after a disaster. The world may need to respond to climate change and sea-level rise.
Places are connected. For example, if forests are removed in one region, soil may erode, rivers may carry more sediment, and communities far downstream may face flooding. If a port closes after a hurricane, trade can slow in other regions. Geography helps us see these connections across space.
The Amazon rainforest affects weather far beyond Brazil. Water released by trees into the air helps shape rainfall patterns in other parts of South America, which means land-use changes in one area can influence farming and water supplies in another.
Because geographic problems involve both people and the environment, solutions must be based on clear evidence. A solution that works in one location may not work in another. A desert city, a mountain town, and a coastal island face different challenges because their locations and environments are different.
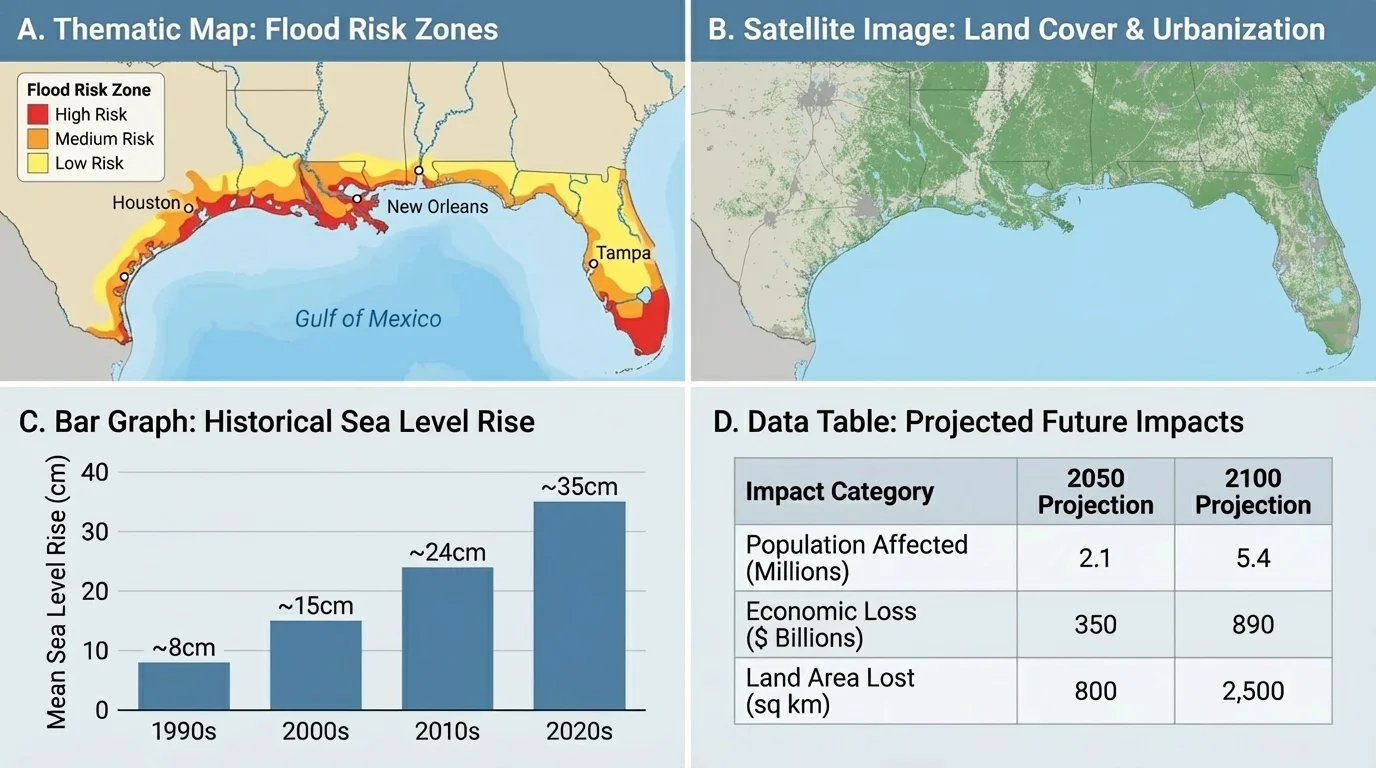
[Figure 1] Geographers combine many tools to understand one place. A paper map may show roads and rivers. A satellite image may reveal cloud cover, vegetation, or city growth. A chart may show rainfall over time. A table may compare population in different regions. When these sources are used together, they provide a fuller picture.
One important source is a thematic map. Unlike a general map that shows many features, a thematic map focuses on one topic, such as climate, language, population density, or natural hazards. A climate map of the Western Hemisphere can help us compare tropical, temperate, and polar climate zones. A population map can show where people are concentrated and where land is sparsely settled.
Another useful source is a satellite image. Satellite images can show storms, smoke from wildfires, shrinking glaciers, or changes in forests over time. Governments and scientists often compare images from different years to see how a place has changed.
Geographers also use GIS, or Geographic Information Systems. GIS is a computer system that stores and layers geographic information. For example, a GIS map can combine roads, rivers, population, and flood zones. This helps planners see where many factors overlap.
Other important sources include census data, weather records, elevation maps, and interviews with people who live in the area. If a geographer studies water use in a city, they might compare rainfall totals, reservoir levels, population growth, and household water use.
Each source has strengths and limits. A map can show where something is, but it may not explain why it is there. A graph can show change over time, but it may not show spatial patterns. That is why geographers look at multiple sources before making a conclusion.
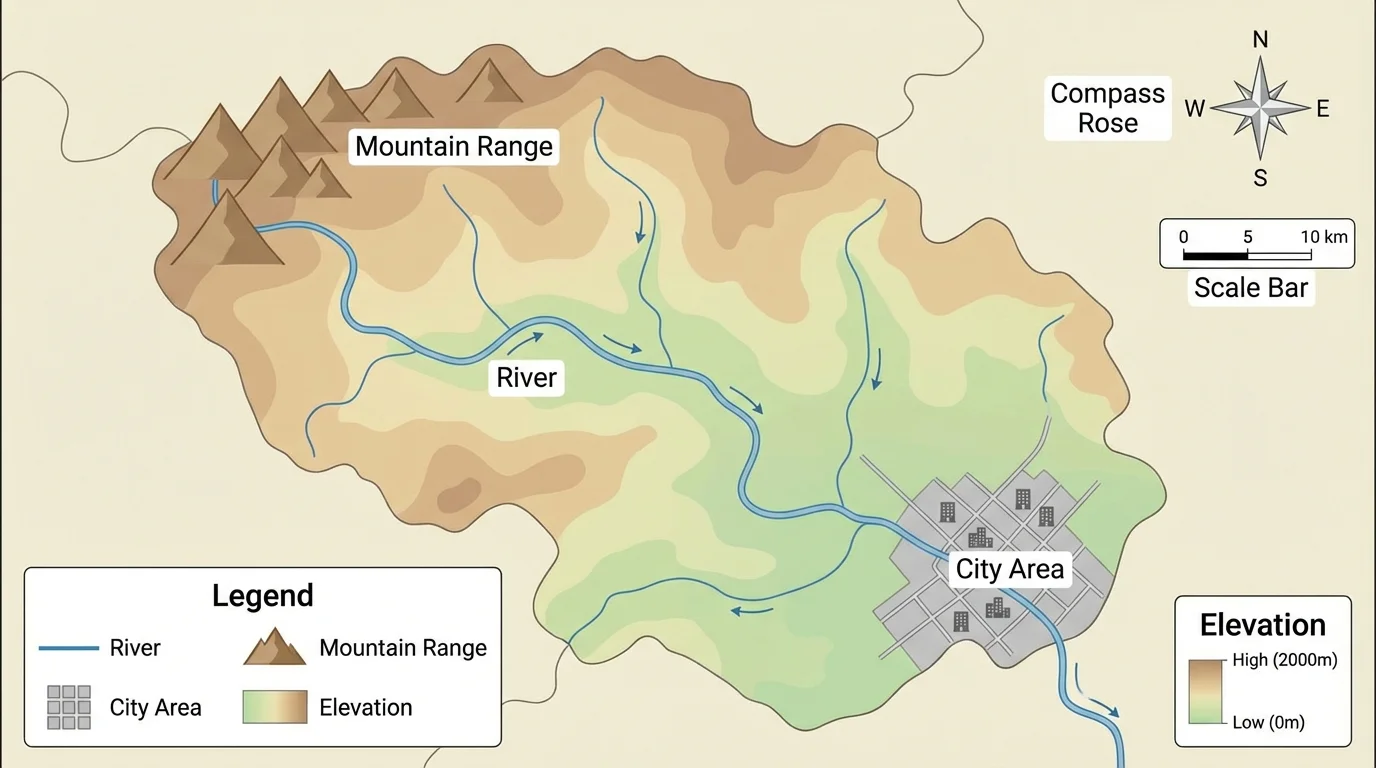
[Figure 2] Maps are powerful because they show spatial relationships and illustrate the main parts that help us read them correctly. To understand a map, look at the title, legend, scale, compass rose, and labels. These features tell us what the map is about, what symbols mean, how far apart places are, and which direction places lie.
Location is one of the first things geographers study. Absolute location tells the exact position of a place using coordinates. Relative location describes where a place is compared with other places, such as "south of the Great Lakes" or "near the Gulf of Mexico." Relative location often helps explain why a place faces certain opportunities or risks.
Geographers also look for spatial patterns. A spatial pattern is the way something is arranged across an area. For example, large cities in South America are often near coasts or major rivers. In the western United States, many areas with low rainfall also have concerns about water supply. In the Caribbean, islands in hurricane pathways may face repeated storm risk.
Elevation matters too. Mountains can block moist air, causing one side to receive more rain and the other side to remain dry. This helps explain why nearby places can have different climates. A physical map with elevation shading can help students see how landforms shape weather, travel, and settlement.
Scale is another important idea. A large-scale map shows a smaller area in greater detail, such as one city. A small-scale map shows a larger area with less detail, such as all of North America. If you want to locate a school evacuation route, a city map works better. If you want to compare hurricane zones across the Caribbean, a regional map works better.
Earlier map skills still matter here: cardinal directions, symbols, and legends are not separate from higher-level geography. They are the tools that make careful interpretation possible.
When geographers read maps well, they begin to answer deeper questions. Why are farms clustered in one valley? Why do most roads avoid steep mountains? Why are people moving toward certain cities? Patterns on maps often point toward explanations.
Drawing a conclusion means using evidence to answer a question. Suppose a map shows that neighborhoods near a river flood more often, a rainfall chart shows frequent heavy storms, and a land-use map shows that many wetlands were replaced by pavement. A strong conclusion is that flood risk has increased because water now runs off hard surfaces more quickly and has fewer natural places to spread out.
A conclusion should be based on more than one piece of evidence. If one source suggests a pattern but other sources do not support it, the conclusion may be weak. Geographers compare sources, ask whether the data are recent, and check whether the evidence fits together.
Cause and effect are important in geography, but they are not always simple. For example, a city may grow quickly because of jobs, transportation routes, and climate all at once. A drought may be made worse by both low rainfall and high water use. Good conclusions notice that several factors can work together.
From observation to inference
An observation is something directly seen in the data, such as "population increased near the coast." An inference goes a step further, such as "people may be moving there because ports, jobs, and mild climate attract settlement." Strong inferences are supported by additional evidence, such as employment maps or transportation data.
Geographers also compare places. If two cities have similar climates but different water problems, then the difference may come from population size, infrastructure, or management choices. Comparison helps separate environmental causes from human causes.
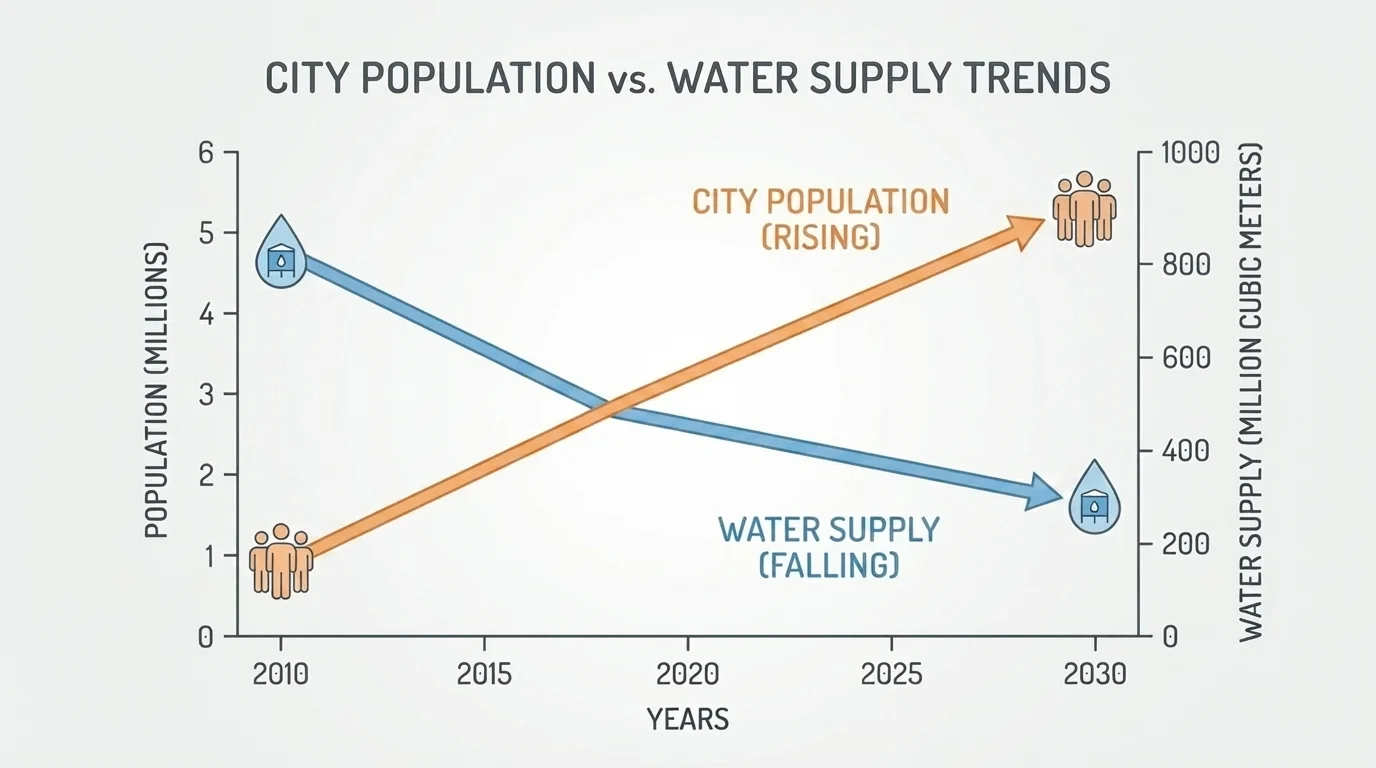
[Figure 3] Predictions use present and past evidence to suggest what may happen in the future. Geographers make predictions by studying trends. If population rises year after year while water supply stays the same or falls, then water stress may increase.
A trend is a general direction of change. For example, if a city's population grows from 200,000 to 260,000 to 320,000, the trend is upward. If reservoir levels drop over the same period, the two trends together suggest future shortages unless something changes.
Geographers sometimes calculate change to understand trends more clearly. If a town had 40 rainy days one year and 30 rainy days the next year, the number of rainy days changed by \(40 - 30 = 10\). If a population grew from 500,000 to 550,000, the increase was \(550{,}000 - 500{,}000 = 50{,}000\). These calculations support a written prediction, but the prediction still depends on geographic context.
Predictions are especially important for hazards. Meteorologists use storm tracks, ocean temperatures, and wind data to predict hurricane paths. Fire managers use rainfall, temperature, wind, and vegetation dryness to estimate wildfire risk. Farmers use temperature and precipitation data to predict crop conditions.
Predictions are not perfect. A prediction is strongest when it is based on reliable data and a clear pattern, but unexpected events can change outcomes. Even so, good predictions help communities prepare instead of reacting too late.
Using data to make a prediction
A coastal town records the number of days with flooding during very high tides over four years: Year 1: 4 days, Year 2: 7 days, Year 3: 9 days, Year 4: 12 days.
Step 1: Look for the trend.
The number of flooding days rises from 4 to 7 to 9 to 12. The trend is upward.
Step 2: Measure the overall change.
The total increase from Year 1 to Year 4 is \(12 - 4 = 8\) days.
Step 3: Make a careful prediction.
If the pattern continues, the town may experience more than 12 flooding days next year.
This prediction becomes stronger if tide data, storm records, and sea-level data support it.
Notice that the prediction does not say exactly what will happen. Instead, it gives the most likely outcome based on evidence. That is how geographers think: carefully, logically, and with attention to changing conditions.
Geographic problems happen at different scales. A local problem affects a community, town, or city. A state problem affects one state or province. A national problem affects an entire country. A global problem crosses many countries and continents. The same skill of interpreting geographic evidence works at every scale.
At the local level, a town may study traffic maps, school locations, and population growth to decide where to build a new road or bus route. At the state level, officials may compare drought maps and reservoir data to manage water use. At the national level, leaders may study migration patterns and job locations. At the global level, scientists may compare climate data across continents.
Scale matters because solutions change with scale. Planting trees along one stream may help a local flooding problem, but it will not solve worldwide climate change. International climate agreements matter globally, but they do not replace local plans for storm shelters, drainage systems, or wildfire evacuation routes.
| Scale | Example Problem | Useful Geographic Evidence | Possible Solution |
|---|---|---|---|
| Local | Flooding in a neighborhood | Rainfall maps, drainage maps, land use | Improve drains, protect wetlands |
| State | Drought across a region | Reservoir levels, precipitation records, farm use | Water restrictions, new storage plans |
| National | Population shift toward cities | Census data, job maps, transport networks | Expand housing and transit |
| Global | Climate change | Temperature trends, sea-level data, emissions maps | Reduce emissions, prepare vulnerable areas |
Table 1. Examples of geographic problems, evidence, and solutions at different scales.
Understanding scale also prevents oversimplified thinking. A problem that appears local may have larger causes. For example, food prices in one city can be affected by drought in another country or by storms that damage shipping routes.
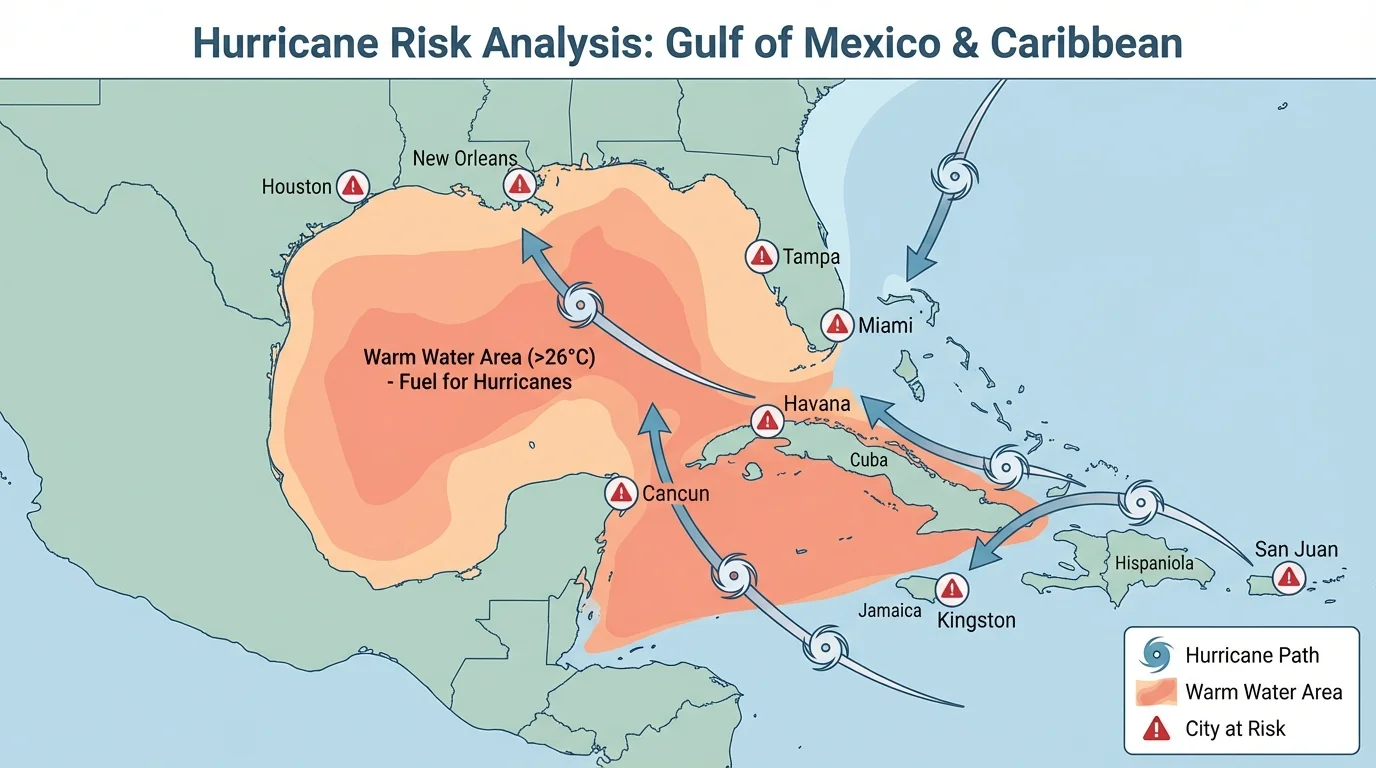
One clear example comes from hurricanes in the Gulf of Mexico and the Caribbean. Coastal places face repeated storm risk, as [Figure 4] shows through storm paths, warm water zones, and nearby cities. Warm ocean water can strengthen storms, and low-lying coasts are especially vulnerable to flooding from storm surge and heavy rain.
If geographers study hurricane tracks over many years, compare them with sea-surface temperatures, and map population along the coast, they can conclude that some coastal areas need stronger preparation plans than inland areas. From this evidence, they may predict that fast-growing coastal cities face higher risk if evacuation routes and building rules do not improve.
A second case study is drought in the western United States and northern Mexico. Rainfall maps, snowpack data, and river levels often show long dry periods. At the same time, population growth and farming increase demand for water. A justified solution might include water conservation, more efficient irrigation, and city planning that reduces waste.
A third case study is deforestation in the Amazon Basin. Satellite images from different years can show forest loss. When these images are compared with road maps and land-use maps, geographers may infer that new roads and land clearing are linked to changing forest cover. This evidence can support solutions such as protected areas, stronger land-use rules, and sustainable farming methods.
A fourth example is urban growth in Mexico City. Population data, transportation maps, and air quality measurements help geographers study how city expansion affects traffic, pollution, and water demand. A possible solution could include expanded public transit, cleaner energy use, and better water systems.
These case studies show that geography is never just about naming places. It is about understanding how physical features, climate, resources, and human choices interact. The same skills used to study hurricanes also apply to drought, urban growth, and forest change: gather evidence, find patterns, draw conclusions, predict outcomes, and justify solutions.
Case study: choosing a flood solution
A city along a river has more flooding than it did ten years ago. Geographers examine rainfall records, land-use maps, and satellite images.
Step 1: Review the evidence.
Rainfall is slightly higher than before, but land-use maps show many new parking lots and buildings.
Step 2: Draw a conclusion.
The increase in pavement likely causes faster runoff, which adds to flood risk.
Step 3: Predict future conditions.
If building continues without more drainage or green space, flooding will probably worsen.
Step 4: Justify a solution.
Protecting wetlands, adding permeable surfaces, and improving drains are stronger solutions than simply raising one riverbank because they address the broader cause.
Notice how the solution is tied to the evidence. A good answer is not just "do something about flooding." It explains why one action fits the data better than another.
[Figure 5] When geographers argue for a solution, they often organize their thinking as a claim supported by evidence and reasoning. The claim states what should be done. The evidence includes the maps, data, and observations. The reasoning explains why the evidence supports the claim.
For example, a claim might be: "This coastal town should improve evacuation routes and limit building in low-lying flood zones." The evidence might include elevation maps, hurricane history, and population growth near the shoreline. The reasoning explains that more people now live in high-risk areas, and safer routes reduce danger during storms.
Strong geographic solutions also consider trade-offs. A seawall may protect one area, but it can be expensive and may affect beaches or habitats. Water restrictions can save supplies, but they may challenge farmers and households. Protecting forests can reduce environmental damage, but it may affect short-term profits from logging or land clearing.
Geographers must consider multiple viewpoints. Residents, business owners, farmers, scientists, and government leaders may not agree on the best choice. A well-justified solution explains whose needs are being considered and why the benefits are worth the costs.
"Maps are the beginning of understanding, not the end of it."
This idea matters because evidence does not speak by itself. People must interpret it carefully. A good geographic argument moves from question to data to conclusion to action.
Not all data are equally useful. Some maps are old. Some measurements are incomplete. Some graphs leave out important information. A population map may show where people live, but not whether they have access to safe water or transportation. A weather map may show one storm, but not the long-term climate pattern.
Bias can also affect interpretation. If someone looks only for evidence that supports one idea, they may ignore other important facts. A careful geographer asks: Where did this data come from? When was it collected? What might be missing? Is there another source to compare?
For students, one of the most important habits is to avoid jumping to conclusions. If a place has dry weather, that does not automatically mean it will face drought. Water storage, rivers, farming, and population all matter too. If a city is crowded, that does not automatically mean it is poorly planned. Transportation systems, housing patterns, and job centers may explain the pattern.
Geography becomes most powerful when evidence is used responsibly. By reading maps closely, comparing sources, spotting patterns, and thinking about scale, students can understand real-world problems and support thoughtful solutions.